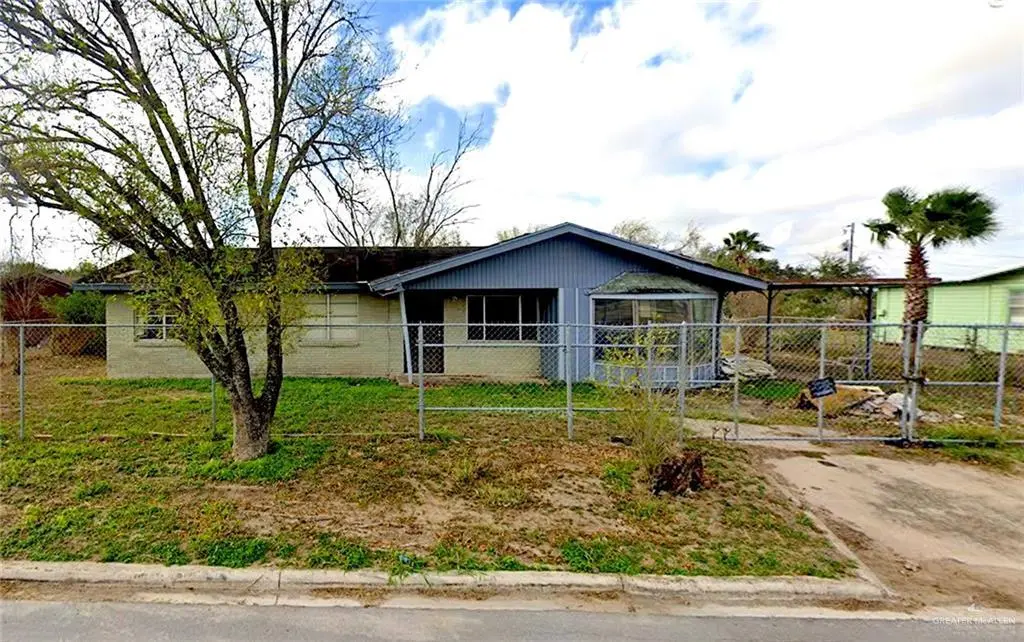
902 Alberta Rd · Edinburg, TX
Flood risk 3/10 · Minor
- FEMA flood zone
- X (shaded)
- Chance of flooding over 30 yrs
- 0.2%
- Est. flood insurance / yr
- $507 – $1,088
Fire risk 7/10 · Major
- Est. fire insurance / yr
- $1,222 – $2,270
Heat risk 9/10 · Severe
- Hot days now (above 111°F)
- 7 days/yr
- Hot days in 30 yrs
- 23 days/yr
Wind risk 8/10 · Major
- Chance of severe wind over 30 yrs
- 99.0%
Air-quality risk 2/10 · Minimal
- Unhealthy air days now
- 0 days/yr
- Unhealthy air days in 30 yrs
- 1 days/yr
Risk factors via First Street. Map © Google.
Why this score? — see what drove the C grade
The composite is a weighted blend of 9 inputs, each scored 0–100. Each bar is that input's sub-score; the figure is the points it added to the 100-point composite (weight × sub-score).
- Cash flow +19.8/30.0
- ARV discount +15.0/15.0
- DSCR +6.3/10.0
- 1% rule +5.9/10.0
- Livability +3.2/5.0
- Condition / age +2.5/5.0
- Rent growth +2.2/5.0
- Schools +2.2/10.0
- Appreciation +0.0/10.0
$149,900
🖨 Deal sheet 📄 Offer letter ✓ Due diligence
Listing remarks
Great investment opportunity in a rapidly growing area! This shell-only property is ideally located near major shopping centers, restaurants, and entertainment, including the Bert Ogden Arena. With strong potential for renovation or rental income, this property is perfect for investors looking to add value in a convenient and high-demand location. Endless possibilities await!
Key facts
- Bert ogden arena
- Near restaurants
- Near entertainment
Tags
Property features AI
Finance
- Other: Lot approximately 0.3014 acres (about 13,127 square feet); Fencing includes chain link and privacy fencing
- Financial info: Escrow amount noted (1500) in listing records
- HOA & community: No homeowners association
Exterior
- Parking: No garage; No carport; No covered parking
- Utilities: Public water; Public paved road; Electric water heater
- Home design: Single-story property (per building area and typical residential listing); Entry level not specified; Facing direction not specified; Property type: Residential (per construction and building info)
- Construction: Brick construction; Composition shingle roof; Pillar/post/pier foundation; Slab foundation; Built area approximately 1,312 (building area stated in records)
- Exterior features: Mature trees; Patio; Paved road access
Interior
- Kitchen: No conveying appliances; Electric water heater
- Flooring: No flooring specified
- Bathrooms: 2 full bathrooms
- Interior features: Countertops (other); Bay window(s); No window coverings
- Laundry & utility: Laundry area; Water heater listed as none (per records)
Neighborhood map
What this means for you Summary
Snapshot
- This is a 3-bed/2.0-bath single-family listed at $150k.
Deal economics
- At list price, monthly cash flow is $177 ($2k/yr) — positive.
- The deal already cash-flows at list — no discount required.
- Meets the 1% rule at list price ($2k rent vs $150k).
- Recommended offer: $145k (3.0% below list) — sets the bar for market timing.
- Cap rate 7.7% vs local median 2.4% in Edinburg — top-decile yield for the area; either an underpriced asset or a hidden risk that comps aren't pricing in. Stress-test before assuming the spread holds.
Location & tenants
- Location reads 64/100 on livability (#784 in TX) — a middle-class / working-renter tenant base. Strengths: cost of living A+, housing A+; Watch: employment D, amenities F, commute F.
- Edinburg CISD (urban): math 20% / reading 34% proficiency, ranked #699 of 826 in TX (top 85%) — low school quality limits family demand, transient renter base, plan for 1-2y turnover; 62% free/reduced lunch — lower-income household profile, screen leases tightly.
- Zoned schools: Dr Thomas Esparza El (math 12% / reading 27%, grade F, #3,583 of 4,322 statewide, top 86%, 435 students, 89% FRL); Francisco Barrientes Middle (math 12% / reading 33%, grade F, #1,341 of 1,662 statewide, top 82%, 1,215 students, 83% FRL); Edinburg H S (math 14% / reading 35%, grade F, #1,264 of 1,632 statewide, top 82%, 2,433 students, 83% FRL) — zoned schools average 85% FRL vs 62% district-wide (23 pts higher); higher-poverty schools than district average — tighter screening recommended.
- Market conditions: Rents soft (-1.1%/yr); 1003 active listings in the ZIP; 34 comparable units currently listed for rent nearby; rentals lingering (median 44d on market — plan ~5-8 weeks vacancy on turnover, expect pricing pressure); 53% of comp listings sitting > 30 days — soft ceiling on asking rent; 7,378 units permitted in Hidalgo County in 2024 (641 in 5+ unit buildings).
- This rent runs 35% of the median local income ($55k/yr) — at the standard rent-burdened threshold; future hikes will face affordability resistance.
Forward outlook
- Local home prices are declining (-3.0%/yr); year-one equity from $1k of loan paydown is wiped out by about $4k of value loss. Plan a longer hold.
- Hidalgo County population projected at +28% by 2050 — long-run rental-demand tailwind backs the buy-and-hold thesis.
Negotiation context
- It's been on market 49 days — a 3% lower offer ($145k) is reasonable based on typical stale-listing flexibility.
- 2 sale attempts with the ask held roughly flat each time — persistent listings suggest the price (not the market) is what's stuck; bring a comps-based counter.
Risks & watch-outs
- Climate carrying-cost: severe wind risk, 99% chance of damaging wind over 30y; major wildfire risk; extreme-heat days projected 7→23/yr by 2055 (HVAC capex compounding) — expect insurance premiums to compound above CPI over the hold.
Questions for the listing agent
- It's been on market 49 days. Have you received any prior offers? Is the seller open to a 3% concession, seller financing, or rate buy-down credit?
- Built in 1975 — when were the roof, HVAC, electrical panel, plumbing, and water heater last replaced?
- Is there a deadline driving the sale (1031 exchange, divorce, estate, relocation)? That informs how much negotiation room exists.
- Schools are D-rated, which usually means shorter tenancies and higher turnover. Who's the typical renter profile here, and what's been the actual vacancy rate?
- What's the average days-on-market for RENTAL listings here right now (not sales)? A rising rental-DOM trend means longer vacancies and softer asking-rent achievability than the comps imply.
- What's the recent tenant-quality profile in this submarket — average credit score on applications, eviction rate, late-payment / NSF rate, and stable-employment percentage? A property-management company in the area should have these aggregated.
- How much new for-sale + rental construction is in the pipeline within 1–3 miles? Heavy new supply typically softens prices + rents 12–24 months out; constrained supply supports both.
Investment metrics
- 1% rule
- 1.09% ✓
- Cap rate
- 7.71%
- Cash-on-cash
- 5.07%
- DSCR
- 1.23
- GRM
- 7.6
CMA / ARV
- ARV (median comp)
- $195,601
- List price
- $149,900
- Delta
- -23.36%
- Verdict
- UNDERPRICED
- Comps
- 20 within 1.0 mi
Show comp detail 8 sales within ~0.75 mi
| Address | Dist | Beds/Ba | Sqft | Sold | Price | $/sf | Match |
|---|---|---|---|---|---|---|---|
| 810 Esperanza St | 0.07mi | 3/2.0 | 1,260 (-4%) | 15mo | $125,000 | $99 | 78 |
| 814 Starshine Dr | 0.36mi | 4/2.0 (+1) | 1,272 (-3%) | 0mo | $120,000 | $94 | 73 |
| 906 Esperanza St | 0.06mi | 4/1.5 (+1) | 1,403 (+7%) | 12mo | $215,996 | $154 | 68 |
| 5010 Galilea St | 0.63mi | 3/2.0 | 1,434 (+9%) | 0mo | $234,900 | $164 | 55 |
| 4912 Galilea St | 0.64mi | 3/2.0 | 1,194 (-9%) | 4mo | $194,500 | $163 | 52 |
| 5014 Galilea St | 0.62mi | 3/2.0 | 1,421 (+8%) | 17mo | $235,000 | $165 | 43 |
| 4924 Galilea St | 0.63mi | 3/2.0 | 1,477 (+13%) | 13mo | $234,500 | $159 | 39 |
| 1809 S Wayne Dr W | 0.70mi | 3/2.0 | 1,454 (+11%) | 19mo | $229,000 | $157 | 33 |
Match score weights: distance 35% · size 25% · config 20% · recency 20%. Top-matched comps best support the ARV.
Projected returns pro-forma
-3.0% appreciation · 0.0% rent growth · sell at horizon
- IRR
- -12.0%
- Equity multiple
- 0.58×
- Total profit
- $-17,720
- Equity at exit
- $22,351
- IRR
- -8.5%
- Equity multiple
- 0.54×
- Total profit
- $-19,106
- Equity at exit
- $12,961
Cash invested: $41,972 (down + closing). Projections, not guarantees.
Landlord ↔ Tenant lean methodology
- Overall (STATE)
- 87 Strongly Landlord-Friendly
- State Texas
- 87 Strongly Landlord-Friendly · R+5
- County
- — inherits STATE
- City
- — inherits STATE
ZIP-level market 78542
- Home prices YoY
- -13.4%
- Rents YoY
- -1.1%
- Active inventory
- 1003
- Price-to-rent
- 7.6×
Monthly cashflow live
- Estimated rent
- $1,634 high interval (Pro) →
- Mortgage (P&I)
- −$786
- Tax from tax record
- −$265 /mo · $3,177/yr
- Insurance
- −$62
- HOA
- −$0
- Vacancy / Maint / Mgmt
- −$343
- Net cashflow
- $177
Break-even live
UW: 25.0% down · 7.5% · 30yr · 1.5% tax · 5.0% vac · 8.0% maint · 8.0% mgmt
Financing live
Cash to close
- Down payment
- $37,475
- Closing costs
- $4,497
- Reserves months
- —
- Total cash needed
- —
Loan-product check · same deal, 3 products live
Conventional
25% down · 7.5% · 30yr
- Down + closing
- —
- Monthly P&I
- —
- Monthly cashflow
- —
- DSCR
- —
- Eligible?
- —
Personal DTI + credit; lowest rate.
DSCR
20% down · 8.5% · 30yr
- Down + closing
- —
- Monthly P&I
- —
- Monthly cashflow
- —
- DSCR
- —
- Eligible?
- —
No personal income docs; deal must DSCR.
Hard money
10% down · 12.0% · 12mo
- Down + closing
- —
- Monthly P&I
- —
- Monthly cashflow
- —
- DSCR
- —
- Eligible?
- —
Short-term bridge; refi at stabilization.
Rent comps 34 comps
| Address | Beds | Baths | Sqft | Rent | $/sqft | DOM | Units | Dist |
|---|---|---|---|---|---|---|---|---|
| 3610 S Veterans Blvd Edinburg, TX | 3.0 | 2.5 | 1720 | $1,695 | $0.99 | 43d | 1 | 0.95mi |
| 3610 S Veterans Blvd Unit 2 Edinburg, TX | 3.0 | 2.0 | 1720 | $1,565 | $0.91 | 43d | 1 | 0.95mi |
| 3610 S Veterans Blvd Unit 22 Edinburg, TX | 3.0 | 2.5 | 1720 | $1,565 | $0.91 | 43d | 1 | 0.95mi |
| 3600 S Peak Rd Edinburg, TX | 3.0 | 2.5 | 1611 | $2,200 | $1.37 | 43d | 1 | 1.07mi |
| 3421 S Kerala Ave Unit D Edinburg, TX | 3.0 | 2.5 | 1700 | $1,850 | $1.09 | 43d | 1 | 1.10mi |
| 3421 S Kerala Ave Unit D Edinburg, TX | 3.0 | 2.5 | 1700 | $1,900 | $1.12 | 14d | 1 | 1.10mi |
| 4809 S Markland Ave Edinburg, TX | 3.0 | 2.0 | 1663 | $2,550 | $1.53 | 23d | 1 | 1.11mi |
| 2606 Garman St Edinburg, TX | 3.0 | 2.0 | 1445 | $1,900 | $1.31 | 19d | 1 | 1.12mi |
| 2614 Garman St Edinburg, TX | 3.0 | 2.0 | 1813 | $2,750 | $1.52 | 14d | 1 | 1.14mi |
| 2700 E Comal RD Edinburg, TX | 3.0 | 2.0 | 1511 | $2,300 | $1.52 | 14d | 1 | 1.15mi |
| 2716 E Conroe Rd Edinburg, TX | 3.0 | 2.5 | 1623 | $2,300 | $1.42 | 14d | 1 | 1.17mi |
| 2700 Garman St Edinburg, TX | 3.0 | 2.0 | 1272 | $1,950 | $1.53 | 14d | 1 | 1.18mi |
| 3719 Alvarado St Edinburg, TX | 3.0 | 2.5 | 1543 | $2,095 | $1.36 | 43d | 1 | 1.32mi |
| 3301 S Chloe Ave Unit 2 Edinburg, TX | 3.0 | 2.0 | 1050 | $1,350 | $1.29 | 23d | 1 | 1.34mi |
| 2104 E San Andrea St Unit 4 Edinburg, TX | 2.0 | 2.0 | 950 | $1,200 | $1.26 | 14d | 1 | 1.34mi |
| 2109 E San Andrea St Unit 4 Edinburg, TX | 3.0 | 2.0 | 1150 | $1,350 | $1.17 | 43d | 1 | 1.34mi |
| 2109 E San Andrea St Unit 3 Edinburg, TX | 2.0 | 2.0 | 1000 | $1,150 | $1.15 | 23d | 1 | 1.34mi |
| 2112 E San Andrea St Edinburg, TX | 2.0 | 2.0 | 1000 | $1,275 | $1.27 | 43d | 1 | 1.35mi |
| 4724 N Ebony St Apt 4 Pharr, TX | 3.0 | 2.0 | 1040 | $1,100 | $1.06 | 43d | 1 | 1.37mi |
| 3211 S Chloe Ave Unit 4 Edinburg, TX | 2.0 | 2.0 | 1050 | $1,400 | $1.33 | 43d | 1 | 1.38mi |
| 3211 S Chloe Ave Unit 3 Edinburg, TX | 2.0 | 2.0 | 1050 | $1,250 | $1.19 | 43d | 1 | 1.38mi |
| 3211 S Chloe Ave Unit 2 Edinburg, TX | 2.0 | 2.0 | 1053 | $1,350 | $1.28 | 43d | 1 | 1.38mi |
| 2308 E San Andrea St Unit 4 Edinburg, TX | 3.0 | 2.0 | 1153 | $1,500 | $1.30 | 23d | 1 | 1.39mi |
| 2308 E San Andrea St Unit 3 Edinburg, TX | 3.0 | 2.0 | 1153 | $1,450 | $1.26 | 23d | 1 | 1.39mi |
| 5006 N Crown Pt Unit 4 Pharr, TX | 3.0 | 2.0 | 1100 | $1,300 | $1.18 | 43d | 1 | 1.44mi |
| 5006 N Crown Pt Unit 2 Pharr, TX | 3.0 | 2.0 | 1100 | $1,350 | $1.23 | 43d | 1 | 1.44mi |
| 2304 E Viviana St Unit 2 Edinburg, TX | 3.0 | 2.0 | 1025 | $1,350 | $1.32 | 14d | 1 | 1.44mi |
| 4604 S Sugar Rd Edinburg, TX | 1.0–2.0 | 1.0–2.0 | 671 | $1,260 | $1.88 | 14d | 9 | 1.45mi |
| 5228 S Sugar Rd Edinburg, TX | 2.0 | 2.0 | 965 | $1,139 | $1.18 | 43d | 1 | 1.45mi |
| 2405 E Viviana St Unit 3 Edinburg, TX | 3.0 | 2.0 | 1214 | $1,400 | $1.15 | 23d | 1 | 1.46mi |
| 5604 N Crown Pt Pharr, TX | 3.0 | 2.5 | 1700 | $1,895 | $1.11 | 43d | 1 | 1.47mi |
| 5520 N Crown Pt Pharr, TX | 3.0 | 2.5 | 1857 | $2,850 | $1.53 | 23d | 1 | 1.48mi |
| 5202 N Hiawatha Dr Pharr, TX | 3.0 | 2.0 | 1073 | $1,250 | $1.16 | 43d | 1 | 1.49mi |
| 5514 N Crown Pt Pharr, TX | 3.0 | 2.5 | 1700 | $1,750 | $1.03 | 43d | 1 | 1.50mi |
Listing history 18 events
-
2026-06-18days on market $149,900 Active 49 DOM
-
2026-06-17days on market $149,900 Active 48 DOM
-
2026-06-16days on market $149,900 Active 47 DOM
-
2026-06-15days on market $149,900 Active 46 DOM
-
2026-06-14days on market $149,900 Active 44 DOM
-
2026-06-13days on market $149,900 Active 43 DOM
-
2026-06-10days on market $149,900 Active 41 DOM
-
2026-06-09days on market $149,900 Active 40 DOM
-
2026-06-08days on market $149,900 Active 39 DOM
-
2026-06-07days on market $149,900 Active 38 DOM
-
2026-06-03days on market $149,900 Active 34 DOM
-
2026-06-02days on market $149,900 Active 33 DOM
-
2026-06-01days on market $149,900 Active 32 DOM
-
2026-05-31days on market $149,900 Active 31 DOM
-
2026-05-31days on market $149,900 Active 30 DOM
-
2026-04-29price $124,900
-
2026-04-29$149,900 Active 378-char remark
-
2026-04-28$119,900 Active
ⓘ Source: listings_history table (triggers on properties + properties_extension) + one-shot
backfill from property_details.listing_events for pre-trigger history.
Tax reassessment forecast TX · Resets to sale price
- Current annual tax
- $3,177 · $265/mo
- Projected year-2 tax
- $3,177 · $265/mo
- Expected delta
- $0/yr ($0/mo · 0.0%)
ⓘ Screening estimate from a state-policy table — verify with the county assessor before closing.
Climate risk First Street
- Flood 3/10 Moderate FEMA zone X (shaded) · 20% chance over 30 yrs
- Wildfire 7/10 Severe
- Heat 9/10 Extreme 7 d/yr ≥111°F today · 23 d/yr by 30 yrs out
- Wind 8/10 Severe 99% chance of damaging wind over 30 yrs
- Air quality 2/10 Low 0 unhealthy d/yr today · 1 by 30 yrs out
Nearby sold comps map
Loading sold comps map…
Walkable amenities ~0.75 mi
Loading nearby amenities…
Taxation est. · year 1
- Rental income
- $19,602
- − Mortgage interest
- −$8,397
- − Property taxes
- −$3,177
- − Insurance
- −$750
- − Repairs & maintenance
- −$1,568
- − Management
- −$1,568
- − Depreciation
- −$4,361
- Taxable loss
- −$218
- Est. tax savings @ 24.0%
- +$52
- After-tax cash flow
- $2,179/yr
For passive investors: Depreciation is non-cash, so a rental often shows a tax loss while cash-flowing — sheltering income. Rental losses are passive: they offset passive income freely, and up to $25,000/yr can offset ordinary (W-2) income if you actively participate and your MAGI is under $100k (phasing out to $0 by $150k); unused losses carry forward. On sale, claimed depreciation is recaptured at up to 25%, and gains may owe capital-gains tax (a 1031 exchange can defer both). Figures are a year-1 estimate at your 24.0% rate — not tax advice; consult a CPA.
Schools (NCES district)
- District
- Edinburg CISD
- NCES district ID
- 4818180
- Math proficiency
- 20% ▼ -34.00%
- Reading proficiency
- 34% ▼ -11.00%
- Median HH income
- $36,985
- Composite
- 22.42/100
- National rank
- #8114
- State rank
- #699 of 826 in TX
Livability — Edinburg
- Score
- 64/100
- State rank
- #784
- US rank
- #14319
Category grades
Schools grade is shown separately in the Schools card above.
Census & demographics
- Census place
- Edinburg, TX
- County
- Hidalgo County · 623,128 people
- City population
- 178,279
- Metro
- McAllen-Edinburg-Mission, TX
- Population (ZIP)
- 89,401
- Household income
- $55,243
- Rent vs Own
- Severe rent burden
- 1240.0
Population outlook (Hidalgo County) Hauer SSP2
- Today (2025)
- 955,232 people
- By 2030
- 1,009,774 · +5.7%
- By 2040
- 1,120,332 · +17.3%
- By 2050
- 1,225,036 · +28.2%
- By 2075
- 1,439,189 · +50.7%
- By 2100
- 1,533,429 · +60.5%
Race, ethnicity, and origin ACS 2023
- Neighborhood character
- Predominantly Hispanic (95%)
- Race & ethnicity
- Hispanic / Latino 95% Two or more races 59% White 4%
- Hispanic origin (detail)
- Mexican 91%
- Foreign-born
- 25% · Canada
- Languages at home
- 15% English-only · Spanish 84%
Political lean MEDSL · Hidalgo
- 2024 margin
- Toss-up / Even · D 48.1% · R 51.0%
- 2008→2024 swing
- -41.6pp toward R · 2008: 38.7pp · 2024: -2.9pp
- All cycles
- 2024: R+2.9 2020: D+17.1 2016: D+40.5 2012: D+41.8 2008: D+38.7
Not yet ingested
- Civics
- —
Market trends
- HPI YoY
- ▼ -34.17%
- Current HPI
- 220.921
- Rent YoY
- ▼ -1.07%
- Metro
- McAllen-Edinburg-Mission, TX
- State GDP YoY
- ▲ 3.95%
- F500 in state
- 110
Industry mix (Fortune 500 HQ in TX)
| Industry | F500 HQs | Revenue |
|---|---|---|
| Energy | 16 | $1,198B |
|
||
| Technology | 5 | $198B |
|
||
| Engineering / Construction | 4 | $72B |
|
||
| Energy Services | 3 | $60B |
|
||
| Utilities | 3 | $41B |
|
||
| Healthcare | 2 | $330B |
|
||
Price history
+4.2% since first listed3 events — show timeline
- 2026-04-29 Price Changed $124,900 MCALLENMLS
- 2026-04-29 Listed $149,900 MCALLENMLS
- 2026-04-28 Listed $119,900 MCALLENMLS
Property tax history
+9.7%/yrLatest (2025): $3,177 · +19.5% YoY. Source: county tax records.
Cash-flow waterfall
monthlySold comps — $/sqft
last 12 mo · ≤1 miLoading sold comps…