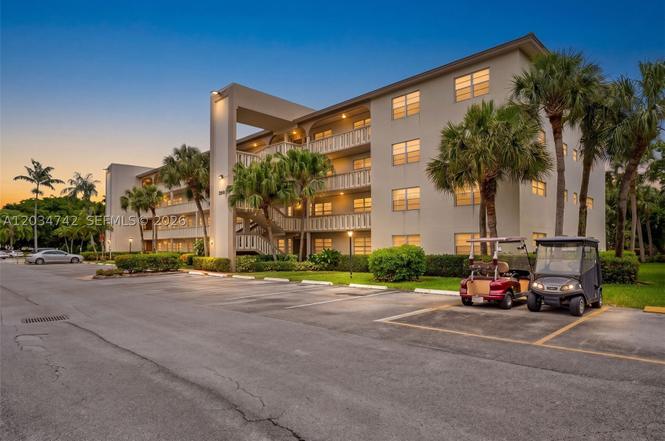
2401 Antigua Cir Unit E3 · Coconut Creek, FL
Flood risk No data
- FEMA flood zone
- —
- Chance of flooding over 30 yrs
- —
- Est. flood insurance / yr
- —
Fire risk No data
- Est. fire insurance / yr
- —
Heat risk No data
- Hot days now (above threshold)
- —
- Hot days in 30 yrs
- —
Wind risk No data
- Chance of severe wind over 30 yrs
- —
Air-quality risk No data
- Unhealthy air days now
- —
- Unhealthy air days in 30 yrs
- —
Risk factors via First Street. Map © Google.
Why this score? — see what drove the B- grade
The composite is a weighted blend of 9 inputs, each scored 0–100. Each bar is that input's sub-score; the figure is the points it added to the 100-point composite (weight × sub-score).
- Cash flow +25.8/30.0
- 1% rule +10.0/10.0
- DSCR +8.6/10.0
- ARV discount +7.5/15.0
- Livability +4.2/5.0
- Schools +4.1/10.0
- Condition / age +2.5/5.0
- Rent growth +2.3/5.0
- Appreciation +0.0/10.0
$75,500
🖨 Deal sheet 📄 Offer letter ✓ Due diligence
Listing remarks
Spacious 1-bedroom, 1.5-bath condo in sought-after Wynmoor Golf Village. This bright unit features a large primary suite with wall-to-wall closets, an open layout, and a private balcony with tranquil views. A great opportunity to update and make it your own. Enjoy resort-style living in this gated 55+ community with golf, pools, fitness center, pickleball, tennis, theater, on-site dining, courtesy transportation, and countless social activities. Conveniently located near shopping, dining, major highways, and just minutes from Pompano Beach.
Key facts
- Gated community
- On-site dining
- Fitness center
Tags
Property features AI
Finance
- Financial info: Lease considered; No pets allowed
- HOA & community: Monthly association fee; Association covers common areas, cable TV, security, trash, and water; Community amenities include clubhouse, fitness center, laundry facilities, pickleball, pool, tennis courts, and elevators; Senior community
Exterior
- Parking: Assigned parking; Guest parking available; One covered space (garage)
- Security: Complex fenced; Security guard
- Utilities: Association-managed pool
- Home design: Attached property; 4-story building; Entry on the 3rd level
- Construction: Block construction; Resale property
- Exterior features: Balcony; Screened balcony/porch
Interior
- Kitchen: Electric range; Refrigerator
- Bedrooms: Bedroom located on the main level
- Flooring: Carpet; Tile
- Bathrooms: 1 full bathroom; 1 half bathroom
- Heating & cooling: Central heating; Central air; Ceiling fans
- Interior features: Bedroom on main level; Third-floor entry
- Laundry & utility: Common area laundry
Neighborhood map
What this means for you Summary
Snapshot
- This is a 1-bed/2.0-bath condo listed at $76k.
Deal economics
- At list price, monthly cash flow is $183 ($2k/yr) — positive.
- The deal already cash-flows at list — no discount required.
- Meets the 1% rule at list price ($2k rent vs $76k).
- Cap rate 9.2% vs local median 3.7% in Coconut Creek — top-decile yield for the area; either an underpriced asset or a hidden risk that comps aren't pricing in. Stress-test before assuming the spread holds.
Location & tenants
- Location reads 85/100 on livability (#30 in FL, #617 nationally) — a professional / high-income tenant draw. Strengths: commute A+, housing A+, health & safety A+; Watch: amenities F.
- Broward (suburban): math 42% / reading 53% proficiency, ranked #46 of 73 in FL (top 63%) — families likely to look elsewhere, expect single-tenant / working-renter base with shorter leases.
- Market conditions: Rents soft (-0.9%/yr); 326 active listings in the ZIP; 40 comparable units currently listed for rent nearby; rentals at typical pace (median 24d on market — plan ~3-4 weeks tenant-placement turnaround); 2,111 units permitted in Broward County in 2024 (1,265 in 5+ unit buildings).
- This rent runs 38% of the median local income ($57k/yr) — at the standard rent-burdened threshold; future hikes will face affordability resistance.
Forward outlook
- Local home prices are declining (-3.0%/yr); year-one equity from $522 of loan paydown is wiped out by about $2k of value loss. Plan a longer hold.
- Broward County population projected at +34% by 2050 — long-run rental-demand tailwind backs the buy-and-hold thesis.
Negotiation context
- Only 7 days on market — expect competitive offers; lowballing is unlikely to land.
- 5 sale attempts; this cycle's ask is 5940% above the opening price — seller raised mid-cycle; expect resistance to lowballs.
- Current owner paid $44k; list at $76k implies a 72% gain — meaningful room to come down on a strong offer.
Risks & watch-outs
- Watch-outs: property tax is 3.1% of price; HOA is 34% of rent.
Questions for the listing agent
- Built in 1979 — when were the roof, HVAC, electrical panel, plumbing, and water heater last replaced?
- Property tax is high relative to price — has the assessment been appealed recently, and will the sale trigger a re-assessment?
- What does the HOA fee cover, when was the last increase, and are there any pending special assessments or reserve-fund shortfalls?
- Any open or pending special assessments — roof, HVAC, plumbing, elevator, façade? What's the per-unit balance and payoff schedule, and is the seller paying it off at close or rolling it to the buyer?
- Is there a deadline driving the sale (1031 exchange, divorce, estate, relocation)? That informs how much negotiation room exists.
- Schools are B-rated — typically a magnet for longer-tenancy family renters. What's the average tenant stay here, and is there a school-zone premium baked into asking?
- What's the average days-on-market for RENTAL listings here right now (not sales)? A rising rental-DOM trend means longer vacancies and softer asking-rent achievability than the comps imply.
- What's the recent tenant-quality profile in this submarket — average credit score on applications, eviction rate, late-payment / NSF rate, and stable-employment percentage? A property-management company in the area should have these aggregated.
- How much new apartment / multifamily construction is in the pipeline within 1–3 miles? Heavy new supply (>2% of stock underway) typically softens rents 12–24 months out; light construction supports rent growth.
Investment metrics
- 1% rule
- 2.39% ✓
- Cap rate
- 9.21%
- Cash-on-cash
- 10.40%
- DSCR
- 1.46
- GRM
- 3.5
CMA / ARV
No comps found within radius.
Projected returns pro-forma
-3.0% appreciation · 0.0% rent growth · sell at horizon
- IRR
- -7.3%
- Equity multiple
- 0.75×
- Total profit
- $-5,379
- Equity at exit
- $11,257
- IRR
- -8.8%
- Equity multiple
- 0.61×
- Total profit
- $-8,170
- Equity at exit
- $6,528
Cash invested: $21,140 (down + closing). Projections, not guarantees.
Landlord ↔ Tenant lean methodology
- Overall (STATE)
- 87 Strongly Landlord-Friendly
- State Florida
- 87 Strongly Landlord-Friendly · R+3
- County
- — inherits STATE
- City
- — inherits STATE
ZIP-level market 33066
- Home prices YoY
- -29.3%
- Rents YoY
- -0.9%
- Active inventory
- 326
- Price-to-rent
- 3.5×
Monthly cashflow live
- Estimated rent
- $1,803 high interval (Pro) →
- Mortgage (P&I)
- −$396
- Tax from tax record
- −$194 /mo · $2,324/yr
- Insurance
- −$31
- HOA
- −$620
- Vacancy / Maint / Mgmt
- −$379
- Net cashflow
- $183
Break-even live
UW: 25.0% down · 7.5% · 30yr · 1.5% tax · 5.0% vac · 8.0% maint · 8.0% mgmt
Financing live
Cash to close
- Down payment
- $18,875
- Closing costs
- $2,265
- Reserves months
- —
- Total cash needed
- —
Loan-product check · same deal, 3 products live
Conventional
25% down · 7.5% · 30yr
- Down + closing
- —
- Monthly P&I
- —
- Monthly cashflow
- —
- DSCR
- —
- Eligible?
- —
Personal DTI + credit; lowest rate.
DSCR
20% down · 8.5% · 30yr
- Down + closing
- —
- Monthly P&I
- —
- Monthly cashflow
- —
- DSCR
- —
- Eligible?
- —
No personal income docs; deal must DSCR.
Hard money
10% down · 12.0% · 12mo
- Down + closing
- —
- Monthly P&I
- —
- Monthly cashflow
- —
- DSCR
- —
- Eligible?
- —
Short-term bridge; refi at stabilization.
Rent comps 40 comps
| Address | Beds | Baths | Sqft | Rent | $/sqft | DOM | Units | Dist |
|---|---|---|---|---|---|---|---|---|
| 2401 Antigua Cir Unit J3 Coconut Creek, FL | 1.0 | 1.5 | 798 | $1,650 | $2.07 | 24d | 1 | 0.01mi |
| 2404 Antigua Cir Unit J4 Coconut Creek, FL | 1.0 | 1.5 | 798 | $1,500 | $1.88 | 24d | 1 | 0.16mi |
| 1901 Lyons Rd Coconut Creek, FL | 1.0–3.0 | 1.0–2.0 | 1121 | $1,770 | $1.58 | 1d | 12 | 0.16mi |
| 2604 Nassau Bnd Unit F1 Coconut Creek, FL | 2.0 | 2.0 | 962 | $1,900 | $1.98 | 24d | 1 | 0.54mi |
| 2602 Nassau Bnd Unit F1 Coconut Creek, FL | 2.0 | 2.0 | 940 | $1,800 | $1.91 | 24d | 1 | 0.54mi |
| 3305 Aruba Way Unit G2 Coconut Creek, FL | 1.0 | 1.0 | 900 | $1,700 | $1.89 | 24d | 1 | 0.57mi |
| 2474 NW 49th Ter #766 Coconut Creek, FL | 2.0 | 2.0 | 974 | $2,300 | $2.36 | 12d | 1 | 0.59mi |
| 2606 Nassau Bnd Unit B1 Coconut Creek, FL | 2.0 | 2.0 | 962 | $2,300 | $2.39 | 5d | 1 | 0.61mi |
| 2606 Nassau Bnd Unit B1 Coconut Creek, FL | 2.0 | 2.0 | 962 | $2,300 | $2.39 | 3d | 1 | 0.61mi |
| 2703 Nassau Bnd Unit D1 Coconut Creek, FL | 1.0 | 1.0 | 662 | $1,650 | $2.49 | 24d | 1 | 0.63mi |
| 3303 Aruba Way Unit 2 Coconut Creek, FL | 1.0 | 1.0 | 900 | $1,700 | $1.89 | 24d | 1 | 0.66mi |
| 3401 Bimini Ln Unit H3 Coconut Creek, FL | 1.0 | 1.5 | 861 | $1,700 | $1.97 | 18d | 1 | 0.68mi |
| 2900 NW 42nd Ave Unit A110 Coconut Creek, FL | 2.0 | 2.0 | 930 | $2,000 | $2.15 | 5d | 1 | 0.69mi |
| 2342 NW 36th Ave #2342 Coconut Creek, FL | 2.0 | 2.5 | 1068 | $2,395 | $2.24 | 7d | 1 | 0.71mi |
| 2342 NW 36th Ave #2342 Coconut Creek, FL | 2.0 | 2.5 | 1068 | $2,395 | $2.24 | 24d | 1 | 0.71mi |
| 2900 NW 42nd Ave Unit A103 Coconut Creek, FL | 2.0 | 2.0 | 970 | $2,100 | $2.16 | 24d | 1 | 0.72mi |
| 2900 NW 42nd Ave Unit A103 Coconut Creek, FL | 2.0 | 2.0 | 970 | $2,100 | $2.16 | 22d | 1 | 0.72mi |
| 2707 Nassau Bnd Unit H2 Coconut Creek, FL | 2.0 | 2.0 | 1119 | $2,050 | $1.83 | 24d | 1 | 0.74mi |
| 4801 Martinique Pl Unit B2 Coconut Creek, FL | 1.0 | 2.0 | 962 | $1,500 | $1.56 | 24d | 1 | 0.77mi |
| 1102 Bahama Bnd Unit D2 Coconut Creek, FL | 1.0 | 1.0 | 662 | $1,750 | $2.64 | 3d | 1 | 0.81mi |
| 1102 Bahama Bnd Coconut Creek, FL | 1.0–2.0 | 1.0–2.0 | 812 | $1,700 | $2.09 | 12d | 2 | 0.81mi |
| 1102 Bahama Bnd Coconut Creek, FL | 1.0–2.0 | 1.0–2.0 | 812 | $1,750 | $2.16 | 24d | 2 | 0.81mi |
| 4602 Martinique Way Unit H2 Coconut Creek, FL | 2.0 | 2.0 | 1119 | $1,750 | $1.56 | 24d | 1 | 0.83mi |
| 911 Lyons Rd #2207 Coconut Creek, FL | 1.0 | 1.0 | 821 | $1,600 | $1.95 | 24d | 1 | 0.85mi |
| 841 Lyons Rd #24201 Coconut Creek, FL | 2.0 | 2.0 | 975 | $2,100 | $2.15 | 24d | 1 | 0.87mi |
| 851 Lyons Rd #22108 Coconut Creek, FL | 1.0 | 1.0 | 620 | $1,650 | $2.66 | 4d | 1 | 0.90mi |
| 1207 Bahama Bnd Unit E2 Coconut Creek, FL | 1.0 | 1.5 | 819 | $1,950 | $2.38 | 24d | 1 | 0.93mi |
| 3439 Cocoplum Cir #3420 Coconut Creek, FL | 2.0 | 2.0 | 982 | $2,250 | $2.29 | 7d | 1 | 0.93mi |
| 3427 NW 47th Ave #3190 Coconut Creek, FL | 2.0 | 2.0 | 955 | $2,300 | $2.41 | 22d | 1 | 0.93mi |
| 3427 NW 47th Ave #3190 Coconut Creek, FL | 2.0 | 2.0 | 955 | $2,300 | $2.41 | 7d | 1 | 0.93mi |
| 821 Lyons Rd #21102 Coconut Creek, FL | 2.0 | 2.0 | 975 | $2,100 | $2.15 | 24d | 1 | 0.93mi |
| 1902 Bermuda Cir Unit G2 Coconut Creek, FL | 1.0 | 1.0 | 800 | $1,600 | $2.00 | 24d | 1 | 0.94mi |
| 1203 Bahama Bnd Coconut Creek, FL | 2.0–3.0 | 2.0 | 1005 | $1,950 | $1.94 | 17d | 2 | 0.95mi |
| 601 Lyons Rd #7105 Coconut Creek, FL | 2.0 | 2.0 | 975 | $2,050 | $2.10 | 24d | 1 | 0.99mi |
| 1212 Bahama Bnd Coconut Creek, FL | 2.0 | 2.0 | 938 | $2,000 | $2.13 | 24d | 1 | 1.01mi |
| 701 Lyons Rd #13206 Coconut Creek, FL | 1.0 | 1.0 | 620 | $1,750 | $2.82 | 20d | 1 | 1.02mi |
| 651 Lyons Rd Coconut Creek, FL | 1.0 | 1.0 | 690 | $1,715 | $2.48 | 24d | 2 | 1.02mi |
| 651 Lyons Rd #10104 Coconut Creek, FL | 1.0 | 1.0 | 761 | $1,780 | $2.34 | 15d | 1 | 1.02mi |
| 1904 Bermuda Cir Unit G3 Coconut Creek, FL | 2.0 | 2.0 | 1000 | $1,600 | $1.60 | 24d | 1 | 1.03mi |
| 3757 Cocoplum Cir #3567 Coconut Creek, FL | 2.0 | 2.0 | 982 | $2,100 | $2.14 | 24d | 1 | 1.04mi |
HOA detail condo
- Monthly dues
- $620 · $7,440/yr
- Likely covers
- poolgymsecurity
- Assessments
- None detected in remarks — confirm with the listing agent.
Listing history 6 events
-
2026-06-18days on market $75,500 Active 7 DOM
-
2026-06-17days on market $75,500 Active 6 DOM
-
2026-06-16days on market $75,500 Active 5 DOM
-
2026-06-15days on market $75,500 Active 4 DOM
-
2026-06-13remarks 546-char remark
-
2026-06-13$75,500 Active 2 DOM
ⓘ Source: listings_history table (triggers on properties + properties_extension) + one-shot
backfill from property_details.listing_events for pre-trigger history.
Tax reassessment forecast FL · Resets to sale price
- Current annual tax
- $2,324 · $194/mo
- Projected year-2 tax
- $2,324 · $194/mo
- Expected delta
- $0/yr ($0/mo · 0.0%)
ⓘ Screening estimate from a state-policy table — verify with the county assessor before closing.
Nearby sold comps map
Loading sold comps map…
Walkable amenities ~0.75 mi
Loading nearby amenities…
Taxation est. · year 1
- Rental income
- $21,635
- − Mortgage interest
- −$4,229
- − Property taxes
- −$2,324
- − Insurance
- −$378
- − Repairs & maintenance
- −$1,731
- − Management
- −$1,731
- − HOA
- −$7,440
- − Depreciation
- −$2,196
- Taxable income
- $1,606
- Est. tax owed @ 24.0%
- −$385
- After-tax cash flow
- $1,813/yr
For passive investors: Depreciation is non-cash, so a rental often shows a tax loss while cash-flowing — sheltering income. Rental losses are passive: they offset passive income freely, and up to $25,000/yr can offset ordinary (W-2) income if you actively participate and your MAGI is under $100k (phasing out to $0 by $150k); unused losses carry forward. On sale, claimed depreciation is recaptured at up to 25%, and gains may owe capital-gains tax (a 1031 exchange can defer both). Figures are a year-1 estimate at your 24.0% rate — not tax advice; consult a CPA.
Schools (NCES district)
- District
- Broward
- NCES district ID
- 1200180
- Math proficiency
- 42% ▼ -18.00%
- Reading proficiency
- 53% ▼ -5.00%
- Median HH income
- $52,139
- Composite
- 40.88/100
- National rank
- #3621
- State rank
- #46 of 73 in FL
Livability — Coconut Creek
- Score
- 85/100
- State rank
- #30
- US rank
- #617
Category grades
Schools grade is shown separately in the Schools card above.
Census & demographics
- Census place
- Coconut Creek, FL
- County
- Broward County · 1,963,430 people
- City population
- 50,557
- Metro
- Miami-Fort Lauderdale-Pompano Beach, FL
- Population (ZIP)
- 16,719
- Household income
- $57,051
- Rent vs Own
- Severe rent burden
- 433.0
Population outlook (Broward County) Hauer SSP2
- Today (2025)
- 2,207,033 people
- By 2030
- 2,360,704 · +7.0%
- By 2040
- 2,661,208 · +20.6%
- By 2050
- 2,946,698 · +33.5%
- By 2075
- 3,602,273 · +63.2%
- By 2100
- 3,970,984 · +79.9%
Race, ethnicity, and origin ACS 2023
- Neighborhood character
- Diverse neighborhood (Simpson 0.62)
- Race & ethnicity
- White 56% Hispanic / Latino 23% Two or more races 20% Black 11% Asian 4%
- Hispanic origin (detail)
- Mexican 1% Puerto Rican 3% Cuban 3%
- Common ancestry
- Scotch-Irish 4% Romanian 4% Italian 2%
- Foreign-born
- 33% · Canada, Jamaica, Vietnam
- Languages at home
- 65% English-only · Spanish 19% Other Indo-European 7% French/Haitian/Cajun 3%
Political lean MEDSL · Broward
- 2024 margin
- D (+17.0) · D 58.0% · R 41.0%
- 2008→2024 swing
- -17.8pp toward R · 2008: 34.7pp · 2024: 17.0pp
- All cycles
- 2024: D+17.0 2020: D+29.8 2016: D+35.0 2012: D+34.9 2008: D+34.7
Not yet ingested
- Civics
- —
Market trends
- HPI YoY
- ▼ -121.75%
- Current HPI
- 293.3769
- Rent YoY
- ▼ -0.95%
- Metro
- Miami-Fort Lauderdale-Pompano Beach, FL
- State GDP YoY
- ▲ 3.28%
- F500 in state
- 36
Industry mix (Fortune 500 HQ in FL)
| Industry | F500 HQs | Revenue |
|---|---|---|
| Industrial Technology | 2 | $29B |
|
||
| Insurance | 2 | $17B |
|
||
| Retail | 1 | $60B |
|
||
| Technology Distribution | 1 | $58B |
|
||
| Homebuilding | 1 | $35B |
|
||
| Technology Manufacturing | 1 | $35B |
|
||
Price history
-97.2% since first listed13 events — show timeline
- 2026-06-12 Listed for Rent $1,250 RMLSFL
- 2026-06-11 Listed $75,500 MARMLS
- 2026-05-01 Listing Removed — Beaches MLS
- 2026-03-26 Price Changed $77,500 Beaches MLS
- 2025-10-15 Listed $94,999 Beaches MLS
- 2025-08-04 Rental Removed $1,500 MARMLS
- 2025-08-04 Listing Removed — MARMLS
- 2025-05-20 Price Changed $112,500 MARMLS
- 2025-04-18 Listed for Rent $1,500 MARMLS
- 2025-04-14 Price Changed $120,000 MARMLS
- 2025-02-21 Listed $125,000 MARMLS
- 1995-12-13 Sold (Public Records) $44,000 Public Records
- 1991-06-25 Sold (Public Records) $44,000 Public Records
Property tax history
+22.6%/yrLatest (2025): $2,324 · +752.3% YoY. Source: county tax records.
Cash-flow waterfall
monthlySold comps — $/sqft
last 12 mo · ≤1 miLoading sold comps…