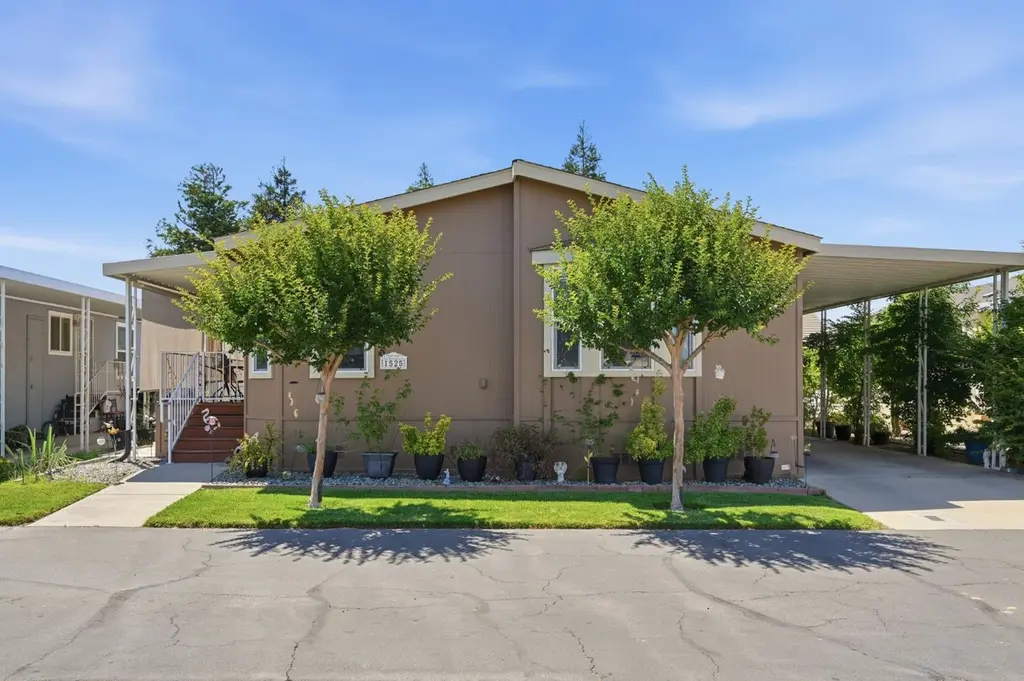
1525 Duke #51 · Livingston, CA
Flood risk 1/10 · Minimal
- FEMA flood zone
- X (unshaded)
- Chance of flooding over 30 yrs
- 0.0%
- Est. flood insurance / yr
- $507 – $1,088
Fire risk 7/10 · Major
- Est. fire insurance / yr
- $659 – $1,223
Heat risk 7/10 · Major
- Hot days now (above 103°F)
- 8 days/yr
- Hot days in 30 yrs
- 19 days/yr
Wind risk 1/10 · Minimal
- Chance of severe wind over 30 yrs
- —
Air-quality risk 10/10 · Severe
- Unhealthy air days now
- 34 days/yr
- Unhealthy air days in 30 yrs
- 35 days/yr
Risk factors via First Street. Map © Google.
Why this score? — see what drove the B+ grade
The composite is a weighted blend of 9 inputs, each scored 0–100. Each bar is that input's sub-score; the figure is the points it added to the 100-point composite (weight × sub-score).
- Cash flow +30.0/30.0
- ARV discount +14.8/15.0
- DSCR +10.0/10.0
- 1% rule +9.9/10.0
- Livability +3.3/5.0
- Schools +2.8/10.0
- Rent growth +2.5/5.0
- Condition / age +2.5/5.0
- Appreciation +0.0/10.0
$127,000
🖨 Deal sheet 📄 Offer letter ✓ Due diligence
Listing remarks
Welcome to 1525 Duke Drive in Livingston’s desirable Monte Cristo 55+ community! This spacious 2-bedroom with possible 3rd bedroom, 2-bath manufactured home offers approximately 1,596 square feet of comfortable and well-designed living space. Inside, you’ll find a bright open layout featuring a generous living area, formal dining space with abundant natural light, and a versatile den that can easily function as a third bedroom, home office, or hobby room. The kitchen offers ample cabinetry, plenty of counter space, perfect for everyday living. Has 2 large bedrooms and bathrooms. Has indoor laundry room with sink. Outside, enjoy covered parking, additional storage space, beautifu
Key facts
- Covered parking
- Clubhouse
- Community amenities
Tags
Property features AI
Finance
- Other: Living area source reported as other; Property has one total story; Latitude 37.376178, Longitude -120.732407
- HOA & community: Part of an association; Senior community; Street lighting in neighborhood
Exterior
- Parking: Located in Monte Cristo park
- Utilities: Public sewer; District/public water
- Home design: Single-story mobile home; Mobile is approximately 13 ft. wide by 60 ft. long; Entry at front of home
- Construction: Mobile home remains on site; Year built reported from other source
- Exterior features: Community pool; Front yard
Interior
- Bathrooms: 2 full bathrooms
- Interior features: Front entry
- Laundry & utility: No laundry hook-ups on site
Neighborhood map
What this means for you Summary
Snapshot
- This is a 2-bed/2.0-bath manufactured listed at $127k.
Deal economics
- At list price, monthly cash flow is $616 ($7k/yr) — positive.
- The deal already cash-flows at list — no discount required.
- Meets the 1% rule at list price ($2k rent vs $127k).
- Recommended offer: $123k (3.0% below list) — sets the bar for market timing.
- Cap rate 12.1% vs local median 3.0% in Livingston — top-decile yield for the area; either an underpriced asset or a hidden risk that comps aren't pricing in. Stress-test before assuming the spread holds.
Location & tenants
- Location reads 66/100 on livability (#359 in CA) — a middle-class / working-renter tenant base. Strengths: housing A+, health & safety A+; Watch: employment C-, schools F, commute F.
- Merced Union High (urban): math 20% / reading 46% proficiency, ranked #301 of 517 in CA (top 58%) — families likely to look elsewhere, expect single-tenant / working-renter base with shorter leases.
- Market conditions: 46 active listings in the ZIP; 459 units permitted in Merced County in 2024 (0 in 5+ unit buildings).
Forward outlook
- Local home prices are declining (-3.0%/yr); year-one equity from $878 of loan paydown is wiped out by about $4k of value loss. Plan a longer hold.
- Merced County population projected at +12% by 2050 — modest demand growth; plan on rents tracking national, not racing it.
- At projected returns (-3.0% appreciation + 3.0% rent growth), your $36k cash investment doubles in ~6 years — after that, you're playing with house money.
Negotiation context
- It's been on market 31 days — a 3% lower offer ($123k) is reasonable based on typical stale-listing flexibility.
Risks & watch-outs
- Climate carrying-cost: major wildfire risk; extreme-heat days projected 8→19/yr by 2055 (HVAC capex compounding) — expect insurance premiums to compound above CPI over the hold.
Questions for the listing agent
- It's been on market 31 days. Have you received any prior offers? Is the seller open to a 3% concession, seller financing, or rate buy-down credit?
- Is there a deadline driving the sale (1031 exchange, divorce, estate, relocation)? That informs how much negotiation room exists.
- Schools are F-rated, which usually means shorter tenancies and higher turnover. Who's the typical renter profile here, and what's been the actual vacancy rate?
- What's the average days-on-market for RENTAL listings here right now (not sales)? A rising rental-DOM trend means longer vacancies and softer asking-rent achievability than the comps imply.
- What's the recent tenant-quality profile in this submarket — average credit score on applications, eviction rate, late-payment / NSF rate, and stable-employment percentage? A property-management company in the area should have these aggregated.
- How much new for-sale + rental construction is in the pipeline within 1–3 miles? Heavy new supply typically softens prices + rents 12–24 months out; constrained supply supports both.
Investment metrics
- 1% rule
- 1.49% ✓
- Cap rate
- 12.12%
- Cash-on-cash
- 20.79%
- DSCR
- 1.93
- GRM
- 5.6
CMA / ARV
- ARV (on-the-fly)
- $151,620
- Comps found
- 7
Show comp detail 7 sales within ~0.75 mi
| Address | Dist | Beds/Ba | Sqft | Sold | Price | $/sf | Match |
|---|---|---|---|---|---|---|---|
| 1557 Monte Cristo Way | 0.03mi | 2/2.0 | 1,596 (0%) | 6mo | $160,000 | $100 | 93 |
| 1565 Queen Way | 0.07mi | 3/2.0 (+1) | 1,736 (+9%) | 6mo | $165,000 | $95 | 72 |
| 1330 Queen Way #27 | 0.13mi | 2/2.0 | 1,782 (+12%) | 7mo | $144,000 | $81 | 69 |
| 1470 Queen Way #17 | 0.10mi | 2/2.0 | 1,782 (+12%) | 11mo | $165,000 | $93 | 67 |
| 1568 Queen Way | 0.09mi | 3/2.0 (+1) | 1,404 (-12%) | 5mo | $137,000 | $98 | 67 |
| 824 Count Dr #1 | 0.06mi | 2/2.0 | 1,793 (+12%) | 14mo | $184,000 | $103 | 65 |
| 825 Knights Ct | 0.16mi | 3/2.0 (+1) | 1,808 (+13%) | 10mo | $170,000 | $94 | 56 |
Match score weights: distance 35% · size 25% · config 20% · recency 20%. Top-matched comps best support the ARV.
Projected returns pro-forma
-3.0% appreciation · 3.0% rent growth · sell at horizon
- IRR
- 13.2%
- Equity multiple
- 1.53×
- Total profit
- $18,697
- Equity at exit
- $18,936
- IRR
- 22.1%
- Equity multiple
- 2.88×
- Total profit
- $66,934
- Equity at exit
- $10,981
Cash invested: $35,560 (down + closing). Projections, not guarantees.
Landlord ↔ Tenant lean methodology
- Overall (STATE)
- 18 Strongly Tenant-Friendly
- State California
- 18 Strongly Tenant-Friendly · D+13
- County
- — inherits STATE
- City
- — inherits STATE
ZIP-level market 95334
- Active inventory
- 46
- Price-to-rent
- 5.6×
Monthly cashflow live
- Estimated rent
- $1,891 medium interval (Pro) →
- Mortgage (P&I)
- −$666
- Tax est. 1.5%
- −$159 /mo · $1,905/yr
- Insurance
- −$53
- HOA
- −$0
- Vacancy / Maint / Mgmt
- −$397
- Net cashflow
- $616
Break-even live
UW: 25.0% down · 7.5% · 30yr · 1.5% tax · 5.0% vac · 8.0% maint · 8.0% mgmt
Financing live
Cash to close
- Down payment
- $31,750
- Closing costs
- $3,810
- Reserves months
- —
- Total cash needed
- —
Loan-product check · same deal, 3 products live
Conventional
25% down · 7.5% · 30yr
- Down + closing
- —
- Monthly P&I
- —
- Monthly cashflow
- —
- DSCR
- —
- Eligible?
- —
Personal DTI + credit; lowest rate.
DSCR
20% down · 8.5% · 30yr
- Down + closing
- —
- Monthly P&I
- —
- Monthly cashflow
- —
- DSCR
- —
- Eligible?
- —
No personal income docs; deal must DSCR.
Hard money
10% down · 12.0% · 12mo
- Down + closing
- —
- Monthly P&I
- —
- Monthly cashflow
- —
- DSCR
- —
- Eligible?
- —
Short-term bridge; refi at stabilization.
Listing history 17 events
-
2026-06-18days on market $127,000 Active 31 DOM
-
2026-06-17days on market $127,000 Active 30 DOM
-
2026-06-16days on market $127,000 Active 29 DOM
-
2026-06-15days on market $127,000 Active 28 DOM
-
2026-06-14days on market $127,000 Active 26 DOM
-
2026-06-13days on market $127,000 Active 25 DOM
-
2026-06-10days on market $127,000 Active 23 DOM
-
2026-06-09days on market $127,000 Active 22 DOM
-
2026-06-08days on market $127,000 Active 21 DOM
-
2026-06-07days on market $127,000 Active 20 DOM
-
2026-06-03days on market $127,000 Active 16 DOM
-
2026-06-02days on market $127,000 Active 15 DOM
-
2026-06-01days on market $127,000 Active 14 DOM
-
2026-05-31days on market $127,000 Active 13 DOM
-
2026-05-30days on market $127,000 Active 12 DOM
-
2026-05-21price $127,000
-
2026-05-18$130,000 Active
ⓘ Source: listings_history table (triggers on properties + properties_extension) + one-shot
backfill from property_details.listing_events for pre-trigger history.
Climate risk First Street
- Flood 1/10 Low FEMA zone X (unshaded) · 0% chance over 30 yrs
- Wildfire 7/10 Severe
- Heat 7/10 Severe 8 d/yr ≥103°F today · 19 d/yr by 30 yrs out
- Wind 1/10 Low
- Air quality 10/10 Extreme 34 unhealthy d/yr today · 35 by 30 yrs out
Nearby sold comps map
Loading sold comps map…
Walkable amenities ~0.75 mi
Loading nearby amenities…
Taxation est. · year 1
- Rental income
- $22,692
- − Mortgage interest
- −$7,114
- − Property taxes
- −$1,905
- − Insurance
- −$635
- − Repairs & maintenance
- −$1,815
- − Management
- −$1,815
- − Depreciation
- −$3,695
- Taxable income
- $5,713
- Est. tax owed @ 24.0%
- −$1,371
- After-tax cash flow
- $6,024/yr
For passive investors: Depreciation is non-cash, so a rental often shows a tax loss while cash-flowing — sheltering income. Rental losses are passive: they offset passive income freely, and up to $25,000/yr can offset ordinary (W-2) income if you actively participate and your MAGI is under $100k (phasing out to $0 by $150k); unused losses carry forward. On sale, claimed depreciation is recaptured at up to 25%, and gains may owe capital-gains tax (a 1031 exchange can defer both). Figures are a year-1 estimate at your 24.0% rate — not tax advice; consult a CPA.
Schools (NCES district)
- District
- Merced Union High
- NCES district ID
- 0624660
- Math proficiency
- 20% ▲ 3.00%
- Reading proficiency
- 46% ▼ -1.00%
- Median HH income
- $44,977
- Composite
- 28.11/100
- National rank
- #6823
- State rank
- #301 of 517 in CA
Livability — Livingston
- Score
- 66/100
- State rank
- #359
- US rank
- #12317
Category grades
Schools grade is shown separately in the Schools card above.
Census & demographics
- Census place
- Livingston, CA
- Population (ZIP)
- 17,198
Population outlook (Merced County) Hauer SSP2
- Today (2025)
- 285,501 people
- By 2030
- 293,437 · +2.8%
- By 2040
- 308,808 · +8.2%
- By 2050
- 321,011 · +12.4%
- By 2075
- 338,497 · +18.6%
- By 2100
- 330,493 · +15.8%
Race, ethnicity, and origin ACS 2023
- Neighborhood character
- Predominantly Hispanic (70%)
- Race & ethnicity
- Hispanic / Latino 70% Asian 18% White 10% Two or more races 9% Native American 1%
- Hispanic origin (detail)
- Mexican 69%
- Common ancestry
- Russian 2% Lithuanian 1%
- Foreign-born
- 38% · Canada
- Languages at home
- 26% English-only · Spanish 57% Other Indo-European 16% Other Asian/Pacific 1%
Political lean MEDSL · Merced
- 2024 margin
- Toss-up / Even · D 46.5% · R 50.9% · Other 2.6%
- 2008→2024 swing
- -12.7pp toward R · 2008: 8.3pp · 2024: -4.4pp
- All cycles
- 2024: R+4.4 2020: D+10.6 2016: D+7.9 2012: D+5.4 2008: D+8.3
Not yet ingested
- Civics
- —
Market trends
- HPI YoY
- ▼ -237.01%
- Current HPI
- 275.9339
- Rent YoY
- —
- Metro
- —
- State GDP YoY
- ▲ 3.21%
- F500 in state
- 116
Industry mix (Fortune 500 HQ in CA)
| Industry | F500 HQs | Revenue |
|---|---|---|
| Technology | 27 | $1,492B |
|
||
| Financial Services | 3 | $174B |
|
||
| Retail | 3 | $44B |
|
||
| Insurance | 3 | $26B |
|
||
| Media / Entertainment | 2 | $115B |
|
||
| Pharmaceuticals / Biotech | 2 | $62B |
|
||
Price history
-2.3% since first listed2 events — show timeline
- 2026-05-21 Price Changed $127,000 CRMLS
- 2026-05-18 Listed $130,000 CRMLS
Cash-flow waterfall
monthlySold comps — $/sqft
last 12 mo · ≤1 miLoading sold comps…