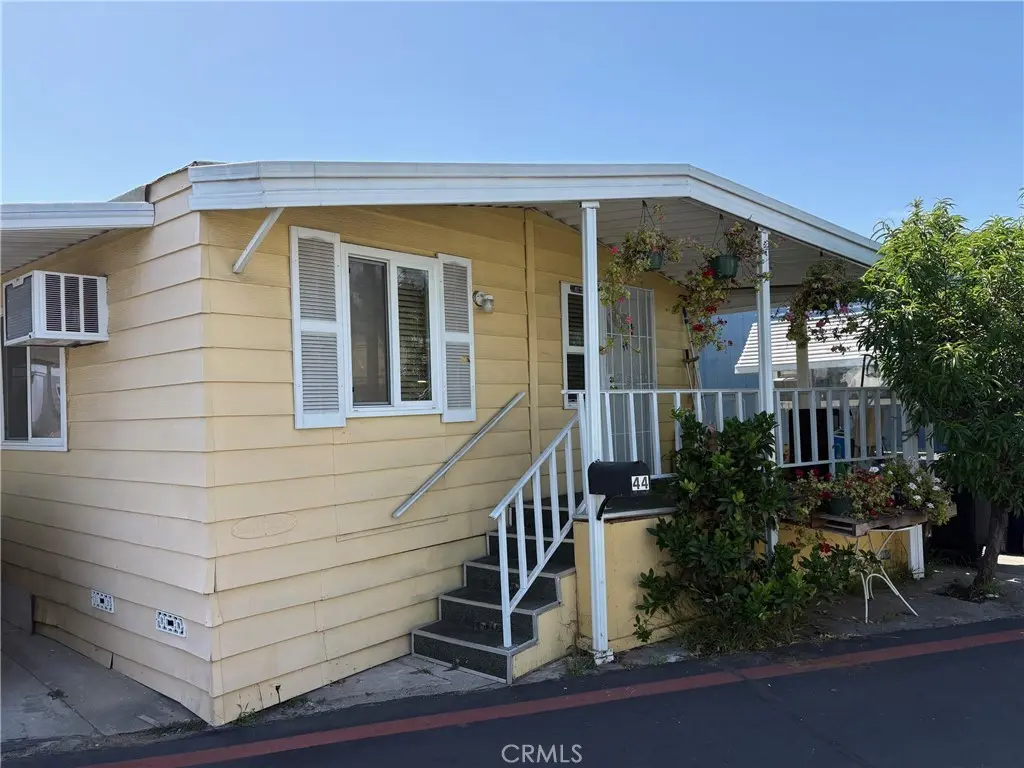
1850 W Orangethorpe Ave #44 · Fullerton, CA
Flood risk 1/10 · Minimal
- FEMA flood zone
- X (shaded)
- Chance of flooding over 30 yrs
- 0.0%
- Est. flood insurance / yr
- $507 – $1,088
Fire risk 1/10 · Minimal
- Est. fire insurance / yr
- $659 – $1,223
Heat risk 5/10 · Moderate
- Hot days now (above 92°F)
- 7 days/yr
- Hot days in 30 yrs
- 22 days/yr
Wind risk 1/10 · Minimal
- Chance of severe wind over 30 yrs
- —
Air-quality risk 5/10 · Moderate
- Unhealthy air days now
- 9 days/yr
- Unhealthy air days in 30 yrs
- 10 days/yr
Risk factors via First Street. Map © Google.
Why this score? — see what drove the B grade
The composite is a weighted blend of 9 inputs, each scored 0–100. Each bar is that input's sub-score; the figure is the points it added to the 100-point composite (weight × sub-score).
- Cash flow +30.0/30.0
- 1% rule +10.0/10.0
- DSCR +10.0/10.0
- ARV discount +7.5/15.0
- Schools +5.1/10.0
- Livability +3.4/5.0
- Rent growth +2.9/5.0
- Condition / age +2.5/5.0
- Appreciation +0.0/10.0
$125,000
🖨 Deal sheet (PDF) 📄 Offer letter ✓ Due diligence
Listing remarks
Welcome to 1850 W Orangethorpe Ave #44, Fullerton — an excellent opportunity to own an affordable home in the heart of Orange County. Located in a desirable all-age community, this 2-bedroom, 2-bathroom home offers comfortable living, functional space, and unbeatable convenience for commuters, first-time buyers, and anyone looking for a lower-maintenance lifestyle. Inside, you’ll find a bright and practical floor plan with spacious living and dining areas, a well-designed kitchen, and a private primary suite with its own bathroom. The layout is ideal for everyday living, offering both comfort and flexibility at an attainable price point. Enjoy covered parking, community amenitie
Key facts
- Community amenities
- Community pool
- Built 1980
Tags
Property features AI
Finance
- Other: Directions: From Brookhurst to Orangethorpe
- Financial info: Land lease in park (monthly); Land lease reported at $1,970 per month; Rent includes gas, electric, water, sewer, trash, and pool
- HOA & community: Community features include street lighting; Park name: Country Place Homes; Manager approval required
Exterior
- Parking: Covered parking; Carport; Property has parking
- Utilities: Public sewer; District/public water
- Home design: Mobile home remains on site (20' x 40'); Single-story; Entry at front gate
- Construction: Mobile home (20 by 40); Seller-provided year built and living area information
- Exterior features: Front porch; Community pool; No landscaping
Interior
- Kitchen: Garbage disposal
- Bedrooms: Primary bedroom on the main floor
- Bathrooms: Two full bathrooms; Main floor full bath
- Heating & cooling: Central furnace heating; Wall/window cooling units
- Interior features: One-level home; Front gate entry; All bedrooms on the lower/main floor; Main floor primary bedroom; Main floor bedroom; Living room; Exhaust fan(s) in bathrooms; Bathtub
- Laundry & utility: Community laundry
Neighborhood map
What this means for you Summary
Snapshot
- This is a 2-bed/2.0-bath manufactured listed at $125k.
Deal economics
- At list price, monthly cash flow is $1k ($14k/yr) — positive.
- The deal already cash-flows at list — no discount required.
- Meets the 1% rule at list price ($3k rent vs $125k).
- Recommended offer: $121k (3.0% below list) — sets the bar for market timing.
- Cap rate 17.5% vs local median 2.0% in Fullerton — top-decile yield for the area; either an underpriced asset or a hidden risk that comps aren't pricing in. Stress-test before assuming the spread holds.
Location & tenants
- Location reads 67/100 on livability (#328 in CA) — a middle-class / working-renter tenant base. Strengths: commute A+, employment A+; Watch: schools C-, health & safety D, crime D-.
- Fullerton Joint Union High (suburban): math 51% / reading 66% proficiency, ranked #82 of 517 in CA (top 16%) — acceptable for families but not a draw, mixed tenant base, ~2y average lease.
- Market conditions: Rents rising (+1.7%/yr); 62 active listings in the ZIP; 40 comparable units currently listed for rent nearby; rentals leasing fast (median 2d on market — plan ~1-2 weeks tenant-placement turnaround); high-income renter base; 6,974 units permitted in Orange County in 2024 (3,839 in 5+ unit buildings).
Forward outlook
- Local home prices are declining (-3.0%/yr); year-one equity from $864 of loan paydown is wiped out by about $4k of value loss. Plan a longer hold.
- Orange County population projected at +14% by 2050 — modest demand growth; plan on rents tracking national, not racing it.
- At projected returns (-3.0% appreciation + 1.7% rent growth), your $35k cash investment doubles in ~4 years — after that, you're playing with house money.
Negotiation context
- It's been on market 57 days — a 3% lower offer ($121k) is reasonable based on typical stale-listing flexibility.
- 4 sale attempts since 10y ago; this cycle's ask has dropped $10k (7%) from the opening price — seller is motivated, your offer sets the floor, not the list.
- Current owner paid $40k; list at $125k implies a 212% gain — meaningful room to come down on a strong offer.
Risks & watch-outs
- Climate carrying-cost: extreme-heat days projected 7→22/yr by 2055 (HVAC capex compounding) — expect insurance premiums to compound above CPI over the hold.
Questions for the listing agent
- It's been on market 57 days. Have you received any prior offers? Is the seller open to a 3% concession, seller financing, or rate buy-down credit?
- Is there a deadline driving the sale (1031 exchange, divorce, estate, relocation)? That informs how much negotiation room exists.
- Crime grade is D in this area — have there been break-ins, vandalism, or insurance claims at this property in the last 3 years? What carrier currently insures it and at what premium?
- What's the average days-on-market for RENTAL listings here right now (not sales)? A rising rental-DOM trend means longer vacancies and softer asking-rent achievability than the comps imply.
- What's the recent tenant-quality profile in this submarket — average credit score on applications, eviction rate, late-payment / NSF rate, and stable-employment percentage? A property-management company in the area should have these aggregated.
- How much new for-sale + rental construction is in the pipeline within 1–3 miles? Heavy new supply typically softens prices + rents 12–24 months out; constrained supply supports both.
Investment metrics
- 1% rule
- 2.06% ✓
- Cap rate
- 17.49%
- Cash-on-cash
- 40.00%
- DSCR
- 2.78
- GRM
- 4.1
CMA / ARV
No comps found within radius.
Projected returns pro-forma
-3.0% appreciation · 1.72% rent growth · sell at horizon
- IRR
- 34.9%
- Equity multiple
- 2.45×
- Total profit
- $50,826
- Equity at exit
- $18,638
- IRR
- 41.1%
- Equity multiple
- 4.63×
- Total profit
- $127,032
- Equity at exit
- $10,808
Cash invested: $35,000 (down + closing). Projections, not guarantees.
Landlord ↔ Tenant lean methodology
- Overall (STATE)
- 18 Strongly Tenant-Friendly
- State California
- 18 Strongly Tenant-Friendly · D+13
- County
- — inherits STATE
- City
- — inherits STATE
ZIP-level market 92833
- Rents YoY
- 1.7%
- Active inventory
- 62
- Price-to-rent
- 4.1×
Monthly cashflow live
- Estimated rent
- $2,570 high interval (Pro) →
- Mortgage (P&I)
- −$656
- Tax est. 1.5%
- −$156 /mo · $1,875/yr
- Insurance
- −$52
- HOA
- −$0
- Vacancy / Maint / Mgmt
- −$540
- Net cashflow
- $1,167
Break-even live
Sensitivity live
| Price | -10% $1,253 | -5% $1,210 | +0% $1,167 | +5% $1,124 | +10% $1,080 |
|---|---|---|---|---|---|
| Rent | -10% $964 | -5% $1,065 | +0% $1,167 | +5% $1,268 | +10% $1,370 |
| Rate | -1.0pp $1,230 | -0.5pp $1,199 | base $1,167 | +0.5pp $1,134 | +1.0pp $1,101 |
UW: 25.0% down · 7.5% · 30yr · 1.5% tax · 5.0% vac · 8.0% maint · 8.0% mgmt
Financing live
Cash to close
- Down payment
- $31,250
- Closing costs
- $3,750
- Reserves months
- —
- Total cash needed
- —
Loan-product check · same deal, 3 products live
Conventional
25% down · 7.5% · 30yr
- Down + closing
- —
- Monthly P&I
- —
- Monthly cashflow
- —
- DSCR
- —
- Eligible?
- —
Personal DTI + credit; lowest rate.
DSCR
20% down · 8.5% · 30yr
- Down + closing
- —
- Monthly P&I
- —
- Monthly cashflow
- —
- DSCR
- —
- Eligible?
- —
No personal income docs; deal must DSCR.
Hard money
10% down · 12.0% · 12mo
- Down + closing
- —
- Monthly P&I
- —
- Monthly cashflow
- —
- DSCR
- —
- Eligible?
- —
Short-term bridge; refi at stabilization.
Rent comps 40 comps
| Address | Beds | Baths | Sqft | Rent | $/sqft | DOM | Units | Dist |
|---|---|---|---|---|---|---|---|---|
| 1601 W Orangethorpe Ave Fullerton, CA | 1.0–2.0 | 1.0 | 887 | $2,080 | $2.34 | 0d | 1 | 0.33mi |
| 1113 S Pine Dr Fullerton, CA | 3.0 | 1.5 | 1069 | $3,900 | $3.65 | 7d | 1 | 0.40mi |
| 1835 West Ave Unit 9 Fullerton, CA | 2.0 | 2.0 | 750 | $2,495 | $3.33 | 0d | 1 | 0.52mi |
| 1422 Peckham St Unit A Fullerton, CA | 2.0 | 1.0 | 925 | $2,500 | $2.70 | 14d | 1 | 0.54mi |
| 1421 Peckham St #1 Fullerton, CA | 2.0 | 2.0 | 950 | $2,650 | $2.79 | 23d | 1 | 0.58mi |
| 1120 Nicklett Ave Fullerton, CA | 1.0 | 1.0 | 800 | $2,100 | $2.62 | 3d | 1 | 0.62mi |
| 230 S Brookhurst Rd Unit 1 Fullerton, CA | 1.0 | 1.0 | 550 | $2,150 | $3.91 | 25d | 1 | 0.65mi |
| 2313 W Valencia Dr Unit 2309 02 Fullerton, CA | 1.0 | 1.0 | 600 | $2,100 | $3.50 | 11d | 1 | 0.76mi |
| 130 maple Ln big bear city, CA | 2.0 | 1.0 | 890 | $1,850 | $2.08 | 3d | 1 | 0.85mi |
| 211 N Florence Pl Unit A Fullerton, CA | 1.0 | 1.0 | 764 | $2,800 | $3.66 | 0d | 1 | 1.00mi |
| 2520 W La Palma Ave Unit 303 Anaheim, CA | 1.0 | 1.0 | 700 | $2,145 | $3.06 | 0d | 1 | 1.06mi |
| 3821 Franklin Ave Unit 19 Fullerton, CA | 1.0 | 1.0 | 664 | $2,000 | $3.01 | 0d | 1 | 1.10mi |
| 2560 W La Palma Ave Anaheim, CA | 2.0 | 1.0–2.0 | 775 | $2,500 | $3.23 | 0d | 5 | 1.10mi |
| 1156 W Valencia Dr Unit 1156-08-upstairs Fullerton, CA | 2.0 | 1.0 | 918 | $2,250 | $2.45 | 0d | 1 | 1.11mi |
| 3841 Franklin Ave Fullerton, CA | 1.0 | 1.0 | 664 | $2,050 | $3.09 | 0d | 2 | 1.12mi |
| 3841 Franklin Ave Apt 19 Fullerton, CA | 1.0 | 1.0 | 664 | $2,000 | $3.01 | 0d | 1 | 1.12mi |
| 2560 W La Palma Ave Unit 207 Anaheim, CA | 1.0 | 1.0 | 799 | $2,150 | $2.69 | 18d | 1 | 1.12mi |
| 2560 W La Palma Ave Unit 128 Anaheim, CA | 1.0 | 1.0 | 799 | $2,100 | $2.63 | 2d | 1 | 1.12mi |
| 3820 W Valencia Dr Fullerton, CA | 3.0 | 1.0 | 930 | $2,895 | $3.11 | 12d | 1 | 1.14mi |
| 1101 West Ave Unit C Fullerton, CA | 1.0 | 1.0 | 600 | $1,695 | $2.83 | 16d | 1 | 1.14mi |
| 413 Adlena Dr Fullerton, CA | 3.0 | 1.0 | 901 | $3,400 | $3.77 | 0d | 1 | 1.15mi |
| 1750 W Romneya Dr Anaheim, CA | 2.0 | 1.0–2.0 | 830 | $2,700 | $3.25 | 0d | 1 | 1.15mi |
| 2337 W Gramercy Ave Unit 1 Anaheim, CA | 2.0 | 2.0 | 957 | $2,800 | $2.93 | 11d | 1 | 1.16mi |
| 2337 W Gramercy Ave Unit 3 Anaheim, CA | 2.0 | 2.0 | 957 | $2,995 | $3.13 | 2d | 1 | 1.16mi |
| 702 N Gilbert St Anaheim, CA | 2.0 | 1.0 | 920 | $2,200 | $2.39 | 2d | 1 | 1.21mi |
| 1020 N Magnolia Ave Anaheim, CA | 1.0 | 1.0 | 700 | $1,995 | $2.85 | 0d | 1 | 1.21mi |
| 1020 N Magnolia Ave Anaheim, CA | 2.0 | 1.0 | 980 | $2,491 | $2.54 | 4d | 1 | 1.21mi |
| 1304 W Commonwealth Ave Fullerton, CA | 2.0 | 1.5 | 900 | $2,500 | $2.78 | 0d | 1 | 1.22mi |
| 630 Bridgeport Cir #8 Fullerton, CA | 2.0 | 1.0 | 704 | $2,475 | $3.52 | 0d | 1 | 1.24mi |
| 8640 Auto Center Dr Buena Park, CA | 2.0 | 1.0–1.5 | 1058 | $2,500 | $2.36 | 0d | 2 | 1.25mi |
| 229 Turner Ave Fullerton, CA | 2.0 | 1.0 | 911 | $2,500 | $2.74 | 0d | 1 | 1.25mi |
| 2341 W Crescent Ave Anaheim, CA | 1.0 | 1.0 | 750 | $2,095 | $2.79 | 2d | 1 | 1.25mi |
| 1237 N Dresden Pl Anaheim, CA | 1.0 | 1.0 | 586 | $1,950 | $3.33 | 0d | 1 | 1.26mi |
| 1237 N Dresden Pl Unit 1243-11 Anaheim, CA | 1.0 | 1.0 | 586 | $1,925 | $3.28 | 7d | 1 | 1.26mi |
| 1231 N Dresden Pl Unit 1231-11 Anaheim, CA | 1.0 | 1.0 | 586 | $1,900 | $3.24 | 0d | 1 | 1.26mi |
| 1231 N Dresden Pl Anaheim, CA | 1.0 | 1.0 | 586 | $1,900 | $3.24 | 0d | 1 | 1.26mi |
| 1231 N Dresden Pl Unit 1225-12 Anaheim, CA | 1.0 | 1.0 | 649 | $1,950 | $3.00 | 23d | 1 | 1.26mi |
| 1737 W Jacaranda Pl Fullerton, CA | 3.0 | 1.0 | 958 | $3,500 | $3.65 | 0d | 1 | 1.27mi |
| 2631 W Felicidad Cir Unit 626-D Anaheim, CA | 2.0 | 1.0 | 940 | $2,955 | $3.14 | 2d | 1 | 1.29mi |
| 2631 W Felicidad Cir Unit 619-D Anaheim, CA | 2.0 | 1.0 | 940 | $2,895 | $3.08 | 2d | 1 | 1.29mi |
Listing history 27 events
-
2026-06-15days on market $125,000 Active 57 DOM
-
2026-06-13days on market $125,000 Active 55 DOM
-
2026-06-13days on market $125,000 Active 54 DOM
-
2026-06-09days on market $125,000 Active 51 DOM
-
2026-06-08days on market $125,000 Active 50 DOM
-
2026-06-07days on market $125,000 Active 49 DOM
-
2026-06-04days on market $125,000 Active 46 DOM
-
2026-06-03days on market $125,000 Active 45 DOM
-
2026-06-02days on market $125,000 Active 44 DOM
-
2026-06-01pricedays on market $125,000 Active 43 DOM
-
2026-05-31days on market $135,000 Active 42 DOM
-
2026-04-19$135,000 Active
-
2026-04-08historical
-
2026-03-30price $130,000
-
2026-03-17price $83,000
-
2026-02-17price $144,999
-
2025-10-16$154,900 Active
-
2025-10-16historical
-
2025-09-19historical
-
2025-08-21price $139,000
-
2025-08-15price $150,000
-
2025-08-05$165,500 Active
-
2016-10-05soldstatus $40,000 Closed Sale
-
2016-09-30historical Active Under Contract
-
2016-08-19status Pending Sale
-
2016-08-08price $45,000
-
2016-06-04$50,000 Active
ⓘ Source: listings_history table (triggers on properties + properties_extension) + one-shot
backfill from property_details.listing_events for pre-trigger history.
Climate risk First Street
- Flood 1/10 Low FEMA zone X (shaded) · 0% chance over 30 yrs
- Wildfire 1/10 Low
- Heat 5/10 Major 7 d/yr ≥92°F today · 22 d/yr by 30 yrs out
- Wind 1/10 Low
- Air quality 5/10 Major 9 unhealthy d/yr today · 10 by 30 yrs out
Nearby sold comps map
Loading sold comps map…
Walkable amenities ~0.75 mi
Loading nearby amenities…
Taxation est. · year 1
- Rental income
- $30,845
- − Mortgage interest
- −$7,002
- − Property taxes
- −$1,875
- − Insurance
- −$625
- − Repairs & maintenance
- −$2,468
- − Management
- −$2,468
- − Depreciation
- −$3,636
- Taxable income
- $12,771
- Est. tax owed @ 24.0%
- −$3,065
- After-tax cash flow
- $10,936/yr
For passive investors: Depreciation is non-cash, so a rental often shows a tax loss while cash-flowing — sheltering income. Rental losses are passive: they offset passive income freely, and up to $25,000/yr can offset ordinary (W-2) income if you actively participate and your MAGI is under $100k (phasing out to $0 by $150k); unused losses carry forward. On sale, claimed depreciation is recaptured at up to 25%, and gains may owe capital-gains tax (a 1031 exchange can defer both). Figures are a year-1 estimate at your 24.0% rate — not tax advice; consult a CPA.
Schools (NCES district)
- District
- Fullerton Joint Union High
- NCES district ID
- 0614760
- Math proficiency
- 51% ▲ 7.00%
- Reading proficiency
- 66% ▲ 1.00%
- Median HH income
- $66,666
- Composite
- 51.37/100
- National rank
- #1735
- State rank
- #82 of 517 in CA
Livability — Fullerton
- Score
- 67/100
- State rank
- #328
- US rank
- #11149
Category grades
Schools grade is shown separately in the Schools card above.
Census & demographics
- Census place
- Fullerton, CA
- County
- Orange County · 3,096,323 people
- City population
- 140,763
- Metro
- Los Angeles-Long Beach-Anaheim, CA
- Population (ZIP)
- 51,842
- Household income
- $114,176
- Rent vs Own
- Severe rent burden
- 2530.0
Population outlook (Orange County) Hauer SSP2
- Today (2025)
- 3,477,456 people
- By 2030
- 3,613,117 · +3.9%
- By 2040
- 3,835,945 · +10.3%
- By 2050
- 3,968,736 · +14.1%
- By 2075
- 4,097,053 · +17.8%
- By 2100
- 3,903,633 · +12.3%
Race, ethnicity, and origin ACS 2023
- Neighborhood character
- Diverse neighborhood (Simpson 0.68)
- Race & ethnicity
- Hispanic / Latino 40% Asian 35% White 20% Two or more races 15% Black 2%
- Hispanic origin (detail)
- Mexican 34%
- Common ancestry
- Italian 1% Slovak 1% Iranian 1%
- Foreign-born
- 36% · South Korea, Canada, China
- Languages at home
- 46% English-only · Spanish 24% Korean 20% Other Indo-European 2%
Political lean MEDSL · Orange
- 2024 margin
- Toss-up / Even · D 49.7% · R 47.1% · Other 3.2%
- 2008→2024 swing
- +5.2pp toward D · 2008: -2.6pp · 2024: 2.6pp
- All cycles
- 2024: D+2.6 2020: D+9.0 2016: D+7.7 2012: R+8.3 2008: R+2.6
Not yet ingested
- Civics
- —
Market trends
- HPI YoY
- ▼ -917.00%
- Current HPI
- 351.652
- Rent YoY
- ▲ 1.72%
- Metro
- Los Angeles-Long Beach-Anaheim, CA
- State GDP YoY
- ▲ 3.21%
- F500 in state
- 116
Industry mix (Fortune 500 HQ in CA)
| Industry | F500 HQs | Revenue |
|---|---|---|
| Technology | 27 | $1,492B |
|
||
| Financial Services | 3 | $174B |
|
||
| Retail | 3 | $44B |
|
||
| Insurance | 3 | $26B |
|
||
| Media / Entertainment | 2 | $115B |
|
||
| Pharmaceuticals / Biotech | 2 | $62B |
|
||
Price history
+170.0% since first listed16 events — show timeline
- 2026-04-19 Listed $135,000 CRMLS
- 2026-04-08 Listing Removed — CRMLS
- 2026-03-30 Price Changed $130,000 CRMLS
- 2026-03-17 Price Changed $83,000 CRMLS
- 2026-02-17 Price Changed $144,999 CRMLS
- 2025-10-16 Listed $154,900 CRMLS
- 2025-10-16 Coming Soon — CRMLS
- 2025-09-19 Listing Removed — CRMLS
- 2025-08-21 Price Changed $139,000 CRMLS
- 2025-08-15 Price Changed $150,000 CRMLS
- 2025-08-05 Listed $165,500 CRMLS
- 2016-10-05 Sold (MLS) $40,000 CRMLS
- 2016-09-30 Contingent — CRMLS
- 2016-08-19 Pending — CRMLS
- 2016-08-08 Price Changed $45,000 CRMLS
- 2016-06-04 Listed $50,000 CRMLS
Cash-flow waterfall
monthlySold comps — $/sqft
last 12 mo · ≤1 miLoading sold comps…