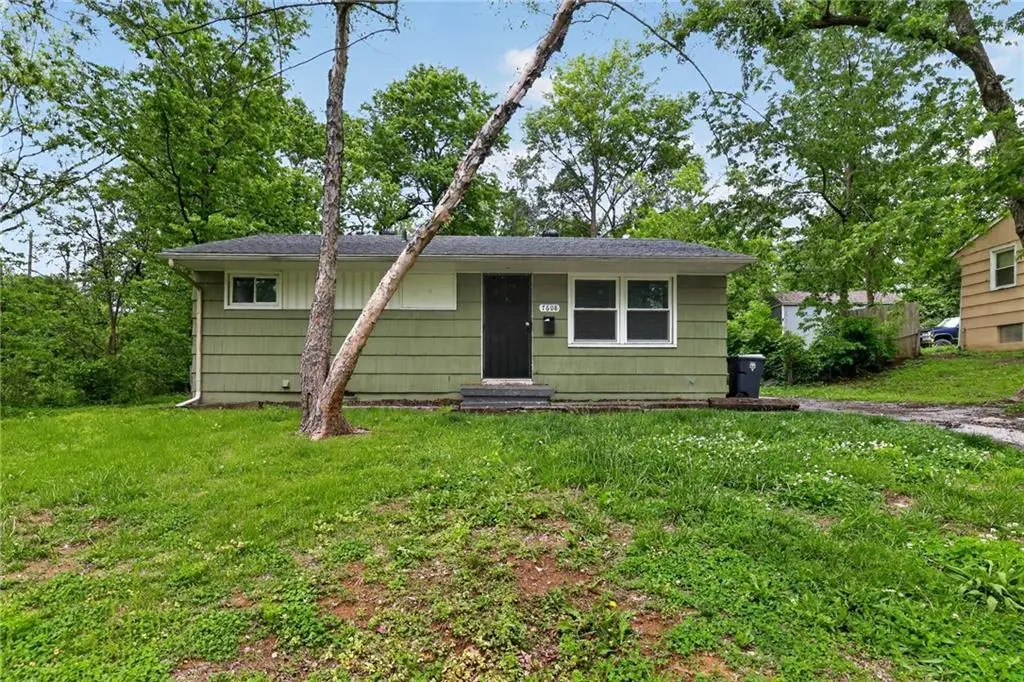
7608 E 48th Ter · Kansas City, MO
Flood risk 1/10 · Minimal
- FEMA flood zone
- X (unshaded)
- Chance of flooding over 30 yrs
- 0.0%
- Est. flood insurance / yr
- $473 – $860
Fire risk 2/10 · Minimal
- Est. fire insurance / yr
- $1,054 – $1,958
Heat risk 4/10 · Minor
- Hot days now (above 107°F)
- 7 days/yr
- Hot days in 30 yrs
- 16 days/yr
Wind risk 2/10 · Minimal
- Chance of severe wind over 30 yrs
- —
Air-quality risk 3/10 · Minor
- Unhealthy air days now
- 3 days/yr
- Unhealthy air days in 30 yrs
- 5 days/yr
Risk factors via First Street. Map © Google.
Why this score? — see what drove the B grade
The composite is a weighted blend of 9 inputs, each scored 0–100. Each bar is that input's sub-score; the figure is the points it added to the 100-point composite (weight × sub-score).
- Cash flow +29.8/30.0
- ARV discount +12.7/15.0
- DSCR +10.0/10.0
- 1% rule +7.4/10.0
- Livability +3.9/5.0
- Rent growth +2.5/5.0
- Condition / age +2.5/5.0
- Schools +1.8/10.0
- Appreciation +0.0/10.0
$114,900
🖨 Deal sheet 📄 Offer letter ✓ Due diligence
Listing remarks
Welcome to this charming 3-bedroom, 1-bathroom ranch-style home in the Eastwood Hills East neighborhood of Kansas City. Perfectly suited for first-time buyers or savvy investors, this 816 sq. ft. residence offers a functional and cozy floor plan. The main level features comfortable living spaces with the potential for original wood flooring underneath. The eat-in kitchen provides a practical area for meal prep and dining. One of the standout features is the screened-in back porch, offering a peaceful spot to enjoy the seasons without the bugs. The property sits on a generous 0.19-acre lot with a large, fenced backyard perfect for pets, gardening, or outdoor entertaining. A full basement pro
Key facts
- Generous lot
- Full basement
- Fenced backyard
Tags
Property features AI
Finance
- Other: Living area reported as 816 (public records); Lot size approx. 0.19 acres (public records); Age reported as 51–75 years
- HOA & community: No association fees
Exterior
- Parking: Other parking
- Utilities: Public water; Public sewer
- Home design: Single-family residence; Ranch floor plan; Residential property
- Construction: Composition roof; Other construction materials
- Exterior features: City lot; Not in a flood plain
Interior
- Kitchen: Refrigerator; Free-standing electric oven
- Bedrooms: Three bedrooms on the main level (approx. 12' x 9'; 10' x 11'; 9' x 11')
- Flooring: Wood floors
- Bathrooms: One full bathroom
- Heating & cooling: Electric heating; Natural gas heating; Electric cooling
- Interior features: Unfinished partial basement; Refrigerator; Free-standing electric oven
Neighborhood map
What this means for you Summary
Snapshot
- This is a 3-bed/1.0-bath single-family listed at $115k.
Deal economics
- At list price, monthly cash flow is $423 ($5k/yr) — positive.
- The deal already cash-flows at list — no discount required.
- Meets the 1% rule at list price ($1k rent vs $115k).
- Recommended offer: $111k (3.0% below list) — sets the bar for market timing.
- Cap rate 10.7% vs local median 3.9% in Kansas City — top-decile yield for the area; either an underpriced asset or a hidden risk that comps aren't pricing in. Stress-test before assuming the spread holds.
Location & tenants
- Location reads 78/100 on livability (#28 in MO, #2,671 nationally) — a middle-class / working-renter tenant base. Strengths: amenities A+, commute A+, cost of living A+; Watch: schools C-, crime F.
- Raytown C-2 (suburban): math 12% / reading 28% proficiency, ranked #302 of 324 in MO (top 93%) — low school quality limits family demand, transient renter base, plan for 1-2y turnover.
- Market conditions: 52 active listings in the ZIP; 7 comparable units currently listed for rent nearby; rentals leasing fast (median 13d on market — plan ~1-2 weeks tenant-placement turnaround); 43% of comp listings sitting > 30 days — soft ceiling on asking rent; 4,002 units permitted in Jackson County in 2024 (2,271 in 5+ unit buildings).
- This rent runs 33% of the median local income ($51k/yr) — at the standard rent-burdened threshold; future hikes will face affordability resistance.
Forward outlook
- Local home prices are declining (-3.0%/yr); year-one equity from $794 of loan paydown is wiped out by about $3k of value loss. Plan a longer hold.
- Jackson County population projected at +4% by 2050 — modest demand growth; plan on rents tracking national, not racing it.
- At projected returns (-3.0% appreciation + 3.0% rent growth), your $32k cash investment doubles in ~8 years — after that, you're playing with house money.
Negotiation context
- It's been on market 48 days — a 3% lower offer ($111k) is reasonable based on typical stale-listing flexibility.
- 2 sale attempts since 15y ago; this cycle's ask has dropped $10k (8%) from the opening price — seller is motivated, your offer sets the floor, not the list.
- Current owner paid $20k; list at $115k implies a 468% gain — meaningful room to come down on a strong offer.
Questions for the listing agent
- It's been on market 48 days. Have you received any prior offers? Is the seller open to a 3% concession, seller financing, or rate buy-down credit?
- Built in 1960 — when were the roof, HVAC, electrical panel, plumbing, and water heater last replaced?
- Is there a deadline driving the sale (1031 exchange, divorce, estate, relocation)? That informs how much negotiation room exists.
- Crime grade is F in this area — have there been break-ins, vandalism, or insurance claims at this property in the last 3 years? What carrier currently insures it and at what premium?
- What's the average days-on-market for RENTAL listings here right now (not sales)? A rising rental-DOM trend means longer vacancies and softer asking-rent achievability than the comps imply.
- What's the recent tenant-quality profile in this submarket — average credit score on applications, eviction rate, late-payment / NSF rate, and stable-employment percentage? A property-management company in the area should have these aggregated.
- How much new for-sale + rental construction is in the pipeline within 1–3 miles? Heavy new supply typically softens prices + rents 12–24 months out; constrained supply supports both.
Investment metrics
- 1% rule
- 1.24% ✓
- Cap rate
- 10.71%
- Cash-on-cash
- 15.76%
- DSCR
- 1.70
- GRM
- 6.7
CMA / ARV
- ARV (median comp)
- $129,983
- List price
- $114,900
- Delta
- -11.60%
- Verdict
- UNDERPRICED
- Comps
- 20 within 1.0 mi
Show comp detail 12 sales within ~0.75 mi
| Address | Dist | Beds/Ba | Sqft | Sold | Price | $/sf | Match |
|---|---|---|---|---|---|---|---|
| 7801 Ozark Rd | 0.18mi | 3/1.0 | 816 (0%) | 8mo | $110,000 | $135 | 85 |
| 7719 E 47th Ter | 0.12mi | 3/1.0 | 840 (+3%) | 9mo | $125,000 | $149 | 82 |
| 7715 E 47th Ter | 0.12mi | 3/1.0 | 840 (+3%) | 11mo | $159,999 | $190 | 81 |
| 7405 E 49th St | 0.22mi | 3/1.0 | 864 (+6%) | 2mo | $82,000 | $95 | 78 |
| 7409 E 49th St | 0.19mi | 3/1.0 | 864 (+6%) | 8mo | $36,000 | $42 | 74 |
| 7610 E 49th Ter | 0.15mi | 2/1.0 (-1) | 864 (+6%) | 5mo | $59,999 | $69 | 74 |
| 5117 Palmer Dr | 0.39mi | 3/1.0 | 816 (0%) | 11mo | $135,000 | $165 | 73 |
| 5130 Palmer St | 0.43mi | 3/1.0 | 864 (+6%) | 1mo | $124,900 | $145 | 69 |
| 7803 E 50th Ter | 0.32mi | 3/1.5 | 864 (+6%) | 6mo | $174,900 | $202 | 68 |
| 4834 Eastern Ave | 0.23mi | 3/1.0 | 912 (+12%) | 4mo | $155,000 | $170 | 67 |
| 5127 Rinker Rd | 0.71mi | 2/1.0 (-1) | 728 (-11%) | 3mo | $149,900 | $206 | 42 |
| 6615 Fairway Dr | 0.64mi | 2/1.0 (-1) | 938 (+15%) | 11mo | $97,000 | $103 | 31 |
Match score weights: distance 35% · size 25% · config 20% · recency 20%. Top-matched comps best support the ARV.
Projected returns pro-forma
-3.0% appreciation · 3.0% rent growth · sell at horizon
- IRR
- 6.6%
- Equity multiple
- 1.26×
- Total profit
- $8,260
- Equity at exit
- $17,132
- IRR
- 15.9%
- Equity multiple
- 2.30×
- Total profit
- $41,712
- Equity at exit
- $9,934
Cash invested: $32,172 (down + closing). Projections, not guarantees.
Landlord ↔ Tenant lean methodology
- Overall (STATE)
- 81 Strongly Landlord-Friendly
- State Missouri
- 81 Strongly Landlord-Friendly · R+10
- County
- — inherits STATE
- City
- — inherits STATE
ZIP-level market 64129
- Home prices YoY
- -9.8%
- Active inventory
- 52
- Price-to-rent
- 6.7×
Monthly cashflow live
- Estimated rent
- $1,428 high interval (Pro) →
- Mortgage (P&I)
- −$603
- Tax from tax record
- −$55 /mo · $661/yr
- Insurance
- −$48
- HOA
- −$0
- Vacancy / Maint / Mgmt
- −$300
- Net cashflow
- $423
Break-even live
UW: 25.0% down · 7.5% · 30yr · 1.5% tax · 5.0% vac · 8.0% maint · 8.0% mgmt
Financing live
Cash to close
- Down payment
- $28,725
- Closing costs
- $3,447
- Reserves months
- —
- Total cash needed
- —
Loan-product check · same deal, 3 products live
Conventional
25% down · 7.5% · 30yr
- Down + closing
- —
- Monthly P&I
- —
- Monthly cashflow
- —
- DSCR
- —
- Eligible?
- —
Personal DTI + credit; lowest rate.
DSCR
20% down · 8.5% · 30yr
- Down + closing
- —
- Monthly P&I
- —
- Monthly cashflow
- —
- DSCR
- —
- Eligible?
- —
No personal income docs; deal must DSCR.
Hard money
10% down · 12.0% · 12mo
- Down + closing
- —
- Monthly P&I
- —
- Monthly cashflow
- —
- DSCR
- —
- Eligible?
- —
Short-term bridge; refi at stabilization.
Rent comps 7 comps
| Address | Beds | Baths | Sqft | Rent | $/sqft | DOM | Units | Dist |
|---|---|---|---|---|---|---|---|---|
| 7611 E 47th Ter Kansas City, MO | 3.0 | 1.0 | 840 | $1,276 | $1.52 | 8d | 1 | 0.07mi |
| 4730 Richmond Ave Kansas City, MO | 3.0 | 1.0 | 821 | $1,395 | $1.70 | 44d | 1 | 0.08mi |
| 7615 E 49th St Kansas City, MO | 2.0 | 1.0 | 888 | $1,095 | $1.23 | 44d | 1 | 0.14mi |
| 7601 Sni a Bar Ter Kansas City, MO | 2.0 | 1.0 | 827 | $1,099 | $1.33 | 44d | 1 | 0.15mi |
| 5126 Booth Ave Kansas City, MO | 2.0 | 1.0 | 950 | $1,149 | $1.21 | 12d | 1 | 0.76mi |
| 5312 Hunter St Raytown, MO | 3.0 | 1.5 | 912 | $1,450 | $1.59 | 2d | 1 | 1.21mi |
| 5312 Hunter St Raytown, MO | 3.0 | 1.5 | 912 | $1,450 | $1.59 | 3d | 1 | 1.21mi |
Listing history 19 events
-
2026-06-18days on market $114,900 Active 48 DOM
-
2026-06-17days on market $114,900 Active 47 DOM
-
2026-06-16days on market $114,900 Active 46 DOM
-
2026-06-15days on market $114,900 Active 45 DOM
-
2026-06-13days on market $114,900 Active 43 DOM
-
2026-06-13pricedays on market $114,900 Active 42 DOM
-
2026-06-09days on market $124,900 Active 39 DOM
-
2026-06-08days on market $124,900 Active 38 DOM
-
2026-06-07days on market $124,900 Active 37 DOM
-
2026-06-03days on market $124,900 Active 33 DOM
-
2026-06-02days on market $124,900 Active 32 DOM
-
2026-06-01days on market $124,900 Active 31 DOM
-
2026-05-31days on market $124,900 Active 30 DOM
-
2026-05-01$124,900 Active 923-char remark
-
2019-12-03soldstatus $20,213
-
2012-08-28soldstatus
-
2012-03-20historical
-
2011-11-01$14,700
-
1992-11-27soldstatus
ⓘ Source: listings_history table (triggers on properties + properties_extension) + one-shot
backfill from property_details.listing_events for pre-trigger history.
Tax reassessment forecast MO · Resets to sale price
- Current annual tax
- $661 · $55/mo
- Projected year-2 tax
- $1,115 · $93/mo
- Expected delta
- +$454/yr (+$38/mo · 68.6%)
ⓘ Screening estimate from a state-policy table — verify with the county assessor before closing.
Climate risk First Street
- Flood 1/10 Low FEMA zone X (unshaded) · 0% chance over 30 yrs
- Wildfire 2/10 Low
- Heat 4/10 Moderate 7 d/yr ≥107°F today · 16 d/yr by 30 yrs out
- Wind 2/10 Low
- Air quality 3/10 Moderate 3 unhealthy d/yr today · 5 by 30 yrs out
Nearby sold comps map
Loading sold comps map…
Walkable amenities ~0.75 mi
Loading nearby amenities…
Taxation est. · year 1
- Rental income
- $17,135
- − Mortgage interest
- −$6,436
- − Property taxes
- −$661
- − Insurance
- −$574
- − Repairs & maintenance
- −$1,371
- − Management
- −$1,371
- − Depreciation
- −$3,343
- Taxable income
- $3,379
- Est. tax owed @ 24.0%
- −$811
- After-tax cash flow
- $4,259/yr
For passive investors: Depreciation is non-cash, so a rental often shows a tax loss while cash-flowing — sheltering income. Rental losses are passive: they offset passive income freely, and up to $25,000/yr can offset ordinary (W-2) income if you actively participate and your MAGI is under $100k (phasing out to $0 by $150k); unused losses carry forward. On sale, claimed depreciation is recaptured at up to 25%, and gains may owe capital-gains tax (a 1031 exchange can defer both). Figures are a year-1 estimate at your 24.0% rate — not tax advice; consult a CPA.
Schools (NCES district)
- District
- Raytown C-2
- NCES district ID
- 2926070
- Math proficiency
- 12% ▼ -11.00%
- Reading proficiency
- 28% ▼ -9.00%
- Median HH income
- $47,215
- Composite
- 17.59/100
- National rank
- #9039
- State rank
- #302 of 324 in MO
Livability — Kansas City
- Score
- 78/100
- State rank
- #28
- US rank
- #2671
Category grades
Schools grade is shown separately in the Schools card above.
Census & demographics
- Census place
- Kansas City, MO
- County
- Jackson County · 687,798 people
- City population
- 439,467
- Metro
- Kansas City, MO-KS
- Population (ZIP)
- 9,267
- Household income
- $51,310
- Rent vs Own
- Severe rent burden
- 349.0
Population outlook (Jackson County) Hauer SSP2
- Today (2025)
- 719,589 people
- By 2030
- 731,456 · +1.6%
- By 2040
- 746,689 · +3.8%
- By 2050
- 749,289 · +4.1%
- By 2075
- 736,227 · +2.3%
- By 2100
- 668,210 · -7.1%
Race, ethnicity, and origin ACS 2023
- Neighborhood character
- Diverse neighborhood (Simpson 0.65)
- Race & ethnicity
- Black 45% White 37% Hispanic / Latino 11% Two or more races 9%
- Hispanic origin (detail)
- Mexican 6%
- Common ancestry
- Lithuanian 4% Italian 2% Armenian 1%
- Foreign-born
- 8% · Canada
- Languages at home
- 87% English-only · Spanish 8% Arabic 1%
Political lean MEDSL · Jackson
- 2024 margin
- D (+19.3) · D 58.9% · R 39.5% · Other 1.6%
- 2008→2024 swing
- -6.1pp toward R · 2008: 25.4pp · 2024: 19.3pp
- All cycles
- 2024: D+19.3 2020: D+22.0 2016: D+16.6 2012: D+19.0 2008: D+25.4
Not yet ingested
- Civics
- —
Market trends
- HPI YoY
- ▼ -32.25%
- Current HPI
- 297.5233
- Rent YoY
- —
- Metro
- Kansas City, MO-KS
- State GDP YoY
- ▲ 1.84%
- F500 in state
- 20
Industry mix (Fortune 500 HQ in MO)
| Industry | F500 HQs | Revenue |
|---|---|---|
| Healthcare | 1 | $163B |
|
||
| Insurance | 1 | $21B |
|
||
| Industrial Technology | 1 | $17B |
|
||
| Retail | 1 | $16B |
|
||
| Industrial Distribution | 1 | $10B |
|
||
| Utilities | 1 | $9B |
|
||
Price history
+681.6% since first listed7 events — show timeline
- 2026-06-11 Price Changed $114,900 Heartland MLS as Distributed by MLS Grid
- 2026-05-01 Listed $124,900 Heartland MLS as Distributed by MLS Grid
- 2019-12-03 Sold (Public Records) $20,213 Public Records
- 2012-08-28 Sold (Public Records) — Public Records
- 2012-03-20 Listing Removed — Heartland MLS as Distributed by MLS Grid
- 2011-11-01 Listed $14,700 Heartland MLS as Distributed by MLS Grid
- 1992-11-27 Sold (Public Records) — Public Records
Property tax history
+7.0%/yrLatest (2025): $661 · -16.7% YoY. Source: county tax records.
Cash-flow waterfall
monthlySold comps — $/sqft
last 12 mo · ≤1 miLoading sold comps…