 Duplex
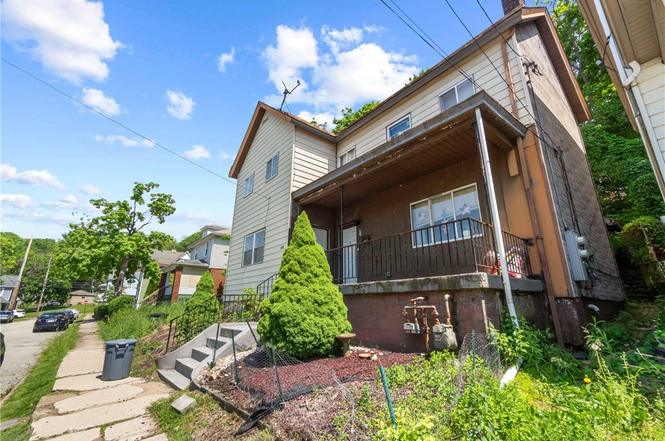
344 Plum St · Carnegie, PA
Flood risk 1/10 · Minimal
- FEMA flood zone
- X (unshaded)
- Chance of flooding over 30 yrs
- 0.0%
- Est. flood insurance / yr
- $473 – $860
Fire risk 1/10 · Minimal
- Est. fire insurance / yr
- $511 – $949
Heat risk 4/10 · Minor
- Hot days now (above 97°F)
- 7 days/yr
- Hot days in 30 yrs
- 18 days/yr
Wind risk 2/10 · Minimal
- Chance of severe wind over 30 yrs
- —
Air-quality risk 2/10 · Minimal
- Unhealthy air days now
- 0 days/yr
- Unhealthy air days in 30 yrs
- 3 days/yr
Risk factors via First Street. Map © Google.
Why this score? — see what drove the B grade
The composite is a weighted blend of 9 inputs, each scored 0–100. Each bar is that input's sub-score; the figure is the points it added to the 100-point composite (weight × sub-score).
- Cash flow +29.7/30.0
- DSCR +10.0/10.0
- 1% rule +9.4/10.0
- ARV discount +7.5/15.0
- Livability +4.3/5.0
- Rent growth +3.9/5.0
- Schools +3.4/10.0
- Condition / age +2.5/5.0
- Appreciation +0.0/10.0
$190,000
🖨 Deal sheet (PDF) 📄 Offer letter ✓ Due diligence
Multi-family units
County records classify this as Multi-Family (2-4 Unit). Listing-text estimate: 2 units. confirmed
Listing remarks MLS
Welcome to this charming turnkey side by side duplex. Both units are occupied. This property is ideal for the investor seeking rental income or live in one unit and rent the other. Unit 1 has an updated kitchen with new appliances, and dishwasher. There is a washer and dryer in the basement and bonus space upstairs with two big bedrooms with wall to wall closets. Unit 2 has new LVT flooring, and fresh paint. This unit also has a new washer and dryer, and dishwasher with two spacious bedrooms. The utilities are split and the tenants pay for gas, electric, and garbage. The landlord pays the water and sewage. Don't miss this investment property in this convenient Carnegie neighborhood! * * * Bring your VA or FHA offers * * *
Key facts
- Covered front porch
- Main-floor laundry
- Conveniently located
Tags
Property features AI
Finance
- Financial info: Annual taxes listed; Assessed value listed
Exterior
- Home design: Multi-unit property (2 total units)
- Exterior features: Zoned multi-family
Interior
- Bedrooms: Two 2-bedroom units
- Bathrooms: Each unit has 1 full bathroom
- Interior features: Unfinished basement
Neighborhood map
What this means for you Summary
Snapshot
- This is a 2 × 2-bed/1.0-bath units multifamily listed at $190k.
Deal economics
- At list price, monthly cash flow is $693 ($8k/yr) — positive. Per door: $347/mo.
- The deal already cash-flows at list — no discount required.
- Meets the 1% rule at list price ($3k rent vs $190k).
- Cap rate 10.7% vs local median 4.5% in Carnegie — top-decile yield for the area; either an underpriced asset or a hidden risk that comps aren't pricing in. Stress-test before assuming the spread holds.
Location & tenants
- Location reads 86/100 on livability (#55 in PA, #344 nationally) — a professional / high-income tenant draw. Strengths: crime A+, commute A+, cost of living A+; Watch: amenities D.
- Carlynton SD (suburban): math 29% / reading 52% proficiency, ranked #352 of 539 in PA (top 65%) — families likely to look elsewhere, expect single-tenant / working-renter base with shorter leases.
- Zoned schools: Carnegie El Sch (math 30% / reading 52%, grade F, #932 of 1,518 statewide, top 62%, 359 students, 100% FRL); Carlynton Jshs (math 23% / reading 42%, grade F, #330 of 437 statewide, top 76%, 595 students, 86% FRL) — zoned schools average 93% FRL vs 42% district-wide (51 pts higher); higher-poverty schools than district average — tighter screening recommended.
- Market conditions: Rents rising fast (+5.5%/yr); 68 active listings in the ZIP; 4 comparable units currently listed for rent nearby; rentals at typical pace (median 26d on market — plan ~3-4 weeks tenant-placement turnaround); solid renter incomes; 2,996 units permitted in Allegheny County in 2024 (1,588 in 5+ unit buildings).
- This rent runs 42% of the median local income ($77k/yr) — at the standard rent-burdened threshold; future hikes will face affordability resistance.
Forward outlook
- Local home prices are declining (-3.0%/yr); year-one equity from $1k of loan paydown is wiped out by about $6k of value loss. Plan a longer hold.
- At projected returns (-3.0% appreciation + 5.5% rent growth), your $53k cash investment doubles in ~7 years — after that, you're playing with house money.
Negotiation context
- Only 11 days on market — expect competitive offers; lowballing is unlikely to land.
- 5 sale attempts since 19y ago with the ask held roughly flat each time — persistent listings suggest the price (not the market) is what's stuck; bring a comps-based counter.
- Current owner paid $125k; list at $190k implies a 52% gain — meaningful room to come down on a strong offer.
Risks & watch-outs
- Watch-outs: built in 1900 — expect roof / HVAC / electrical / plumbing capex.
Questions for the listing agent
- Can we see the unit-by-unit rent roll, current vacancy, and any below-market leases? What's the average tenancy length?
- What capital expenditures (roof, boiler, parking lot, exteriors) have been made in the last 5 years, and what's planned in the next 2?
- Built in 1900 — when were the roof, HVAC, electrical panel, plumbing, and water heater last replaced?
- Is there a deadline driving the sale (1031 exchange, divorce, estate, relocation)? That informs how much negotiation room exists.
- What's the average days-on-market for RENTAL listings here right now (not sales)? A rising rental-DOM trend means longer vacancies and softer asking-rent achievability than the comps imply.
- What's the recent tenant-quality profile in this submarket — average credit score on applications, eviction rate, late-payment / NSF rate, and stable-employment percentage? A property-management company in the area should have these aggregated.
- How much new apartment / multifamily construction is in the pipeline within 1–3 miles? Heavy new supply (>2% of stock underway) typically softens rents 12–24 months out; light construction supports rent growth.
Investment metrics
- 1% rule
- 1.44% ✓
- Cap rate
- 10.67%
- Cash-on-cash
- 15.64%
- DSCR
- 1.70
- GRM
- 5.8
CMA / ARV
No comps found within radius.
Projected returns pro-forma
-3.0% appreciation · 5.45% rent growth · sell at horizon
- IRR
- 9.4%
- Equity multiple
- 1.38×
- Total profit
- $20,406
- Equity at exit
- $28,330
- IRR
- 20.7%
- Equity multiple
- 2.97×
- Total profit
- $104,956
- Equity at exit
- $16,428
Cash invested: $53,200 (down + closing). Projections, not guarantees.
Landlord ↔ Tenant lean methodology
- Overall (STATE)
- 62 Landlord-Friendly
- State Pennsylvania
- 62 Landlord-Friendly · EVEN
- County
- — inherits STATE
- City
- — inherits STATE
ZIP-level market 15106
- Home prices YoY
- -31.9%
- Rents YoY
- 5.5%
- Active inventory
- 68
- Price-to-rent
- 11.6×
Monthly cashflow live
- Estimated rent
- $2,733 high interval (Pro) →
- Mortgage (P&I)
- −$996
- Tax from tax record
- −$390 /mo · $4,683/yr
- Insurance
- −$79
- HOA
- −$0
- Vacancy / Maint / Mgmt
- −$574
- Net cashflow
- $693
Break-even live
Sensitivity live
| Price | -10% $801 | -5% $747 | +0% $693 | +5% $640 | +10% $586 |
|---|---|---|---|---|---|
| Rent | -10% $477 | -5% $585 | +0% $693 | +5% $801 | +10% $909 |
| Rate | -1.0pp $789 | -0.5pp $742 | base $693 | +0.5pp $644 | +1.0pp $594 |
2-unit breakdown (identical units grouped — click to expand)
| Units | Beds | Baths | Est. rent |
|---|---|---|---|
| 2× units | 2 | 1 | $2,734 |
| #1 | 2 | 1 | $1,367 |
| #2 | 2 | 1 | $1,367 |
| Total (2 units) | $2,733 | ||
UW: 25.0% down · 7.5% · 30yr · 1.5% tax · 5.0% vac · 8.0% maint · 8.0% mgmt
Financing live
Cash to close
- Down payment
- $47,500
- Closing costs
- $5,700
- Reserves months
- —
- Total cash needed
- —
Loan-product check · same deal, 3 products live
Conventional
25% down · 7.5% · 30yr
- Down + closing
- —
- Monthly P&I
- —
- Monthly cashflow
- —
- DSCR
- —
- Eligible?
- —
Personal DTI + credit; lowest rate.
DSCR
20% down · 8.5% · 30yr
- Down + closing
- —
- Monthly P&I
- —
- Monthly cashflow
- —
- DSCR
- —
- Eligible?
- —
No personal income docs; deal must DSCR.
Hard money
10% down · 12.0% · 12mo
- Down + closing
- —
- Monthly P&I
- —
- Monthly cashflow
- —
- DSCR
- —
- Eligible?
- —
Short-term bridge; refi at stabilization.
Rent comps 4 comps
| Address | Beds | Baths | Sqft | Rent | $/sqft | DOM | Units | Dist |
|---|---|---|---|---|---|---|---|---|
| 100 Branch St Carnegie, PA | 3.0 | 1.0 | 1606 | $1,590 | $0.99 | 25d | 1 | 0.63mi |
| 525 Carothers Ave Ste 2 Carnegie, PA | 3.0 | 1.0 | 1600 | $1,000 | $0.62 | 25d | 1 | 0.73mi |
| 356 Sunrise Dr Carnegie, PA | 3.0 | 2.5 | 1728 | $2,500 | $1.45 | 25d | 1 | 0.98mi |
| 312 Sunrise Dr Carnegie, PA | 3.0 | 2.5 | 2112 | $3,200 | $1.52 | 0d | 1 | 1.08mi |
Listing history 7 events
-
2026-06-21days on market $190,000 Active 11 DOM
-
2026-06-18days on market $190,000 Active 8 DOM
-
2026-06-17days on market $190,000 Active 7 DOM
-
2026-06-16days on market $190,000 Active 6 DOM
-
2026-06-15days on market $190,000 Active 5 DOM
-
2026-06-13remarks 563-char remark
-
2026-06-13$190,000 Active 3 DOM
ⓘ Source: listings_history table (triggers on properties + properties_extension) + one-shot
backfill from property_details.listing_events for pre-trigger history.
Tax reassessment forecast PA · Partial reset (capped growth)
- Current annual tax
- $4,683 · $390/mo
- Projected year-2 tax
- $4,683 · $390/mo
- Expected delta
- $0/yr ($0/mo · 0.0%)
ⓘ Screening estimate from a state-policy table — verify with the county assessor before closing.
Climate risk First Street
- Flood 1/10 Low FEMA zone X (unshaded) · 0% chance over 30 yrs
- Wildfire 1/10 Low
- Heat 4/10 Moderate 7 d/yr ≥97°F today · 18 d/yr by 30 yrs out
- Wind 2/10 Low
- Air quality 2/10 Low 0 unhealthy d/yr today · 3 by 30 yrs out
Nearby sold comps map
Loading sold comps map…
Walkable amenities ~0.75 mi
Loading nearby amenities…
Taxation est. · year 1
- Rental income
- $32,796
- − Mortgage interest
- −$10,643
- − Property taxes
- −$4,683
- − Insurance
- −$950
- − Repairs & maintenance
- −$2,624
- − Management
- −$2,624
- − Depreciation
- −$5,527
- Taxable income
- $5,746
- Est. tax owed @ 24.0%
- −$1,379
- After-tax cash flow
- $6,941/yr
For passive investors: Depreciation is non-cash, so a rental often shows a tax loss while cash-flowing — sheltering income. Rental losses are passive: they offset passive income freely, and up to $25,000/yr can offset ordinary (W-2) income if you actively participate and your MAGI is under $100k (phasing out to $0 by $150k); unused losses carry forward. On sale, claimed depreciation is recaptured at up to 25%, and gains may owe capital-gains tax (a 1031 exchange can defer both). Figures are a year-1 estimate at your 24.0% rate — not tax advice; consult a CPA.
Schools (NCES district)
- District
- Carlynton SD
- NCES district ID
- 4205040
- Math proficiency
- 29% ▼ -15.00%
- Reading proficiency
- 52% ▼ -11.00%
- Median HH income
- $46,249
- Composite
- 34.46/100
- National rank
- #5192
- State rank
- #352 of 539 in PA
Livability — Carnegie
- Score
- 86/100
- State rank
- #55
- US rank
- #344
Category grades
Schools grade is shown separately in the Schools card above.
Census & demographics
- Census place
- Carnegie, PA
- County
- Allegheny County · 1,022,028 people
- City population
- 19,244
- Metro
- Pittsburgh, PA
- Population (ZIP)
- 19,244
- Household income
- $77,247
- Rent vs Own
- Severe rent burden
- 410.0
Population outlook (Allegheny County) Hauer SSP2
- Today (2025)
- 1,250,282 people
- By 2030
- 1,256,482 · +0.5%
- By 2040
- 1,256,318 · +0.5%
- By 2050
- 1,244,169 · -0.5%
- By 2075
- 1,197,693 · -4.2%
- By 2100
- 1,093,187 · -12.6%
Race, ethnicity, and origin ACS 2023
- Neighborhood character
- Predominantly White (82%)
- Race & ethnicity
- White 82% Black 8% Two or more races 6% Asian 2% Hispanic / Latino 2%
- Common ancestry
- Romanian 11% Lithuanian 2% Subsaharan African 2%
- Foreign-born
- 5%
- Languages at home
- 94% English-only · Other Indo-European 2% Arabic 1% Russian/Polish/Slavic 1%
Political lean MEDSL · Allegheny
- 2024 margin
- Strong D (+20.3) · D 59.7% · R 39.4%
- 2008→2024 swing
- +4.8pp toward D · 2008: 15.5pp · 2024: 20.3pp
- All cycles
- 2024: D+20.3 2020: D+20.4 2016: D+16.4 2012: D+14.4 2008: D+15.5
Not yet ingested
- Civics
- —
Market trends
- HPI YoY
- ▼ -119.52%
- Current HPI
- 255.0295
- Rent YoY
- ▲ 5.45%
- Metro
- Pittsburgh, PA
- State GDP YoY
- ▲ 1.68%
- F500 in state
- 34
Industry mix (Fortune 500 HQ in PA)
| Industry | F500 HQs | Revenue |
|---|---|---|
| Healthcare | 2 | $309B |
|
||
| Insurance | 2 | $27B |
|
||
| Telecommunications / Media | 1 | $124B |
|
||
| Industrial Distribution | 1 | $22B |
|
||
| Financial Services | 1 | $20B |
|
||
| Chemicals / Materials | 1 | $18B |
|
||
Price history
+660.0% since first listed16 events — show timeline
- 2026-06-10 Listed $190,000 West Penn MLS
- 2024-10-18 Price Changed $204,800 West Penn MLS
- 2024-09-19 Price Changed $204,900 West Penn MLS
- 2024-08-06 Price Changed $214,900 West Penn MLS
- 2024-06-18 Price Changed $219,500 West Penn MLS
- 2024-05-08 Listed $224,900 West Penn MLS
- 2024-03-13 Price Changed $224,900 West Penn MLS
- 2024-02-11 Price Changed $229,900 West Penn MLS
- 2024-01-22 Price Changed $239,900 West Penn MLS
- 2024-01-09 Listed $249,900 West Penn MLS
- 2019-11-25 Sold (Public Records) $125,000 Public Records
- 2019-11-22 Sold (MLS) $125,000 West Penn MLS
- 2019-10-09 Contingent — West Penn MLS
- 2019-10-03 Listed $140,000 West Penn MLS
- 2007-04-30 Sold (MLS) $25,000 West Penn MLS
- 2007-02-07 Listed $25,000 West Penn MLS
Property tax history
+15.4%/yrLatest (2026): $4,683 · +1.2% YoY. Source: county tax records.
Cash-flow waterfall
monthlySold comps — $/sqft
last 12 mo · ≤1 miLoading sold comps…