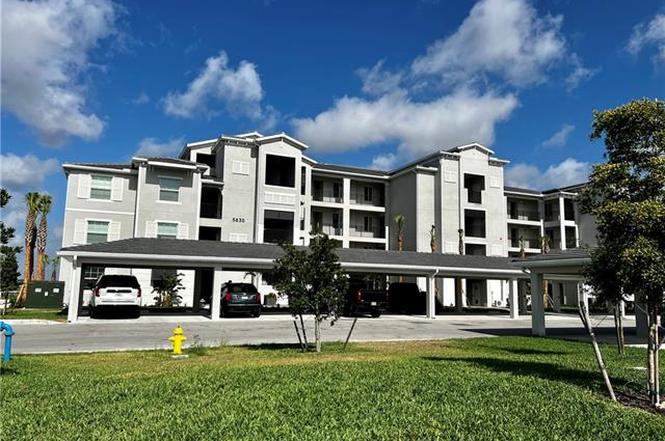
5835 Double Eagle Cir #4718 · Ave Maria, FL
Flood risk 1/10 · Minimal
- FEMA flood zone
- AH
- Chance of flooding over 30 yrs
- 0.0%
- Est. flood insurance / yr
- $1,142 – $2,507
Fire risk 5/10 · Moderate
- Est. fire insurance / yr
- $947 – $1,759
Heat risk 9/10 · Severe
- Hot days now (above 112°F)
- 7 days/yr
- Hot days in 30 yrs
- 27 days/yr
Wind risk 10/10 · Severe
- Chance of severe wind over 30 yrs
- 99.0%
Air-quality risk 2/10 · Minimal
- Unhealthy air days now
- 0 days/yr
- Unhealthy air days in 30 yrs
- 1 days/yr
Risk factors via First Street. Map © Google.
Why this score? — see what drove the B- grade
The composite is a weighted blend of 9 inputs, each scored 0–100. Each bar is that input's sub-score; the figure is the points it added to the 100-point composite (weight × sub-score).
- Cash flow +25.4/30.0
- 1% rule +10.0/10.0
- DSCR +8.4/10.0
- ARV discount +7.5/15.0
- Schools +5.0/10.0
- Appreciation +4.5/10.0
- Rent growth +3.2/5.0
- Livability +2.5/5.0
- Condition / age +2.5/5.0
$269,900
🖨 Deal sheet (PDF) 📄 Offer letter ✓ Due diligence
Listing remarks
* * * GOLF MEMBERSHIP * * * Welcome to 5835 Double Eagle Cir #4718, a 1ST-FLOOR CAROLINA floor plan condo located in the GATED, GUARDED NATIONAL GOLF & COUNTRY CLUB AT AVE MARIA. National Golf & Country Club at Ave Maria. Offering 3 BR/2 BA, and 1,301 SQFT, this residence combines comfort, convenience, and an exceptional setting. The condo is TILED THROUGHOUT, creating a clean, cohesive look that is both attractive and easy to maintain. The kitchen and bathrooms feature QUARTZ COUNTERTOPS, adding a refined touch to the living spaces. The home enjoys a beautiful DOUBLE LAKE VIEW with WESTERN EXPOSURE, allowing you to take in PEACEFUL SUNSETS from the comfort of home. IMPACT
Key facts
- Gated community
- Quartz countertops
- Guarded community
Tags
Property features AI
Finance
- Other: No commercial use and no RV restrictions
- Financial info: Community is golf-bundled
- HOA & community: Mandatory HOA; HOA fee $982 quarterly; Master HOA fee $203 quarterly; Condo fee $1,327.04 quarterly; Mandatory club fee $656.25 quarterly; One-time other fee $2,500; One-time special assessment fee $1,500; Total annual recurring fees approximately $13,422; Total one-time fees approximately $4,500; Professional management; HOA covers cable, golf course, internet/WiFi, irrigation water, lawn/land maintenance, legal/accounting, manager, exterior pest control, reserves, street lights, street maintenance, trash removal and water; Community amenities include golf course, community pool and spa, full service spa, exercise room, tennis, pickleball, bocce, basketball, putting green, bike/jog path, playground, dog park, library, restaurant, shopping, sidewalks and underground utilities
Exterior
- Parking: 1 assigned paved parking space; Detached 1-car carport
- Security: Gated community
- Utilities: Central water; Central sewer; Cable available
- Home design: Residential property; Mid-rise building (4–7 stories); Built in 2023; Rear exposure faces southwest; Great room floor plan with split bedrooms
- Construction: Concrete block construction
- Exterior features: Stucco exterior finish; Tile roof; Impact resistant windows (single hung); Impact resistant doors; Views of golf course, pond, community pool/club, water, and wooded area; Reclaimed water irrigation
Interior
- Kitchen: Electric cooktop; Range; Self-cleaning oven; Microwave; Dishwasher; Disposal; Refrigerator/Freezer; Refrigerator with icemaker
- Bedrooms: 3 bedrooms
- Flooring: Tile floors
- Bathrooms: 2 full bathrooms; Primary bath with shower only
- Heating & cooling: Central electric heat; Central electric air conditioning; Ceiling fans
- Interior features: Fire sprinkler system; High-speed internet available; Smoke detectors; Walk-in closet; Window coverings; Dining area open to living (dining/living) and eat-in kitchen; Guest bath and guest room; Laundry in residence; Screened lanai/porch; Common elevator
- Laundry & utility: Washer and dryer included; Washer/dryer hookup; Auto garage door
Neighborhood map
What this means for you Summary
Snapshot
- This is a 3-bed/2.0-bath condo listed at $270k.
Deal economics
- At list price, monthly cash flow is $465 ($6k/yr) — positive.
- The deal already cash-flows at list — no discount required.
- Meets the 1% rule at list price ($4k rent vs $270k).
- Recommended offer: $238k (12.0% below list) — sets the bar for market timing.
Location & tenants
- Location reads: area grade B — affects rentability + tenant quality, not the cash-flow math above.
- Collier (suburban): math 60% / reading 56% proficiency, ranked #16 of 73 in FL (top 22%) — acceptable for families but not a draw, mixed tenant base, ~2y average lease.
- Zoned schools: Estates Elementary School (math 70% / reading 67%, grade B+, #409 of 2,144 statewide, top 20%, 862 students, 53% FRL); Palmetto Ridge High School (math 43% / reading 51%, grade D-, #207 of 667 statewide, top 32%, 2,347 students, 38% FRL).
- Market conditions: Rents rising (+3.0%/yr); 451 active listings in the ZIP; 40 comparable units currently listed for rent nearby; rentals at typical pace (median 25d on market — plan ~3-4 weeks tenant-placement turnaround); 3,520 units permitted in Collier County in 2024 (959 in 5+ unit buildings).
- At $4,479/mo this rent would consume 86% of the median local household income ($62k/yr) (locally 1093% of renters already pay >50% of income on rent) — very limited rent-growth headroom before tenants either downsize or default.
Forward outlook
- Local home prices are declining (-1.1%/yr); year-one equity from $2k of loan paydown is wiped out by about $3k of value loss. Plan a longer hold.
- Collier County population projected at +30% by 2050 — long-run rental-demand tailwind backs the buy-and-hold thesis.
- At projected returns (-1.1% appreciation + 3.0% rent growth), your $76k cash investment doubles in ~9 years — after that, you're playing with house money.
Negotiation context
- It's been on market 164 days — a 12% lower offer ($238k) is reasonable based on typical stale-listing flexibility.
- 7 sale attempts since 2y ago; this cycle's ask is 11901% above the opening price — seller raised mid-cycle; expect resistance to lowballs.
Risks & watch-outs
- Watch-outs: flood insurance adds $152/mo; HOA is 24% of rent.
- Climate carrying-cost: in FEMA flood zone AH (mandatory federal flood insurance); severe wind risk, 99% chance of damaging wind over 30y; moderate wildfire risk; extreme-heat days projected 7→27/yr by 2055 (HVAC capex compounding) — expect insurance premiums to compound above CPI over the hold.
Questions for the listing agent
- It's been on market 164 days. Have you received any prior offers? Is the seller open to a 12% concession, seller financing, or rate buy-down credit?
- What's the actual annual flood-insurance premium (NFIP or private), and is the property in a SFHA with mandatory coverage?
- What does the HOA fee cover, when was the last increase, and are there any pending special assessments or reserve-fund shortfalls?
- Any open or pending special assessments — roof, HVAC, plumbing, elevator, façade? What's the per-unit balance and payoff schedule, and is the seller paying it off at close or rolling it to the buyer?
- Why hasn't it sold? Are there any deal-killer items the seller is aware of (foundation, flood, title, zoning, code violations)?
- Is there a deadline driving the sale (1031 exchange, divorce, estate, relocation)? That informs how much negotiation room exists.
- What's the average days-on-market for RENTAL listings here right now (not sales)? A rising rental-DOM trend means longer vacancies and softer asking-rent achievability than the comps imply.
- What's the recent tenant-quality profile in this submarket — average credit score on applications, eviction rate, late-payment / NSF rate, and stable-employment percentage? A property-management company in the area should have these aggregated.
- How much new apartment / multifamily construction is in the pipeline within 1–3 miles? Heavy new supply (>2% of stock underway) typically softens rents 12–24 months out; light construction supports rent growth.
Investment metrics
- 1% rule
- 1.66% ✓
- Cap rate
- 9.04%
- Cash-on-cash
- 9.81%
- DSCR
- 1.44
- GRM
- 5.0
CMA / ARV
No comps found within radius.
Projected returns pro-forma
-1.05% appreciation · 2.95% rent growth · sell at horizon
- IRR
- 2.8%
- Equity multiple
- 1.12×
- Total profit
- $9,322
- Equity at exit
- $64,526
- IRR
- 9.5%
- Equity multiple
- 1.93×
- Total profit
- $70,040
- Equity at exit
- $67,227
Cash invested: $75,572 (down + closing). Projections, not guarantees.
Landlord ↔ Tenant lean methodology
- Overall (STATE)
- 87 Strongly Landlord-Friendly
- State Florida
- 87 Strongly Landlord-Friendly · R+3
- County
- — inherits STATE
- City
- — inherits STATE
ZIP-level market 34142
- Home prices YoY
- -0.5%
- Rents YoY
- 3.0%
- Active inventory
- 451
- Price-to-rent
- 5.0×
Monthly cashflow live
- Estimated rent
- $4,479 high interval (Pro) →
- Mortgage (P&I)
- −$1,415
- Tax est. 1.5%
- −$337 /mo · $4,048/yr
- Insurance
- −$112
- Flood insurance flood zone
- −$152 /mo · $1,824/yr
- HOA
- −$1,056
- Vacancy / Maint / Mgmt
- −$941
- Net cashflow
- $465
Break-even live
Sensitivity live
| Price | -10% $652 | -5% $559 | +0% $465 | +5% $372 | +10% $279 |
|---|---|---|---|---|---|
| Rent | -10% $112 | -5% $289 | +0% $465 | +5% $642 | +10% $819 |
| Rate | -1.0pp $601 | -0.5pp $534 | base $465 | +0.5pp $396 | +1.0pp $324 |
UW: 25.0% down · 7.5% · 30yr · 1.5% tax · 5.0% vac · 8.0% maint · 8.0% mgmt
Financing live
Cash to close
- Down payment
- $67,475
- Closing costs
- $8,097
- Reserves months
- —
- Total cash needed
- —
Loan-product check · same deal, 3 products live
Conventional
25% down · 7.5% · 30yr
- Down + closing
- —
- Monthly P&I
- —
- Monthly cashflow
- —
- DSCR
- —
- Eligible?
- —
Personal DTI + credit; lowest rate.
DSCR
20% down · 8.5% · 30yr
- Down + closing
- —
- Monthly P&I
- —
- Monthly cashflow
- —
- DSCR
- —
- Eligible?
- —
No personal income docs; deal must DSCR.
Hard money
10% down · 12.0% · 12mo
- Down + closing
- —
- Monthly P&I
- —
- Monthly cashflow
- —
- DSCR
- —
- Eligible?
- —
Short-term bridge; refi at stabilization.
Rent comps 40 comps
| Address | Beds | Baths | Sqft | Rent | $/sqft | DOM | Units | Dist |
|---|---|---|---|---|---|---|---|---|
| 6039 Ellerston WAY #2017 Ave Maria, FL | 2.0 | 2.0 | 1355 | $6,295 | $4.65 | 24d | 1 | 0.01mi |
| 5704 Melbourne Ct #6712 Ave Maria, FL | 3.0 | 2.0 | 1741 | $7,295 | $4.19 | 24d | 1 | 0.01mi |
| 5629 Double Eagle Cir #4217 Ave Maria, FL | 2.0 | 2.0 | 1154 | $5,795 | $5.02 | 24d | 1 | 0.01mi |
| 5835 Double Eagle CIR #4714 Ave Maria, FL | 2.0 | 2.0 | 1120 | $1,895 | $1.69 | 24d | 1 | 0.01mi |
| 5445 Double Eagle Cir #3011 Ave Maria, FL | 2.0 | 2.0 | 1569 | $2,495 | $1.59 | 24d | 1 | 0.01mi |
| 5651 Double Eagle Cir #4338 Ave Maria, FL | 2.0 | 2.0 | 1301 | $6,295 | $4.84 | 24d | 1 | 0.01mi |
| 5715 Double Eagle Cir #4416 Ave Maria, FL | 2.0 | 2.0 | 1154 | $2,100 | $1.82 | 24d | 1 | 0.01mi |
| 5629 Double Eagle Cir #4218 Ave Maria, FL | 3.0 | 2.0 | 1301 | $6,295 | $4.84 | 24d | 1 | 0.01mi |
| 5629 Double Eagle Cir #4223 Ave Maria, FL | 2.0 | 2.0 | 1154 | $2,395 | $2.08 | 24d | 1 | 0.01mi |
| 5710 Melbourne Ct #6511 Ave Maria, FL | 3.0 | 2.0 | 1741 | $7,295 | $4.19 | 24d | 1 | 0.01mi |
| 5651 Double Eagle Cir #4316 Ave Maria, FL | 2.0 | 2.0 | 1154 | $5,495 | $4.76 | 24d | 1 | 0.01mi |
| 5835 Double Eagle Cir #4726 Ave Maria, FL | 2.0 | 2.0 | 1154 | $2,095 | $1.82 | 15d | 1 | 0.01mi |
| 6036 Ellerston WAY #1311 Ave Maria, FL | 3.0 | 2.0 | 1741 | $4,490 | $2.58 | 24d | 1 | 0.01mi |
| 8010 Helena Ct Ave Maria, FL | 2.0 | 2.0 | 1554 | $2,500 | $1.61 | 22d | 1 | 0.15mi |
| 6082 National Blvd Ave Maria, FL | 2.0 | 2.0 | 1366 | $4,145 | $3.03 | 24d | 2 | 0.17mi |
| 6023 Ellerston Way #1823 Ave Maria, FL | 3.0 | 2.0 | 1695 | $2,995 | $1.77 | 24d | 1 | 0.21mi |
| 5909 Berwick Ln Ave Maria, FL | 2.0 | 2.0 | 1850 | $10,995 | $5.94 | 24d | 1 | 0.24mi |
| 6058 National Blvd #343 Ave Maria, FL | 2.0 | 2.0 | 1194 | $4,000 | $3.35 | 24d | 1 | 0.25mi |
| 6058 National Blvd #335 Ave Maria, FL | 2.0 | 2.0 | 1120 | $5,795 | $5.17 | 15d | 1 | 0.26mi |
| 6058 National Blvd Ave Maria, FL | 2.0–3.0 | 2.0 | 1210 | $5,795 | $4.79 | 24d | 2 | 0.26mi |
| 6046 National Blvd Ave Maria, FL | 2.0 | 2.0 | 1154 | $4,395 | $3.81 | 24d | 2 | 0.29mi |
| 6034 National Blvd Ave Maria, FL | 2.0 | 2.0 | 1137 | $4,046 | $3.56 | 15d | 3 | 0.35mi |
| 5410 Double Eagle Cir #2222 Ave Maria, FL | 2.0 | 2.0 | 1355 | $2,395 | $1.77 | 24d | 1 | 0.38mi |
| 5428 Double Eagle Cir #2517 Ave Maria, FL | 2.0 | 2.0 | 1355 | $2,695 | $1.99 | 24d | 1 | 0.38mi |
| 5835 Double Eagle Cir Unit 4742 Ave Maria, FL | 2.0 | 2.0 | 1154 | $5,795 | $5.02 | 24d | 1 | 0.41mi |
| 5807 Double Eagle Cir #4631 Ave Maria, FL | 3.0 | 2.0 | 1301 | $5,695 | $4.38 | 24d | 1 | 0.41mi |
| 5433 Double Eagle Cir #2915 Ave Maria, FL | 2.0 | 2.0 | 1366 | $6,295 | $4.61 | 22d | 1 | 0.42mi |
| 5433 Double Eagle Cir Ave Maria, FL | 2.0 | 2.0 | 1366 | $3,295 | $2.41 | 24d | 1 | 0.44mi |
| 5427 Double Eagle Cir Ave Maria, FL | 2.0 | 2.0 | 1355 | $2,995 | $2.21 | 24d | 1 | 0.44mi |
| 5427 Double Eagle Cir #2812 Ave Maria, FL | 2.0 | 2.0 | 1355 | $2,395 | $1.77 | 15d | 1 | 0.44mi |
| 5478 Double Eagle Cir #3515 Ave Maria, FL | 2.0 | 2.0 | 1355 | $2,395 | $1.77 | 24d | 1 | 0.48mi |
| 5466 Double Eagle Cir #3425 Ave Maria, FL | 2.0 | 2.0 | 1355 | $5,995 | $4.42 | 24d | 1 | 0.48mi |
| 6205 Harmony Dr Immokalee, FL | 3.0 | 2.0 | 1558 | $5,000 | $3.21 | 24d | 1 | 0.50mi |
| 6189 Harmony Dr Immokalee, FL | 3.0 | 2.0 | 1558 | $6,295 | $4.04 | 24d | 1 | 0.51mi |
| 5943 Sunningdale St Ave Maria, FL | 3.0 | 2.5 | 1850 | $10,995 | $5.94 | 24d | 1 | 0.52mi |
| 6011 Ellerston Way #811 Ave Maria, FL | 3.0 | 2.0 | 1741 | $2,595 | $1.49 | 15d | 1 | 0.53mi |
| 6040 Ellerston Way #1411 Ave Maria, FL | 3.0 | 2.0 | 1741 | $2,695 | $1.55 | 24d | 1 | 0.54mi |
| 5478 Double Eagle Cir #3521 Ave Maria, FL | 2.0 | 2.0 | 1569 | $4,995 | $3.18 | 24d | 1 | 0.54mi |
| 5454 Double Eagle Cir #3325 Ave Maria, FL | 2.0 | 2.0 | 1355 | $2,495 | $1.84 | 24d | 1 | 0.55mi |
| 6168 Harmony Dr Immokalee, FL | 3.0 | 2.0 | 1570 | $5,495 | $3.50 | 15d | 1 | 0.55mi |
HOA detail condo
- Monthly dues
- $1,056 · $12,672/yr
- Likely covers
- security
- Assessments
- None detected in remarks — confirm with the listing agent.
Listing history 33 events
-
2026-06-21days on market $269,900 Active 164 DOM
-
2026-06-18days on market $269,900 Active 161 DOM
-
2026-06-17days on market $269,900 Active 160 DOM
-
2026-06-16days on market $269,900 Active 159 DOM
-
2026-06-15days on market $269,900 Active 158 DOM
-
2026-06-14days on market $269,900 Active 156 DOM
-
2026-06-10days on market $269,900 Active 153 DOM
-
2026-06-09days on market $269,900 Active 152 DOM
-
2026-06-08days on market $269,900 Active 151 DOM
-
2026-06-07days on market $269,900 Active 150 DOM
-
2026-06-03days on market $269,900 Active 146 DOM
-
2026-06-02days on market $269,900 Active 145 DOM
-
2026-06-01days on market $269,900 Active 144 DOM
-
2026-05-31days on market $269,900 Active 143 DOM
-
2026-05-30days on market $269,900 Active 142 DOM
-
2026-04-30price $2,199
-
2026-02-05price $269,900
-
2026-01-29$2,249
-
2026-01-29historical $2,249
-
2026-01-08$274,900 Active
-
2025-12-04price $2,249
-
2025-11-08$2,300
-
2025-07-17historical $2,200
-
2025-06-27$2,200
-
2025-06-26historical $2,200
-
2025-06-19price $2,200
-
2025-04-21$2,400
-
2025-02-25historical $2,400
-
2024-12-09price $2,400
-
2024-11-26$2,500
-
2024-11-26historical $2,500
-
2024-09-09price $2,500
-
2024-06-28$2,600
ⓘ Source: listings_history table (triggers on properties + properties_extension) + one-shot
backfill from property_details.listing_events for pre-trigger history.
Climate risk First Street
- Flood 1/10 Low FEMA zone AH · 0% chance over 30 yrs
- Wildfire 5/10 Major
- Heat 9/10 Extreme 7 d/yr ≥112°F today · 27 d/yr by 30 yrs out
- Wind 10/10 Extreme 99% chance of damaging wind over 30 yrs
- Air quality 2/10 Low 0 unhealthy d/yr today · 1 by 30 yrs out
Nearby sold comps map
Loading sold comps map…
Walkable amenities ~0.75 mi
Loading nearby amenities…
Taxation est. · year 1
- Rental income
- $53,753
- − Mortgage interest
- −$15,119
- − Property taxes
- −$4,048
- − Insurance
- −$3,174
- − Repairs & maintenance
- −$4,300
- − Management
- −$4,300
- − HOA
- −$12,672
- − Depreciation
- −$7,852
- Taxable income
- $2,288
- Est. tax owed @ 24.0%
- −$549
- After-tax cash flow
- $5,037/yr
For passive investors: Depreciation is non-cash, so a rental often shows a tax loss while cash-flowing — sheltering income. Rental losses are passive: they offset passive income freely, and up to $25,000/yr can offset ordinary (W-2) income if you actively participate and your MAGI is under $100k (phasing out to $0 by $150k); unused losses carry forward. On sale, claimed depreciation is recaptured at up to 25%, and gains may owe capital-gains tax (a 1031 exchange can defer both). Figures are a year-1 estimate at your 24.0% rate — not tax advice; consult a CPA.
Schools (NCES district)
- District
- Collier
- NCES district ID
- 1200330
- Math proficiency
- 60% ▼ -4.00%
- Reading proficiency
- 56% ▼ -2.00%
- Median HH income
- $58,275
- Composite
- 50.23/100
- National rank
- #1892
- State rank
- #16 of 73 in FL
Livability — Ave Maria
No livability data for this city. (Only ~50 U.S. cities are tracked.)
Census & demographics
- Census place
- Ave Maria, FL
- County
- Collier County · 396,295 people
- Metro
- Naples-Marco Island, FL
- Population (ZIP)
- 35,149
- Household income
- $62,333
- Rent vs Own
- Severe rent burden
- 1093.0
Population outlook (Collier County) Hauer SSP2
- Today (2025)
- 420,858 people
- By 2030
- 450,054 · +6.9%
- By 2040
- 502,232 · +19.3%
- By 2050
- 544,932 · +29.5%
- By 2075
- 627,203 · +49.0%
- By 2100
- 659,015 · +56.6%
Race, ethnicity, and origin ACS 2023
- Neighborhood character
- Majority Hispanic (63%)
- Race & ethnicity
- Hispanic / Latino 63% Two or more races 39% Black 19% White 16% Native American 7%
- Hispanic origin (detail)
- Mexican 43% Puerto Rican 3% Cuban 2% Dominican 1%
- Common ancestry
- Hispanic 8% Slovak 1% Serbian 1%
- Foreign-born
- 32% · Canada, Jamaica
- Languages at home
- 34% English-only · Spanish 53% French/Haitian/Cajun 12%
Political lean MEDSL · Collier
- 2024 margin
- Solid R (+33.1) · D 33.1% · R 66.2%
- 2008→2024 swing
- -10.6pp toward R · 2008: -22.5pp · 2024: -33.1pp
- All cycles
- 2024: R+33.1 2020: R+24.7 2016: R+26.0 2012: R+30.1 2008: R+22.5
Not yet ingested
- Civics
- —
Market trends
- HPI YoY
- ▼ -1.05%
- Current HPI
- 226.9105
- Rent YoY
- ▲ 2.95%
- Metro
- Naples-Marco Island, FL
- State GDP YoY
- ▲ 3.28%
- F500 in state
- 36
Industry mix (Fortune 500 HQ in FL)
| Industry | F500 HQs | Revenue |
|---|---|---|
| Industrial Technology | 2 | $29B |
|
||
| Insurance | 2 | $17B |
|
||
| Retail | 1 | $60B |
|
||
| Technology Distribution | 1 | $58B |
|
||
| Homebuilding | 1 | $35B |
|
||
| Technology Manufacturing | 1 | $35B |
|
||
Price history
-15.4% since first listed18 events — show timeline
- 2026-04-30 Price Changed $2,199 FGCMLS
- 2026-02-05 Price Changed $269,900 NAPLESMLS
- 2026-01-29 Listed for Rent $2,249 FGCMLS
- 2026-01-29 Rental Removed $2,249 NAPLESMLS
- 2026-01-08 Listed $274,900 NAPLESMLS
- 2025-12-04 Price Changed $2,249 NAPLESMLS
- 2025-11-08 Listed for Rent $2,300 NAPLESMLS
- 2025-07-17 Rental Removed $2,200 NAPLESMLS
- 2025-06-27 Listed for Rent $2,200 NAPLESMLS
- 2025-06-26 Rental Removed $2,200 NAPLESMLS
- 2025-06-19 Price Changed $2,200 NAPLESMLS
- 2025-04-21 Listed for Rent $2,400 NAPLESMLS
- 2025-02-25 Rental Removed $2,400 NAPLESMLS
- 2024-12-09 Price Changed $2,400 NAPLESMLS
- 2024-11-26 Listed for Rent $2,500 NAPLESMLS
- 2024-11-26 Rental Removed $2,500 NAPLESMLS
- 2024-09-09 Price Changed $2,500 NAPLESMLS
- 2024-06-28 Listed for Rent $2,600 NAPLESMLS
Cash-flow waterfall
monthlySold comps — $/sqft
last 12 mo · ≤1 miLoading sold comps…