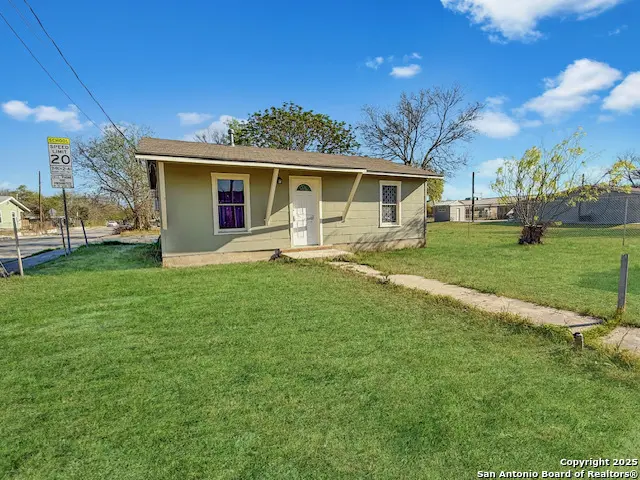
871 W Harlan · San Antonio, TX
Flood risk 1/10 · Minimal
- FEMA flood zone
- X (unshaded)
- Chance of flooding over 30 yrs
- 0.0%
- Est. flood insurance / yr
- $507 – $1,088
Fire risk 1/10 · Minimal
- Est. fire insurance / yr
- $1,222 – $2,270
Heat risk 8/10 · Major
- Hot days now (above 108°F)
- 7 days/yr
- Hot days in 30 yrs
- 22 days/yr
Wind risk 8/10 · Major
- Chance of severe wind over 30 yrs
- 80.0%
Air-quality risk 2/10 · Minimal
- Unhealthy air days now
- 1 days/yr
- Unhealthy air days in 30 yrs
- 2 days/yr
Risk factors via First Street. Map © Google.
Why this score? — see what drove the D grade
The composite is a weighted blend of 9 inputs, each scored 0–100. Each bar is that input's sub-score; the figure is the points it added to the 100-point composite (weight × sub-score).
- Cash flow +12.4/30.0
- ARV discount +7.7/15.0
- Appreciation +4.8/10.0
- 1% rule +4.1/10.0
- Livability +4.0/5.0
- DSCR +3.7/10.0
- Rent growth +2.5/5.0
- Condition / age +2.5/5.0
- Schools +1.9/10.0
$110,000
🖨 Deal sheet (PDF) 📄 Offer letter ✓ Due diligence
Listing remarks MLS
Seller financing available. JUST REMODELED, This 2 bedroom 1 bath home is on a big corner lot and ready for a family!
Key facts
- Big corner lot
- 4,443 sq ft lot
- Built 1943
Tags
Neighborhood map
What this means for you Summary
Snapshot
- This is a 2-bed/1.0-bath single-family listed at $110k.
Deal economics
- At list price, monthly cash flow is $-19 ($-223/yr) — negative.
- To cash-flow at today's rent, offer at most $107k (3.0% below list).
- To meet the 1% rule (rent ≥ 1% of price), the offer needs to be $100k (8.8% below list).
- Recommended offer: $97k (12.0% below list) — sets the bar for market timing.
- Cap rate 6.1% vs local median 3.8% in San Antonio — top-decile yield for the area; either an underpriced asset or a hidden risk that comps aren't pricing in. Stress-test before assuming the spread holds.
Location & tenants
- Location reads 80/100 on livability (#31 in TX, #1,616 nationally) — a professional / high-income tenant draw. Strengths: amenities A+, commute A+, cost of living A+; Watch: crime F.
- Harlandale ISD (urban): math 20% / reading 27% proficiency, ranked #748 of 826 in TX (top 91%) — low school quality limits family demand, transient renter base, plan for 1-2y turnover; 66% free/reduced lunch — lower-income household profile, screen leases tightly.
- Zoned schools: Stonewall/Flanders El (math 17% / reading 17%, grade F, #3,836 of 4,322 statewide, top 91%, 466 students, 97% FRL); A Leal Jr Middle (math 16% / reading 25%, grade F, #1,407 of 1,662 statewide, top 86%, 629 students, 90% FRL); Harlandale H S (math 17% / reading 29%, grade F, #1,348 of 1,632 statewide, top 83%, 1,664 students, 82% FRL) — zoned schools average 89% FRL vs 66% district-wide (24 pts higher); higher-poverty schools than district average — tighter screening recommended.
- Market conditions: 162 active listings in the ZIP; 19 comparable units currently listed for rent nearby; rentals at typical pace (median 24d on market — plan ~3-4 weeks tenant-placement turnaround); 8,308 units permitted in Bexar County in 2024 (2,506 in 5+ unit buildings).
Forward outlook
- In year one you build about $267 of equity ($761 loan paydown + $-494 appreciation (-0.5% local appreciation)).
- Bexar County population projected at +50% by 2050 — long-run rental-demand tailwind backs the buy-and-hold thesis.
Negotiation context
- It's been on market 126 days — a 12% lower offer ($97k) is reasonable based on typical stale-listing flexibility.
- 5 sale attempts since 4y ago; this cycle's ask has dropped $10k (8%) from the opening price — seller is motivated, your offer sets the floor, not the list.
Risks & watch-outs
- Watch-outs: built in 1943 — expect roof / HVAC / electrical / plumbing capex.
- Climate carrying-cost: severe wind risk, 80% chance of damaging wind over 30y; extreme-heat days projected 7→22/yr by 2055 (HVAC capex compounding) — expect insurance premiums to compound above CPI over the hold.
Questions for the listing agent
- What do current leases actually rent for vs. the listed asking? Can we see a recent rent roll and the last 12 months of T-12 income?
- It's been on market 126 days. Have you received any prior offers? Is the seller open to a 12% concession, seller financing, or rate buy-down credit?
- Built in 1943 — when were the roof, HVAC, electrical panel, plumbing, and water heater last replaced?
- Why hasn't it sold? Are there any deal-killer items the seller is aware of (foundation, flood, title, zoning, code violations)?
- Is there a deadline driving the sale (1031 exchange, divorce, estate, relocation)? That informs how much negotiation room exists.
- Crime grade is F in this area — have there been break-ins, vandalism, or insurance claims at this property in the last 3 years? What carrier currently insures it and at what premium?
- The area grade is low — what's the realistic commute time and amenity access for the typical tenant pool here? Any planned neighborhood developments (good or bad) we should know about?
- What's the average days-on-market for RENTAL listings here right now (not sales)? A rising rental-DOM trend means longer vacancies and softer asking-rent achievability than the comps imply.
- What's the recent tenant-quality profile in this submarket — average credit score on applications, eviction rate, late-payment / NSF rate, and stable-employment percentage? A property-management company in the area should have these aggregated.
- How much new for-sale + rental construction is in the pipeline within 1–3 miles? Heavy new supply typically softens prices + rents 12–24 months out; constrained supply supports both.
Investment metrics
- 1% rule
- 0.91% ✗
- Cap rate
- 6.09%
- Cash-on-cash
- -0.72%
- DSCR
- 0.97
- GRM
- 9.1
CMA / ARV
- ARV (median comp)
- $110,503
- List price
- $110,000
- Delta
- -0.45%
- Verdict
- FAIR
- Comps
- 20 within 1.0 mi
Show comp detail 6 sales within ~0.75 mi
| Address | Dist | Beds/Ba | Sqft | Sold | Price | $/sf | Match |
|---|---|---|---|---|---|---|---|
| 871 W Harlan | 0.00mi | 2/1.0 | 600 (0%) | 0mo | $110,000 | $183 | 100 |
| 763 Fitch St | 0.37mi | 2/1.0 | 624 (+4%) | 20mo | $115,000 | $184 | 60 |
| 1254 Chalmers Ave | 0.53mi | 2/1.0 | 638 (+6%) | 19mo | $75,000 | $118 | 49 |
| 1243 W Harlan Ave | 0.51mi | 2/1.0 | 672 (+12%) | 17mo | $50,000 | $74 | 42 |
| 1323 Chalmers Ave | 0.61mi | 1/1.0 (-1) | 560 (-7%) | 22mo | $89,900 | $161 | 37 |
| 603 Humboldt | 0.69mi | 1/1.0 (-1) | 528 (-12%) | 10mo | $99,000 | $188 | 35 |
Match score weights: distance 35% · size 25% · config 20% · recency 20%. Top-matched comps best support the ARV.
Projected returns pro-forma
-0.45% appreciation · 3.0% rent growth · sell at horizon
- IRR
- -4.8%
- Equity multiple
- 0.78×
- Total profit
- $-6,654
- Equity at exit
- $29,493
- IRR
- 1.5%
- Equity multiple
- 1.15×
- Total profit
- $4,755
- Equity at exit
- $33,553
Cash invested: $30,800 (down + closing). Projections, not guarantees.
Landlord ↔ Tenant lean methodology
- Overall (STATE)
- 87 Strongly Landlord-Friendly
- State Texas
- 87 Strongly Landlord-Friendly · R+5
- County
- — inherits STATE
- City
- — inherits STATE
ZIP-level market 78211
- Home prices YoY
- -0.2%
- Active inventory
- 162
- Price-to-rent
- 9.1×
Monthly cashflow live
- Estimated rent
- $1,003 high interval (Pro) →
- Mortgage (P&I)
- −$577
- Tax from tax record
- −$188 /mo · $2,257/yr
- Insurance
- −$46
- HOA
- −$0
- Vacancy / Maint / Mgmt
- −$211
- Net cashflow
- $-19
Break-even live
Sensitivity live
| Price | -10% $44 | -5% $13 | +0% $-19 | +5% $-50 | +10% $-81 |
|---|---|---|---|---|---|
| Rent | -10% $-98 | -5% $-58 | +0% $-19 | +5% $21 | +10% $61 |
| Rate | -1.0pp $37 | -0.5pp $9 | base $-19 | +0.5pp $-47 | +1.0pp $-76 |
UW: 25.0% down · 7.5% · 30yr · 1.5% tax · 5.0% vac · 8.0% maint · 8.0% mgmt
Financing live
Cash to close
- Down payment
- $27,500
- Closing costs
- $3,300
- Reserves months
- —
- Total cash needed
- —
Loan-product check · same deal, 3 products live
Conventional
25% down · 7.5% · 30yr
- Down + closing
- —
- Monthly P&I
- —
- Monthly cashflow
- —
- DSCR
- —
- Eligible?
- —
Personal DTI + credit; lowest rate.
DSCR
20% down · 8.5% · 30yr
- Down + closing
- —
- Monthly P&I
- —
- Monthly cashflow
- —
- DSCR
- —
- Eligible?
- —
No personal income docs; deal must DSCR.
Hard money
10% down · 12.0% · 12mo
- Down + closing
- —
- Monthly P&I
- —
- Monthly cashflow
- —
- DSCR
- —
- Eligible?
- —
Short-term bridge; refi at stabilization.
Rent comps 19 comps
| Address | Beds | Baths | Sqft | Rent | $/sqft | DOM | Units | Dist |
|---|---|---|---|---|---|---|---|---|
| 1222 Brighton Ave Unit B San Antonio, TX | 3.0 | 1.0 | 725 | $999 | $1.38 | 19d | 1 | 0.35mi |
| 1222 Brighton Ave Unit B San Antonio, TX | 3.0 | 1.0 | 725 | $999 | $1.38 | 0d | 1 | 0.35mi |
| 834 Division Ave San Antonio, TX | 2.0 | 1.0 | 700 | $1,050 | $1.50 | 26d | 1 | 0.51mi |
| 1202 Division Ave San Antonio, TX | 1.0 | 1.0 | 550 | $1,100 | $2.00 | 26d | 1 | 0.58mi |
| 620 Linden Ave Unit 2 San Antonio, TX | 2.0 | 1.0 | 733 | $1,200 | $1.64 | 45d | 1 | 0.78mi |
| 416 Collingsworth Unit 2 San Antonio, TX | 2.0 | 1.0 | 570 | $1,100 | $1.93 | 45d | 1 | 0.91mi |
| 806 McCauley Blvd San Antonio, TX | 1.0 | 1.0 | 558 | $695 | $1.25 | 0d | 1 | 0.94mi |
| 806 McCauley Blvd San Antonio, TX | 2.0 | 1.0 | 670 | $895 | $1.34 | 45d | 1 | 0.94mi |
| 103 Stanley Ct Unit 1 San Antonio, TX | 1.0 | 1.0 | 450 | $900 | $2.00 | 22d | 1 | 0.98mi |
| 107 Stanley Ct Apt 3 San Antonio, TX | 2.0 | 1.0 | 575 | $950 | $1.65 | 22d | 1 | 0.99mi |
| 107 Stanley Ct Apt 4 San Antonio, TX | 1.0 | 1.0 | 375 | $825 | $2.20 | 6d | 1 | 0.99mi |
| 675 W Pyron Ave San Antonio, TX | 2.0 | 1.0 | 672 | $1,100 | $1.64 | 0d | 1 | 0.99mi |
| 165 Division Ave Unit 2 San Antonio, TX | 1.0 | 1.0 | 617 | $700 | $1.13 | 24d | 1 | 1.15mi |
| 165 Division Ave Unit 2 San Antonio, TX | 1.0 | 1.0 | 617 | $725 | $1.18 | 45d | 1 | 1.15mi |
| 165 Division Ave San Antonio, TX | 1.0 | 1.0 | 617 | $700 | $1.13 | 0d | 1 | 1.15mi |
| 520 Prado St Unit 1 San Antonio, TX | 2.0 | 1.0 | 620 | $799 | $1.29 | 45d | 1 | 1.26mi |
| 321 Verne St San Antonio, TX | 1.0 | 1.0 | 500 | $650 | $1.30 | 26d | 1 | 1.32mi |
| 500 Burton Ave San Antonio, TX | 1.0 | 1.0 | 500 | $800 | $1.60 | 26d | 1 | 1.33mi |
| 2238 Interstate 35 Access Rd Unit 35 San Antonio, TX | 1.0 | 1.0 | 638 | $825 | $1.29 | 0d | 1 | 1.38mi |
Listing history 25 events
-
2026-06-17days on market $110,000 Active 126 DOM
-
2026-06-16days on market $110,000 Active 125 DOM
-
2026-06-15days on market $110,000 Active 124 DOM
-
2026-06-13statusdays on market $110,000 Active 122 DOM
-
2026-06-13days on market $110,000 Back on Market 121 DOM
-
2026-06-09days on market $110,000 Back on Market 118 DOM
-
2026-06-08days on market $110,000 Back on Market 117 DOM
-
2026-06-07days on market $110,000 Back on Market 116 DOM
-
2026-06-04days on market $110,000 Back on Market 113 DOM
-
2026-06-03pricestatusdays on market $110,000 Back on Market 112 DOM
-
2026-04-17price $99,000 118-char remark
Show marketing remark (118 chars)
Seller financing available. JUST REMODELED, This 2 bedroom 1 bath home is on a big corner lot and ready for a family!
-
2026-04-17status Back on Market 118-char remark
Show marketing remark (118 chars)
Seller financing available. JUST REMODELED, This 2 bedroom 1 bath home is on a big corner lot and ready for a family!
-
2026-04-14historical Active Option 118-char remark
Show marketing remark (118 chars)
Seller financing available. JUST REMODELED, This 2 bedroom 1 bath home is on a big corner lot and ready for a family!
-
2026-02-04$119,900 New 118-char remark
Show marketing remark (118 chars)
Seller financing available. JUST REMODELED, This 2 bedroom 1 bath home is on a big corner lot and ready for a family!
-
2026-02-02historical
-
2025-12-21price $124,900
-
2025-11-12$129,900 New
-
2025-04-07historical
-
2025-03-21$135,000 New
-
2022-11-30historical
-
2022-09-06soldstatus
-
2022-09-02soldstatus Sold
-
2022-07-12status Pending
-
2022-07-01historical Active Option
-
2022-06-27$85,000 New
ⓘ Source: listings_history table (triggers on properties + properties_extension) + one-shot
backfill from property_details.listing_events for pre-trigger history.
Tax reassessment forecast TX · Resets to sale price
- Current annual tax
- $2,257 · $188/mo
- Projected year-2 tax
- $2,257 · $188/mo
- Expected delta
- $0/yr ($0/mo · 0.0%)
ⓘ Screening estimate from a state-policy table — verify with the county assessor before closing.
Climate risk First Street
- Flood 1/10 Low FEMA zone X (unshaded) · 0% chance over 30 yrs
- Wildfire 1/10 Low
- Heat 8/10 Severe 7 d/yr ≥108°F today · 22 d/yr by 30 yrs out
- Wind 8/10 Severe 80% chance of damaging wind over 30 yrs
- Air quality 2/10 Low 1 unhealthy d/yr today · 2 by 30 yrs out
Nearby sold comps map
Loading sold comps map…
Walkable amenities ~0.75 mi
Loading nearby amenities…
Taxation est. · year 1
- Rental income
- $12,034
- − Mortgage interest
- −$6,162
- − Property taxes
- −$2,257
- − Insurance
- −$550
- − Repairs & maintenance
- −$963
- − Management
- −$963
- − Depreciation
- −$3,200
- Taxable loss
- −$2,060
- Est. tax savings @ 24.0%
- +$495
- After-tax cash flow
- $272/yr
For passive investors: Depreciation is non-cash, so a rental often shows a tax loss while cash-flowing — sheltering income. Rental losses are passive: they offset passive income freely, and up to $25,000/yr can offset ordinary (W-2) income if you actively participate and your MAGI is under $100k (phasing out to $0 by $150k); unused losses carry forward. On sale, claimed depreciation is recaptured at up to 25%, and gains may owe capital-gains tax (a 1031 exchange can defer both). Figures are a year-1 estimate at your 24.0% rate — not tax advice; consult a CPA.
Schools (NCES district)
- District
- Harlandale ISD
- NCES district ID
- 4822470
- Math proficiency
- 20% ▼ -22.00%
- Reading proficiency
- 27% ▼ -9.00%
- Median HH income
- $33,850
- Composite
- 19.25/100
- National rank
- #8806
- State rank
- #748 of 826 in TX
Livability — San Antonio
- Score
- 80/100
- State rank
- #31
- US rank
- #1616
Category grades
Schools grade is shown separately in the Schools card above.
Census & demographics
- Census place
- San Antonio, TX
- County
- Bexar County · 1,990,555 people
- City population
- 1,806,925
- Metro
- San Antonio-New Braunfels, TX
- Population (ZIP)
- 30,857
- Household income
- $55,436
- Rent vs Own
- Severe rent burden
- 729.0
Population outlook (Bexar County) Hauer SSP2
- Today (2025)
- 2,336,851 people
- By 2030
- 2,560,728 · +9.6%
- By 2040
- 3,020,569 · +29.3%
- By 2050
- 3,493,522 · +49.5%
- By 2075
- 4,668,459 · +99.8%
- By 2100
- 5,533,242 · +136.8%
Race, ethnicity, and origin ACS 2023
- Neighborhood character
- Predominantly Hispanic (93%)
- Race & ethnicity
- Hispanic / Latino 93% Two or more races 30% White 5% Black 1% Native American 1%
- Hispanic origin (detail)
- Mexican 76%
- Foreign-born
- 18% · Canada
- Languages at home
- 35% English-only · Spanish 65%
Political lean MEDSL · Bexar
- 2024 margin
- Lean D (+9.8) · D 54.3% · R 44.6% · Other 1.1%
- 2008→2024 swing
- +4.2pp toward D · 2008: 5.6pp · 2024: 9.8pp
- All cycles
- 2024: D+9.8 2020: D+18.2 2016: D+13.5 2012: D+4.6 2008: D+5.6
Not yet ingested
- Civics
- —
Market trends
- HPI YoY
- ▼ -0.45%
- Current HPI
- 241.1709
- Rent YoY
- —
- Metro
- San Antonio-New Braunfels, TX
- State GDP YoY
- ▲ 3.95%
- F500 in state
- 110
Industry mix (Fortune 500 HQ in TX)
| Industry | F500 HQs | Revenue |
|---|---|---|
| Energy | 16 | $1,198B |
|
||
| Technology | 5 | $198B |
|
||
| Engineering / Construction | 4 | $72B |
|
||
| Energy Services | 3 | $60B |
|
||
| Utilities | 3 | $41B |
|
||
| Healthcare | 2 | $330B |
|
||
Price history
+16.5% since first listed15 events — show timeline
- 2026-04-17 Price Changed $99,000 LERA
- 2026-04-17 Relisted — LERA
- 2026-04-14 Contingent — LERA
- 2026-02-04 Listed $119,900 LERA
- 2026-02-02 Listing Removed — LERA
- 2025-12-21 Price Changed $124,900 LERA
- 2025-11-12 Listed $129,900 LERA
- 2025-04-07 Listing Removed — LERA
- 2025-03-21 Listed $135,000 LERA
- 2022-11-30 Listing Removed — LERA
- 2022-09-06 Sold (Public Records) — Public Records
- 2022-09-02 Sold (MLS) — LERA
- 2022-07-12 Pending — LERA
- 2022-07-01 Contingent — LERA
- 2022-06-27 Listed $85,000 LERA
Property tax history
+7.8%/yrLatest (2025): $2,257 · -4.6% YoY. Source: county tax records.
Cash-flow waterfall
monthlySold comps — $/sqft
last 12 mo · ≤1 miLoading sold comps…