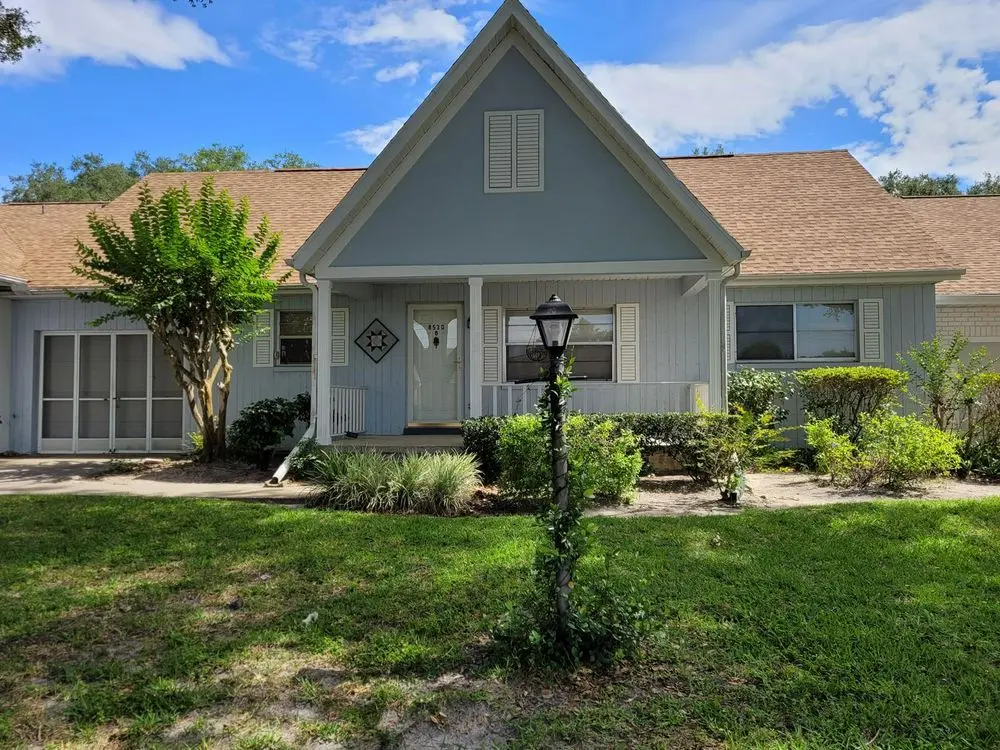
8530 SW 90th St · On Top of the World, FL
Flood risk No data
- FEMA flood zone
- —
- Chance of flooding over 30 yrs
- —
- Est. flood insurance / yr
- —
Fire risk No data
- Est. fire insurance / yr
- —
Heat risk No data
- Hot days now (above threshold)
- —
- Hot days in 30 yrs
- —
Wind risk No data
- Chance of severe wind over 30 yrs
- —
Air-quality risk No data
- Unhealthy air days now
- —
- Unhealthy air days in 30 yrs
- —
Risk factors via First Street. Map © Google.
Why this score? — see what drove the C- grade
The composite is a weighted blend of 9 inputs, each scored 0–100. Each bar is that input's sub-score; the figure is the points it added to the 100-point composite (weight × sub-score).
- Cash flow +20.0/30.0
- ARV discount +8.1/15.0
- DSCR +6.4/10.0
- 1% rule +5.3/10.0
- Condition / age +3.8/5.0
- Schools +3.6/10.0
- Rent growth +2.5/5.0
- Livability +2.5/5.0
- Appreciation +0.0/10.0
$159,999
🖨 Deal sheet 📄 Offer letter ✓ Due diligence
Listing remarks MLS
Excellent community, outdoor pools, golf, fitness centers , restaurants, public transportation, 24 hours gate security , new vinyl flooring, fresh paint, spacious bedrooms, walk in closet etc
Key facts
- Golf
- Fitness centers
- Outdoor pools
Tags
Neighborhood map
What this means for you Summary
Snapshot
- This is a 2-bed/2.0-bath townhouse listed at $160k. Condition is rated good.
Deal economics
- At list price, monthly cash flow is $197 ($2k/yr) — positive.
- The deal already cash-flows at list — no discount required.
- Meets the 1% rule at list price ($2k rent vs $160k).
- Recommended offer: $146k (9.0% below list) — sets the bar for market timing.
- Cap rate 7.8% vs local median 2.9% in On Top of the World — top-decile yield for the area; either an underpriced asset or a hidden risk that comps aren't pricing in. Stress-test before assuming the spread holds.
Location & tenants
- Location reads: area grade C — affects rentability + tenant quality, not the cash-flow math above.
- Marion (rural): math 42% / reading 43% proficiency, ranked #61 of 73 in FL (top 84%) — families likely to look elsewhere, expect single-tenant / working-renter base with shorter leases; 61% free/reduced lunch — lower-income household profile, screen leases tightly.
- Market conditions: 1151 active listings in the ZIP; 32 comparable units currently listed for rent nearby; rentals at typical pace (median 21d on market — plan ~3-4 weeks tenant-placement turnaround); 7,071 units permitted in Marion County in 2024 (534 in 5+ unit buildings).
- This rent runs 35% of the median local income ($57k/yr) — at the standard rent-burdened threshold; future hikes will face affordability resistance.
Forward outlook
- Local home prices are declining (-3.0%/yr); year-one equity from $1k of loan paydown is wiped out by about $5k of value loss. Plan a longer hold.
- Marion County population projected at +13% by 2050 — modest demand growth; plan on rents tracking national, not racing it.
Negotiation context
- It's been on market 117 days — a 9% lower offer ($146k) is reasonable based on typical stale-listing flexibility.
Questions for the listing agent
- It's been on market 117 days. Have you received any prior offers? Is the seller open to a 9% concession, seller financing, or rate buy-down credit?
- Why hasn't it sold? Are there any deal-killer items the seller is aware of (foundation, flood, title, zoning, code violations)?
- Is there a deadline driving the sale (1031 exchange, divorce, estate, relocation)? That informs how much negotiation room exists.
- What's the average days-on-market for RENTAL listings here right now (not sales)? A rising rental-DOM trend means longer vacancies and softer asking-rent achievability than the comps imply.
- What's the recent tenant-quality profile in this submarket — average credit score on applications, eviction rate, late-payment / NSF rate, and stable-employment percentage? A property-management company in the area should have these aggregated.
- How much new for-sale + rental construction is in the pipeline within 1–3 miles? Heavy new supply typically softens prices + rents 12–24 months out; constrained supply supports both.
Investment metrics
- 1% rule
- 1.03% ✓
- Cap rate
- 7.77%
- Cash-on-cash
- 5.29%
- DSCR
- 1.24
- GRM
- 8.1
CMA / ARV
- ARV (median comp)
- $162,171
- List price
- $159,999
- Delta
- -1.34%
- Verdict
- FAIR
- Comps
- 6 within 1.0 mi
Show comp detail 1 sale within ~0.75 mi
| Address | Dist | Beds/Ba | Sqft | Sold | Price | $/sf | Match |
|---|---|---|---|---|---|---|---|
| 8709 SW 96th St Unit A | 0.65mi | 2/2.0 | 1,571 (+15%) | 11mo | $130,000 | $83 | 36 |
Match score weights: distance 35% · size 25% · config 20% · recency 20%. Top-matched comps best support the ARV.
Projected returns pro-forma
-3.0% appreciation · 3.0% rent growth · sell at horizon
- IRR
- -8.1%
- Equity multiple
- 0.70×
- Total profit
- $-13,326
- Equity at exit
- $23,856
- IRR
- 1.5%
- Equity multiple
- 1.10×
- Total profit
- $4,690
- Equity at exit
- $13,834
Cash invested: $44,800 (down + closing). Projections, not guarantees.
Landlord ↔ Tenant lean methodology
- Overall (STATE)
- 87 Strongly Landlord-Friendly
- State Florida
- 87 Strongly Landlord-Friendly · R+3
- County
- — inherits STATE
- City
- — inherits STATE
ZIP-level market 34481
- Home prices YoY
- -25.2%
- Active inventory
- 1151
- Price-to-rent
- 8.1×
Monthly cashflow live
- Estimated rent
- $1,650 high interval (Pro) →
- Mortgage (P&I)
- −$839
- Tax est. 1.5%
- −$200 /mo · $2,400/yr
- Insurance
- −$67
- HOA
- −$0
- Vacancy / Maint / Mgmt
- −$346
- Net cashflow
- $197
Break-even live
UW: 25.0% down · 7.5% · 30yr · 1.5% tax · 5.0% vac · 8.0% maint · 8.0% mgmt
Financing live
Cash to close
- Down payment
- $40,000
- Closing costs
- $4,800
- Reserves months
- —
- Total cash needed
- —
Loan-product check · same deal, 3 products live
Conventional
25% down · 7.5% · 30yr
- Down + closing
- —
- Monthly P&I
- —
- Monthly cashflow
- —
- DSCR
- —
- Eligible?
- —
Personal DTI + credit; lowest rate.
DSCR
20% down · 8.5% · 30yr
- Down + closing
- —
- Monthly P&I
- —
- Monthly cashflow
- —
- DSCR
- —
- Eligible?
- —
No personal income docs; deal must DSCR.
Hard money
10% down · 12.0% · 12mo
- Down + closing
- —
- Monthly P&I
- —
- Monthly cashflow
- —
- DSCR
- —
- Eligible?
- —
Short-term bridge; refi at stabilization.
Rent comps 32 comps
| Address | Beds | Baths | Sqft | Rent | $/sqft | DOM | Units | Dist |
|---|---|---|---|---|---|---|---|---|
| 8430 SW 90th Ln Unit D Ocala, FL | 2.0 | 2.0 | 1454 | $1,600 | $1.10 | 21d | 1 | 0.14mi |
| 8431 SW 90th Ln Ocala, FL | 2.0 | 2.0 | 1366 | $1,395 | $1.02 | 21d | 1 | 0.14mi |
| 8666 SW 92nd Ln Unit F Ocala, FL | 2.0 | 2.0 | 1748 | $2,000 | $1.14 | 21d | 1 | 0.34mi |
| 9257 SW 82nd Ter Unit H Ocala, FL | 2.0 | 2.0 | 1748 | $1,600 | $0.92 | 21d | 1 | 0.37mi |
| 8665 SW 94th St Unit C Ocala, FL | 2.0 | 2.0 | 1589 | $1,600 | $1.01 | 21d | 1 | 0.43mi |
| 8701 SW 83rd Cir Ocala, FL | 3.0 | 2.0 | 1726 | $2,200 | $1.27 | 13d | 1 | 0.49mi |
| 8680 SW 94th Ln Unit G Ocala, FL | 3.0 | 2.0 | 1409 | $1,550 | $1.10 | 21d | 1 | 0.53mi |
| 9013 SW 91st Cir Ocala, FL | 2.0 | 2.0 | 1494 | $1,900 | $1.27 | 13d | 1 | 0.58mi |
| 8714 SW 83rd Loop Ocala, FL | 2.0 | 2.0 | 1658 | $1,900 | $1.15 | 13d | 1 | 0.70mi |
| 8671 SW 97th St Unit C Ocala, FL | 2.0 | 2.0 | 1341 | $1,474 | $1.10 | 13d | 1 | 0.71mi |
| 8670 SW 97th St Unit A Ocala, FL | 2.0 | 2.0 | 1341 | $1,600 | $1.19 | 21d | 1 | 0.74mi |
| 8655 SW 98th Street Rd Unit G Ocala, FL | 2.0 | 2.0 | 1424 | $1,500 | $1.05 | 21d | 1 | 0.78mi |
| 9289 SW 92nd Ln Ocala, FL | 2.0 | 2.0 | 1600 | $1,350 | $0.84 | 21d | 1 | 0.78mi |
| 7754 SW 86th Loop Ocala, FL | 2.0 | 2.0 | 1460 | $1,800 | $1.23 | 21d | 1 | 0.80mi |
| 9513 SW 92nd Place Rd Ocala, FL | 2.0 | 2.0 | 1651 | $2,000 | $1.21 | 13d | 1 | 0.93mi |
| 8757 SW 97th Lane Rd Unit C Ocala, FL | 2.0 | 2.0 | 1490 | $1,600 | $1.07 | 13d | 1 | 0.99mi |
| 7928 SW 80th Place Rd Ocala, FL | 3.0 | 2.0 | 1576 | $1,900 | $1.21 | 21d | 1 | 1.14mi |
| 7978 SW 90th Ter Ocala, FL | 2.0 | 2.0 | 1226 | $1,875 | $1.53 | 13d | 1 | 1.23mi |
| 9770 SW 92nd Place Rd Ocala, FL | 2.0 | 2.0 | 1399 | $2,200 | $1.57 | 21d | 1 | 1.24mi |
| 8935 SW 102nd Pl Ocala, FL | 2.0 | 2.0 | 1144 | $1,500 | $1.31 | 21d | 1 | 1.28mi |
| 7750 SW 100th St Ocala, FL | 3.0 | 2.0 | 1805 | $1,750 | $0.97 | 13d | 1 | 1.28mi |
| 7750 SW 100th St Ocala, FL | 3.0 | 2.0 | 1805 | $1,795 | $0.99 | 21d | 1 | 1.28mi |
| 9746 SW 89th Loop Ocala, FL | 2.0 | 2.0 | 1660 | $1,950 | $1.17 | 21d | 1 | 1.28mi |
| 9075 SW 102nd Pl Ocala, FL | 2.0 | 2.0 | 1008 | $1,275 | $1.26 | 21d | 1 | 1.33mi |
| 9758 SW 96th St Ocala, FL | 2.0 | 2.0 | 1219 | $1,400 | $1.15 | 21d | 1 | 1.41mi |
| 9748 SW 97th St Ocala, FL | 2.0 | 2.0 | 1105 | $1,500 | $1.36 | 21d | 1 | 1.43mi |
| 9794 SW 96th St Ocala, FL | 2.0 | 2.0 | 1201 | $1,700 | $1.42 | 21d | 1 | 1.45mi |
| 10081 SW 95th Ave Ocala, FL | 2.0 | 2.0 | 1040 | $1,395 | $1.34 | 21d | 1 | 1.45mi |
| 10211 SW 93rd Ct Ocala, FL | 3.0 | 2.0 | 1456 | $1,495 | $1.03 | 21d | 1 | 1.45mi |
| 9119 SW 99th Court Rd Ocala, FL | 2.0 | 2.0 | 1504 | $1,900 | $1.26 | 21d | 1 | 1.46mi |
| 10441 SW 85th Ct Ocala, FL | 2.0 | 2.0 | 1090 | $1,495 | $1.37 | 21d | 1 | 1.50mi |
| 8710 SW 71st Ave Ocala, FL | 1.0–3.0 | 1.0–2.5 | 1312 | $1,975 | $1.51 | 13d | 27 | 1.50mi |
Listing history 15 events
-
2026-06-18days on market $159,999 Active 117 DOM
-
2026-06-17days on market $159,999 Active 116 DOM
-
2026-06-16days on market $159,999 Active 115 DOM
-
2026-06-15days on market $159,999 Active 114 DOM
-
2026-06-14days on market $159,999 Active 112 DOM
-
2026-06-13days on market $159,999 Active 111 DOM
-
2026-06-10days on market $159,999 Active 109 DOM
-
2026-06-09days on market $159,999 Active 108 DOM
-
2026-06-08days on market $159,999 Active 107 DOM
-
2026-06-07days on market $159,999 Active 106 DOM
-
2026-06-03days on market $159,999 Active 102 DOM
-
2026-06-02days on market $159,999 Active 101 DOM
-
2026-05-31days on market $159,999 Active 99 DOM
-
2026-05-30days on market $159,999 Active 98 DOM
-
2026-02-21$159,999 Active 191-char remark
Show marketing remark (191 chars)
Excellent community, outdoor pools, golf, fitness centers , restaurants, public transportation, 24 hours gate security , new vinyl flooring, fresh paint, spacious bedrooms, walk in closet etc
ⓘ Source: listings_history table (triggers on properties + properties_extension) + one-shot
backfill from property_details.listing_events for pre-trigger history.
Nearby sold comps map
Loading sold comps map…
Walkable amenities ~0.75 mi
Loading nearby amenities…
Taxation est. · year 1
- Rental income
- $19,795
- − Mortgage interest
- −$8,962
- − Property taxes
- −$2,400
- − Insurance
- −$800
- − Repairs & maintenance
- −$1,584
- − Management
- −$1,584
- − Depreciation
- −$4,655
- Taxable loss
- −$189
- Est. tax savings @ 24.0%
- +$45
- After-tax cash flow
- $2,415/yr
For passive investors: Depreciation is non-cash, so a rental often shows a tax loss while cash-flowing — sheltering income. Rental losses are passive: they offset passive income freely, and up to $25,000/yr can offset ordinary (W-2) income if you actively participate and your MAGI is under $100k (phasing out to $0 by $150k); unused losses carry forward. On sale, claimed depreciation is recaptured at up to 25%, and gains may owe capital-gains tax (a 1031 exchange can defer both). Figures are a year-1 estimate at your 24.0% rate — not tax advice; consult a CPA.
Condition & rehab AI · 12 photos
This townhouse is in good condition with cosmetic updates needed to modernize the kitchen and bathroom. The fresh paint and well-maintained landscaping contribute to its overall appeal.
Repairs flagged
- Minor kitchen cabinets — dated design
- Minor bathroom fixtures — dated design
Value-add opportunities
- Resale update kitchen cabinets — modernizing kitchen
- Resale update bathroom fixtures — modernizing bathroom
- Both replace carpet — improves curb appeal and comfort
Renovation cost estimate screening
| Repair item | Severity | Est. cost |
|---|---|---|
| kitchen cabinets · dated design | Minor | $500–3,000 |
| bathroom fixtures · dated design | Minor | $500–3,000 |
| Total estimated repair cost · 2 items | $1,000–6,000 |
Value-add ROI direction
- Resale update kitchen cabinets — modernizing kitchen ↑
- Resale update bathroom fixtures — modernizing bathroom ↑
- Both replace carpet — improves curb appeal and comfort ↑
ⓘ Cost ranges are severity-bucket heuristics (US national rule-of-thumb). Get contractor quotes + a written scope before underwriting a rehab budget.
Schools (NCES district)
- District
- Marion
- NCES district ID
- 1201260
- Math proficiency
- 42% ▼ -7.00%
- Reading proficiency
- 43% ▼ -4.00%
- Median HH income
- $40,015
- Composite
- 35.61/100
- National rank
- #4890
- State rank
- #61 of 73 in FL
Livability — On Top of the World
No livability data for this city. (Only ~50 U.S. cities are tracked.)
Census & demographics
- Census place
- On Top of the World, FL
- County
- Marion County · 315,796 people
- City population
- 25,668
- Metro
- Ocala, FL
- Population (ZIP)
- 26,782
- Household income
- $57,324
- Rent vs Own
- Severe rent burden
- 313.0
Population outlook (Marion County) Hauer SSP2
- Today (2025)
- 365,905 people
- By 2030
- 376,768 · +3.0%
- By 2040
- 396,555 · +8.4%
- By 2050
- 412,723 · +12.8%
- By 2075
- 446,090 · +21.9%
- By 2100
- 436,193 · +19.2%
Race, ethnicity, and origin ACS 2023
- Neighborhood character
- Predominantly White (80%)
- Race & ethnicity
- White 80% Hispanic / Latino 11% Black 7% Two or more races 5%
- Hispanic origin (detail)
- Mexican 4% Puerto Rican 4% Cuban 1%
- Common ancestry
- Romanian 7% Lithuanian 3% Slovak 2%
- Foreign-born
- 8% · Canada, Jamaica
- Languages at home
- 88% English-only · Spanish 9% French/Haitian/Cajun 1% German/W. Germanic 1%
Political lean MEDSL · Marion
- 2024 margin
- Solid R (+31.6) · D 33.8% · R 65.5%
- 2008→2024 swing
- -20.0pp toward R · 2008: -11.6pp · 2024: -31.6pp
- All cycles
- 2024: R+31.6 2020: R+25.9 2016: R+26.2 2012: R+16.2 2008: R+11.6
Not yet ingested
- Civics
- —
Market trends
- HPI YoY
- ▼ -67.48%
- Current HPI
- 199.986
- Rent YoY
- —
- Metro
- Ocala, FL
- State GDP YoY
- ▲ 3.28%
- F500 in state
- 36
Industry mix (Fortune 500 HQ in FL)
| Industry | F500 HQs | Revenue |
|---|---|---|
| Industrial Technology | 2 | $29B |
|
||
| Insurance | 2 | $17B |
|
||
| Retail | 1 | $60B |
|
||
| Technology Distribution | 1 | $58B |
|
||
| Homebuilding | 1 | $35B |
|
||
| Technology Manufacturing | 1 | $35B |
|
||
Price history
1 event — show timeline
- 2026-02-21 Listed $159,999 ForSaleByOwner.com
Cash-flow waterfall
monthlySold comps — $/sqft
last 12 mo · ≤1 miLoading sold comps…