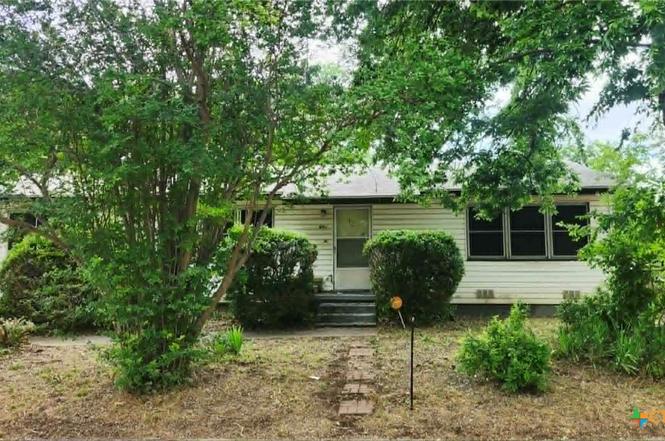
801 S 11th St · Copperas Cove, TX
Flood risk 1/10 · Minimal
- FEMA flood zone
- X (unshaded)
- Chance of flooding over 30 yrs
- 0.0%
- Est. flood insurance / yr
- $507 – $1,088
Fire risk 6/10 · Moderate
- Est. fire insurance / yr
- $1,222 – $2,270
Heat risk 7/10 · Major
- Hot days now (above 106°F)
- 7 days/yr
- Hot days in 30 yrs
- 23 days/yr
Wind risk 6/10 · Moderate
- Chance of severe wind over 30 yrs
- 55.0%
Air-quality risk 1/10 · Minimal
- Unhealthy air days now
- 0 days/yr
- Unhealthy air days in 30 yrs
- 0 days/yr
Risk factors via First Street. Map © Google.
Why this score? — see what drove the B+ grade
The composite is a weighted blend of 9 inputs, each scored 0–100. Each bar is that input's sub-score; the figure is the points it added to the 100-point composite (weight × sub-score).
- Cash flow +30.0/30.0
- ARV discount +15.0/15.0
- 1% rule +10.0/10.0
- DSCR +10.0/10.0
- Schools +3.6/10.0
- Livability +3.2/5.0
- Condition / age +2.5/5.0
- Rent growth +2.4/5.0
- Appreciation +0.0/10.0
$82,000
🖨 Deal sheet (PDF) 📄 Offer letter ✓ Due diligence
Listing remarks
INVESTOR'S DREAM WITH ENDLESS POTENTIAL! Opportunity is knocking with this solid home located in a well-established neighborhood known for its pride of ownership and beautifully maintained properties. Whether you're looking for your next flip, rental investment, or value-add project, this property offers the perfect foundation to create something special. Featuring original hardwood floors that are ready to shine again, this home has great bones and is in overall good condition, making it an ideal candidate for renovation without starting from scratch. The layout offers plenty of flexibility for modern updates while preserving the character and charm that today's buyers love. Surrounded
Key facts
- Thoughtful upgrades
- Curb appeal
- 8,398 sq ft lot
Tags
Property features AI
Finance
- Other:
- Financial info:
- HOA & community:
Exterior
- Parking:
- Security:
- Utilities: Electricity available; Phone available; Public water; Public sewer; Electricity on property
- Home design: Single-story home; Resale property
- Construction: Vinyl siding; Composition/shingle roof; Pillar/post/pier foundation; Year built (assessor source)
- Exterior features: Covered porch; Porch; Back yard fencing; City lot (less than quarter acre)
Interior
- Kitchen: Eat-in kitchen; Pantry; Breakfast area
- Bedrooms: One bedroom on the main level
- Flooring: Carpet; Hardwood
- Bathrooms: One full bathroom
- Heating & cooling: Central air conditioning
- Interior features: Ceiling fan(s); Eat-in kitchen; Living/dining room; Pantry; Breakfast area; See remarks
- Laundry & utility: Laundry on the main level
Neighborhood map
What this means for you Summary
Snapshot
- This is a 3-bed/1.0-bath single-family listed at $82k.
Deal economics
- At list price, monthly cash flow is $318 ($4k/yr) — positive.
- The deal already cash-flows at list — no discount required.
- Meets the 1% rule at list price ($1k rent vs $82k).
- Cap rate 10.9% vs local median 3.4% in Copperas Cove — top-decile yield for the area; either an underpriced asset or a hidden risk that comps aren't pricing in. Stress-test before assuming the spread holds.
Location & tenants
- Location reads 65/100 on livability (#706 in TX) — a middle-class / working-renter tenant base. Strengths: cost of living A+, housing A+; Watch: schools C-, employment D+, amenities F.
- Copperas Cove ISD (suburban): math 41% / reading 42% proficiency, ranked #340 of 826 in TX (top 41%) — families likely to look elsewhere, expect single-tenant / working-renter base with shorter leases.
- Market conditions: Rents soft (-0.2%/yr); 605 active listings in the ZIP; 40 comparable units currently listed for rent nearby; rentals lingering (median 45d on market — plan ~5-8 weeks vacancy on turnover, expect pricing pressure); 70% of comp listings sitting > 30 days — soft ceiling on asking rent; 386 units permitted in Coryell County in 2024 (0 in 5+ unit buildings).
Forward outlook
- Local home prices are declining (-3.0%/yr); year-one equity from $567 of loan paydown is wiped out by about $2k of value loss. Plan a longer hold.
Negotiation context
- Only 1 days on market — expect competitive offers; lowballing is unlikely to land.
Risks & watch-outs
- Watch-outs: property tax is 2.8% of price.
- Climate carrying-cost: major wind risk, 55% chance of damaging wind over 30y; major wildfire risk; extreme-heat days projected 7→23/yr by 2055 (HVAC capex compounding) — expect insurance premiums to compound above CPI over the hold.
Questions for the listing agent
- Built in 1962 — when were the roof, HVAC, electrical panel, plumbing, and water heater last replaced?
- Property tax is high relative to price — has the assessment been appealed recently, and will the sale trigger a re-assessment?
- Is there a deadline driving the sale (1031 exchange, divorce, estate, relocation)? That informs how much negotiation room exists.
- What's the average days-on-market for RENTAL listings here right now (not sales)? A rising rental-DOM trend means longer vacancies and softer asking-rent achievability than the comps imply.
- What's the recent tenant-quality profile in this submarket — average credit score on applications, eviction rate, late-payment / NSF rate, and stable-employment percentage? A property-management company in the area should have these aggregated.
- How much new for-sale + rental construction is in the pipeline within 1–3 miles? Heavy new supply typically softens prices + rents 12–24 months out; constrained supply supports both.
Investment metrics
- 1% rule
- 1.50% ✓
- Cap rate
- 10.95%
- Cash-on-cash
- 16.63%
- DSCR
- 1.74
- GRM
- 5.5
CMA / ARV
- ARV (on-the-fly)
- $146,016
- Comps found
- 12
Show comp detail 12 sales within ~0.75 mi
| Address | Dist | Beds/Ba | Sqft | Sold | Price | $/sf | Match |
|---|---|---|---|---|---|---|---|
| 609 S 11th St | 0.09mi | 2/1.0 (-1) | 1,464 (+8%) | 3mo | $83,000 | $57 | 74 |
| 514 S 11th St | 0.20mi | 2/1.0 (-1) | 1,464 (+8%) | 6mo | $112,000 | $77 | 66 |
| 802 S 23rd St | 0.32mi | 3/1.5 | 1,506 (+11%) | 1mo | $93,730 | $62 | 63 |
| 2110 Terrace Dr | 0.68mi | 3/1.0 | 1,377 (+2%) | 4mo | $165,000 | $120 | 62 |
| 2004 Veterans Ave | 0.48mi | 4/1.5 (+1) | 1,286 (-5%) | 3mo | $160,000 | $124 | 60 |
| 910 Leonhard St | 0.68mi | 4/1.0 (+1) | 1,287 (-5%) | 1mo | $125,000 | $97 | 55 |
| 2115 Urbantke Ln | 0.62mi | 2/1.5 (-1) | 1,397 (+3%) | 6mo | $159,900 | $114 | 53 |
| 815 Shady Ln | 0.72mi | 3/1.5 | 1,404 (+4%) | 6mo | $92,500 | $66 | 53 |
| 117 Myra Lou Ave | 0.60mi | 3/2.0 | 1,252 (-7%) | 4mo | $135,000 | $108 | 52 |
| 208 N 2nd St | 0.68mi | 3/2.0 | 1,476 (+9%) | 2mo | $160,000 | $108 | 47 |
| 413 W Lincoln Ave | 0.74mi | 3/2.0 | 1,200 (-11%) | 6mo | $187,000 | $156 | 38 |
| 903 Bluff Dr | 0.66mi | 3/2.0 | 1,149 (-15%) | 5mo | $155,000 | $135 | 36 |
Match score weights: distance 35% · size 25% · config 20% · recency 20%. Top-matched comps best support the ARV.
Projected returns pro-forma
-3.0% appreciation · 0.0% rent growth · sell at horizon
- IRR
- 4.0%
- Equity multiple
- 1.15×
- Total profit
- $3,443
- Equity at exit
- $12,226
- IRR
- 10.2%
- Equity multiple
- 1.67×
- Total profit
- $15,440
- Equity at exit
- $7,090
Cash invested: $22,960 (down + closing). Projections, not guarantees.
Landlord ↔ Tenant lean methodology
- Overall (STATE)
- 87 Strongly Landlord-Friendly
- State Texas
- 87 Strongly Landlord-Friendly · R+5
- County
- — inherits STATE
- City
- — inherits STATE
ZIP-level market 76522
- Home prices YoY
- -22.4%
- Rents YoY
- -0.2%
- Active inventory
- 605
- Price-to-rent
- 5.5×
Monthly cashflow live
- Estimated rent
- $1,232 high interval (Pro) →
- Mortgage (P&I)
- −$430
- Tax from tax record
- −$191 /mo · $2,289/yr
- Insurance
- −$34
- HOA
- −$0
- Vacancy / Maint / Mgmt
- −$259
- Net cashflow
- $318
Break-even live
Sensitivity live
| Price | -10% $365 | -5% $341 | +0% $318 | +5% $295 | +10% $272 |
|---|---|---|---|---|---|
| Rent | -10% $221 | -5% $270 | +0% $318 | +5% $367 | +10% $416 |
| Rate | -1.0pp $360 | -0.5pp $339 | base $318 | +0.5pp $297 | +1.0pp $275 |
UW: 25.0% down · 7.5% · 30yr · 1.5% tax · 5.0% vac · 8.0% maint · 8.0% mgmt
Financing live
Cash to close
- Down payment
- $20,500
- Closing costs
- $2,460
- Reserves months
- —
- Total cash needed
- —
Loan-product check · same deal, 3 products live
Conventional
25% down · 7.5% · 30yr
- Down + closing
- —
- Monthly P&I
- —
- Monthly cashflow
- —
- DSCR
- —
- Eligible?
- —
Personal DTI + credit; lowest rate.
DSCR
20% down · 8.5% · 30yr
- Down + closing
- —
- Monthly P&I
- —
- Monthly cashflow
- —
- DSCR
- —
- Eligible?
- —
No personal income docs; deal must DSCR.
Hard money
10% down · 12.0% · 12mo
- Down + closing
- —
- Monthly P&I
- —
- Monthly cashflow
- —
- DSCR
- —
- Eligible?
- —
Short-term bridge; refi at stabilization.
Rent comps 40 comps
| Address | Beds | Baths | Sqft | Rent | $/sqft | DOM | Units | Dist |
|---|---|---|---|---|---|---|---|---|
| 604 S 11th St Copperas Cove, TX | 3.0 | 2.0 | 1119 | $1,300 | $1.16 | 44d | 1 | 0.16mi |
| 808 Mary St Copperas Cove, TX | 3.0 | 1.0 | 1028 | $1,300 | $1.26 | 44d | 1 | 0.16mi |
| 915 S 15th St Copperas Cove, TX | 3.0 | 2.0 | 1008 | $850 | $0.84 | 14d | 1 | 0.17mi |
| 904 Mary St Copperas Cove, TX | 3.0 | 2.0 | 1041 | $1,052 | $1.01 | 44d | 1 | 0.18mi |
| 1005 S 11th St Copperas Cove, TX | 4.0 | 2.0 | 1236 | $1,090 | $0.88 | 44d | 1 | 0.18mi |
| 504 Highway Ave Unit B Copperas Cove, TX | 2.0 | 1.0 | 1500 | $700 | $0.47 | 44d | 1 | 0.23mi |
| 1004 S 3rd St Copperas Cove, TX | 3.0 | 1.0 | 940 | $950 | $1.01 | 24d | 1 | 0.23mi |
| 1010 Georgetown Rd Copperas Cove, TX | 3.0 | 1.0 | 1018 | $995 | $0.98 | 44d | 1 | 0.27mi |
| 403 S 7th St Copperas Cove, TX | 3.0 | 1.0 | 910 | $1,100 | $1.21 | 44d | 1 | 0.29mi |
| 502 S 9th St Copperas Cove, TX | 3.0 | 1.5 | 1479 | $1,150 | $0.78 | 44d | 1 | 0.30mi |
| 1005 S 19th St Copperas Cove, TX | 3.0 | 1.5 | 1356 | $1,100 | $0.81 | 44d | 1 | 0.31mi |
| 1201 S 9th St Copperas Cove, TX | 3.0 | 2.0 | 1172 | $1,100 | $0.94 | 24d | 1 | 0.31mi |
| 1204 S 7th St Copperas Cove, TX | 3.0 | 2.0 | 1202 | $1,295 | $1.08 | 44d | 1 | 0.33mi |
| 1202 S 3rd St Copperas Cove, TX | 3.0 | 2.0 | 1056 | $1,175 | $1.11 | 44d | 1 | 0.35mi |
| 1006 S 21st St Copperas Cove, TX | 4.0 | 2.0 | 1445 | $1,100 | $0.76 | 44d | 1 | 0.37mi |
| 806 S 25th St Copperas Cove, TX | 3.0 | 2.0 | 1400 | $1,400 | $1.00 | 44d | 1 | 0.38mi |
| 607 Curry Ave Copperas Cove, TX | 3.0 | 1.5 | 1192 | $935 | $0.78 | 24d | 1 | 0.40mi |
| 204 West Avenue F Unit A Copperas Cove, TX | 2.0 | 1.0 | 895 | $725 | $0.81 | 44d | 1 | 0.41mi |
| 204 West Avenue F Unit B Copperas Cove, TX | 2.0 | 1.0 | 895 | $705 | $0.79 | 44d | 1 | 0.41mi |
| 903 Curry Ave Copperas Cove, TX | 3.0 | 2.5 | 1285 | $1,200 | $0.93 | 24d | 1 | 0.42mi |
| 1208 S 19th St Copperas Cove, TX | 3.0 | 1.5 | 1010 | $1,525 | $1.51 | 24d | 1 | 0.44mi |
| 603 Westview Cir Unit A Copperas Cove, TX | 2.0 | 1.0 | 1537 | $700 | $0.46 | 44d | 1 | 0.45mi |
| 414 West Avenue C Unit C Copperas Cove, TX | 3.0 | 2.0 | 1343 | $1,600 | $1.19 | 44d | 1 | 0.52mi |
| 412 West Avenue C Unit C Copperas Cove, TX | 3.0 | 2.0 | 1343 | $1,600 | $1.19 | 22d | 1 | 0.52mi |
| 509 West Avenue B Copperas Cove, TX | 3.0 | 2.0 | 1339 | $1,175 | $0.88 | 24d | 1 | 0.55mi |
| 1302 S 23rd St Copperas Cove, TX | 4.0 | 1.5 | 1453 | $1,320 | $0.91 | 44d | 1 | 0.55mi |
| 1007 S 29th St Copperas Cove, TX | 3.0 | 2.0 | 1176 | $1,400 | $1.19 | 14d | 1 | 0.55mi |
| 2104 Brantley Ave Copperas Cove, TX | 3.0 | 1.0 | 1140 | $1,495 | $1.31 | 44d | 1 | 0.60mi |
| 1008 S 31st St Copperas Cove, TX | 3.0 | 2.0 | 1350 | $1,145 | $0.85 | 14d | 1 | 0.65mi |
| 1202 S FM 116 Copperas Cove, TX | 1.0–3.0 | 1.0–2.0 | 922 | $1,560 | $1.69 | 14d | 12 | 0.65mi |
| 309 Myra Lou Ave Copperas Cove, TX | 3.0 | 2.0 | 1269 | $1,125 | $0.89 | 44d | 1 | 0.65mi |
| 914 Chalk St Copperas Cove, TX | 3.0 | 2.0 | 1107 | $1,200 | $1.08 | 24d | 1 | 0.72mi |
| 1307 Sherry Ln Unit B Copperas Cove, TX | 2.0 | 1.0 | 1775 | $1,299 | $0.73 | 44d | 1 | 0.73mi |
| 605 N 11th St Copperas Cove, TX | 3.0 | 2.0 | 1432 | $1,575 | $1.10 | 44d | 1 | 0.79mi |
| 1002 W Avenue B Unit B Copperas Cove, TX | 2.0 | 2.0 | 1842 | $975 | $0.53 | 44d | 1 | 0.86mi |
| 604 N Main St Apt C Copperas Cove, TX | 2.0 | 1.5 | 1000 | $750 | $0.75 | 44d | 1 | 0.88mi |
| 604 N Main St Apt D Copperas Cove, TX | 3.0 | 1.5 | 1100 | $900 | $0.82 | 44d | 1 | 0.88mi |
| 204 W Truman Ave Unit D Copperas Cove, TX | 2.0 | 1.0 | 895 | $800 | $0.89 | 44d | 1 | 0.89mi |
| 204 South Dr Unit A Copperas Cove, TX | 2.0 | 1.0 | 895 | $999 | $1.12 | 44d | 1 | 0.89mi |
| 105 E Reagan Ave Copperas Cove, TX | 2.0 | 1.0 | 1758 | $675 | $0.38 | 44d | 1 | 0.93mi |
Listing history 2 events
-
2026-06-18remarks 699-char remark
-
2026-06-18$82,000 Active 1 DOM
ⓘ Source: listings_history table (triggers on properties + properties_extension) + one-shot
backfill from property_details.listing_events for pre-trigger history.
Tax reassessment forecast TX · Resets to sale price
- Current annual tax
- $2,289 · $191/mo
- Projected year-2 tax
- $2,289 · $191/mo
- Expected delta
- $0/yr ($0/mo · 0.0%)
ⓘ Screening estimate from a state-policy table — verify with the county assessor before closing.
Climate risk First Street
- Flood 1/10 Low FEMA zone X (unshaded) · 0% chance over 30 yrs
- Wildfire 6/10 Major
- Heat 7/10 Severe 7 d/yr ≥106°F today · 23 d/yr by 30 yrs out
- Wind 6/10 Major 55% chance of damaging wind over 30 yrs
- Air quality 1/10 Low 0 unhealthy d/yr today · 0 by 30 yrs out
Nearby sold comps map
Loading sold comps map…
Walkable amenities ~0.75 mi
Loading nearby amenities…
Taxation est. · year 1
- Rental income
- $14,782
- − Mortgage interest
- −$4,593
- − Property taxes
- −$2,289
- − Insurance
- −$410
- − Repairs & maintenance
- −$1,183
- − Management
- −$1,183
- − Depreciation
- −$2,385
- Taxable income
- $2,739
- Est. tax owed @ 24.0%
- −$657
- After-tax cash flow
- $3,161/yr
For passive investors: Depreciation is non-cash, so a rental often shows a tax loss while cash-flowing — sheltering income. Rental losses are passive: they offset passive income freely, and up to $25,000/yr can offset ordinary (W-2) income if you actively participate and your MAGI is under $100k (phasing out to $0 by $150k); unused losses carry forward. On sale, claimed depreciation is recaptured at up to 25%, and gains may owe capital-gains tax (a 1031 exchange can defer both). Figures are a year-1 estimate at your 24.0% rate — not tax advice; consult a CPA.
Schools (NCES district)
- District
- Copperas Cove ISD
- NCES district ID
- 4815240
- Math proficiency
- 41% ▼ -6.00%
- Reading proficiency
- 42% ▼ -2.00%
- Median HH income
- $51,072
- Composite
- 35.85/100
- National rank
- #4822
- State rank
- #340 of 826 in TX
Livability — Copperas Cove
- Score
- 65/100
- State rank
- #706
- US rank
- #13158
Category grades
Schools grade is shown separately in the Schools card above.
Census & demographics
- Census place
- Copperas Cove, TX
- County
- Coryell County · 61,053 people
- City population
- 42,118
- Metro
- Killeen-Temple, TX
- Population (ZIP)
- 42,118
- Household income
- $72,206
- Rent vs Own
- Severe rent burden
- 1019.0
Population outlook (Coryell County) Hauer SSP2
- Today (2025)
- 75,485 people
- By 2030
- 75,627 · +0.2%
- By 2040
- 74,898 · -0.8%
- By 2050
- 74,221 · -1.7%
- By 2075
- 72,688 · -3.7%
- By 2100
- 66,862 · -11.4%
Race, ethnicity, and origin ACS 2023
- Neighborhood character
- Diverse neighborhood (Simpson 0.66)
- Race & ethnicity
- White 53% Hispanic / Latino 21% Two or more races 20% Black 14% Asian 2%
- Hispanic origin (detail)
- Mexican 11% Puerto Rican 6%
- Common ancestry
- Romanian 2% Italian 2% Lithuanian 2%
- Foreign-born
- 7% · Canada, South Korea
- Languages at home
- 85% English-only · Spanish 10% German/W. Germanic 2% Other Asian/Pacific 1%
Political lean MEDSL · Coryell
- 2024 margin
- Solid R (+40.7) · D 29.1% · R 69.8% · Other 1.1%
- 2008→2024 swing
- -13.8pp toward R · 2008: -26.9pp · 2024: -40.7pp
- All cycles
- 2024: R+40.7 2020: R+33.5 2016: R+39.5 2012: R+36.6 2008: R+26.9
Not yet ingested
- Civics
- —
Market trends
- HPI YoY
- ▼ -53.11%
- Current HPI
- 183.9452
- Rent YoY
- ▼ -0.25%
- Metro
- Killeen-Temple, TX
- State GDP YoY
- ▲ 3.95%
- F500 in state
- 110
Industry mix (Fortune 500 HQ in TX)
| Industry | F500 HQs | Revenue |
|---|---|---|
| Energy | 16 | $1,198B |
|
||
| Technology | 5 | $198B |
|
||
| Engineering / Construction | 4 | $72B |
|
||
| Energy Services | 3 | $60B |
|
||
| Utilities | 3 | $41B |
|
||
| Healthcare | 2 | $330B |
|
||
Price history
4 events — show timeline
- 2026-06-17 Listed $82,000 CTXMLS
- 2026-05-29 Sold (Public Records) — Public Records
- 2005-11-30 Sold (Public Records) — Public Records
- 1998-07-17 Sold (Public Records) — Public Records
Property tax history
+4.0%/yrLatest (2025): $2,289 · -1.2% YoY. Source: county tax records.
Cash-flow waterfall
monthlySold comps — $/sqft
last 12 mo · ≤1 miLoading sold comps…