2016 Glenridge Dr · Indianapolis city (balance), IN
Flood risk 1/10 · Minimal
- FEMA flood zone
- X (unshaded)
- Chance of flooding over 30 yrs
- 0.0%
- Est. flood insurance / yr
- $473 – $860
Fire risk 1/10 · Minimal
- Est. fire insurance / yr
- $717 – $1,331
Heat risk 3/10 · Minor
- Hot days now (above 101°F)
- 7 days/yr
- Hot days in 30 yrs
- 18 days/yr
Wind risk 2/10 · Minimal
- Chance of severe wind over 30 yrs
- 0.0%
Air-quality risk 4/10 · Minor
- Unhealthy air days now
- 5 days/yr
- Unhealthy air days in 30 yrs
- 7 days/yr
Risk factors via First Street. Map © Google.
Why this score? — see what drove the D- grade
The composite is a weighted blend of 9 inputs, each scored 0–100. Each bar is that input's sub-score; the figure is the points it added to the 100-point composite (weight × sub-score).
- Cash flow +15.3/30.0
- ARV discount +5.6/15.0
- DSCR +4.7/10.0
- 1% rule +4.0/10.0
- Rent growth +2.7/5.0
- Livability +2.5/5.0
- Condition / age +2.5/5.0
- Schools +1.4/10.0
- Appreciation +0.0/10.0
$165,000
🖨 Deal sheet (PDF) 📄 Offer letter ✓ Due diligence
Listing remarks MLS
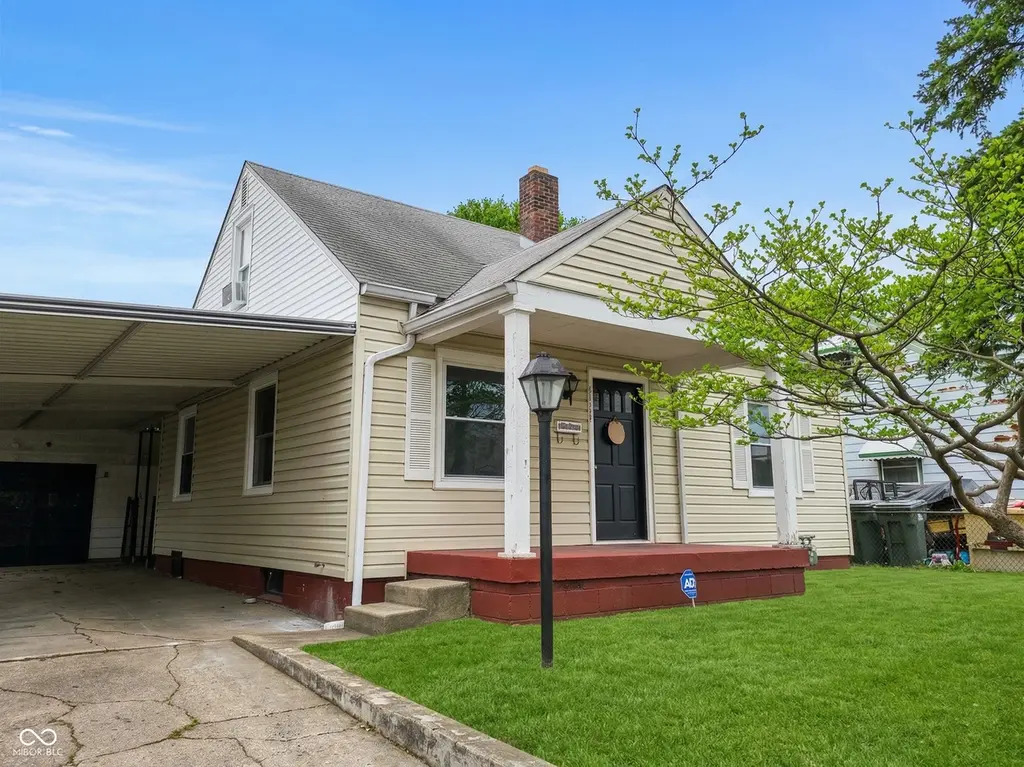
This 4-bedroom bungalow in the Wrighthurst subdivision offers a functional two-story layout with a classic aesthetic. The main level features hardwood flooring throughout the living room, formal dining room, and primary bedrooms, while the kitchen is equipped with a tiled backsplash and cabinetry. With a split-bedroom design, the home provides two bedrooms on the main floor and two additional bedrooms upstairs, complemented by an unfinished basement that serves as a versatile storage space. Exterior amenities include a fully fenced backyard, a covered front porch, and an oversized detached garage. Residents will appreciate the proximity to downtown Indianapolis, including the diverse dining and shopping options within the Bottleworks District and the nearby recreational green spaces of Brookside Park.
Key facts
- 5,793 sq ft lot
- Garage
- Built 1949
Neighborhood map
What this means for you Summary
Snapshot
- This is a 4-bed/1.0-bath single-family listed at $165k.
Deal economics
- At list price, monthly cash flow is $61 ($727/yr) — positive.
- The deal already cash-flows at list — no discount required.
- To meet the 1% rule (rent ≥ 1% of price), the offer needs to be $148k (10.4% below list).
- Recommended offer: $148k (10.4% below list) — sets the bar for 1% rule.
- Cap rate 6.7% vs local median 4.4% in Indianapolis city (balance) — top-decile yield for the area; either an underpriced asset or a hidden risk that comps aren't pricing in. Stress-test before assuming the spread holds.
Location & tenants
- Location reads: area grade D — affects rentability + tenant quality, not the cash-flow math above.
- Indianapolis Public Schools (urban): math 14% / reading 20% proficiency, ranked #286 of 301 in IN (top 95%) — low school quality limits family demand, transient renter base, plan for 1-2y turnover; 77% free/reduced lunch — lower-income household profile, screen leases tightly.
- Zoned schools: Center For Inquiry School 27 (math 25% / reading 29%, grade F, #737 of 994 statewide, top 76%, 525 students, 51% FRL); H L Harshman Middle School (math 3% / reading 16%, grade F, #316 of 330 statewide, top 96%, 549 students, 84% FRL).
- Market conditions: Rents flat; 338 active listings in the ZIP; 40 comparable units currently listed for rent nearby; rentals at typical pace (median 26d on market — plan ~3-4 weeks tenant-placement turnaround); lower-income renter base — watch delinquency; 1,906 units permitted in Marion County in 2024 (621 in 5+ unit buildings).
- At $1,479/mo this rent would consume 47% of the median local household income ($38k/yr) (locally 2340% of renters already pay >50% of income on rent) — very limited rent-growth headroom before tenants either downsize or default.
Forward outlook
- Local home prices are declining (-3.0%/yr); year-one equity from $1k of loan paydown is wiped out by about $5k of value loss. Plan a longer hold.
- Marion County population projected at +18% by 2050 — long-run rental-demand tailwind backs the buy-and-hold thesis.
Negotiation context
- It's been on market 80 days — a 6% lower offer ($155k) is reasonable based on typical stale-listing flexibility.
- 5 sale attempts since 10y ago with the ask held roughly flat each time — persistent listings suggest the price (not the market) is what's stuck; bring a comps-based counter.
Risks & watch-outs
- Watch-outs: built in 1949 — expect roof / HVAC / electrical / plumbing capex.
Questions for the listing agent
- It's been on market 80 days. Have you received any prior offers? Is the seller open to a 10% concession, seller financing, or rate buy-down credit?
- Built in 1949 — when were the roof, HVAC, electrical panel, plumbing, and water heater last replaced?
- Why hasn't it sold? Are there any deal-killer items the seller is aware of (foundation, flood, title, zoning, code violations)?
- Is there a deadline driving the sale (1031 exchange, divorce, estate, relocation)? That informs how much negotiation room exists.
- The area grade is low — what's the realistic commute time and amenity access for the typical tenant pool here? Any planned neighborhood developments (good or bad) we should know about?
- What's the average days-on-market for RENTAL listings here right now (not sales)? A rising rental-DOM trend means longer vacancies and softer asking-rent achievability than the comps imply.
- What's the recent tenant-quality profile in this submarket — average credit score on applications, eviction rate, late-payment / NSF rate, and stable-employment percentage? A property-management company in the area should have these aggregated.
- How much new for-sale + rental construction is in the pipeline within 1–3 miles? Heavy new supply typically softens prices + rents 12–24 months out; constrained supply supports both.
Investment metrics
- 1% rule
- 0.90% ✗
- Cap rate
- 6.73%
- Cash-on-cash
- 1.57%
- DSCR
- 1.07
- GRM
- 9.3
CMA / ARV
- ARV (median comp)
- $158,405
- List price
- $165,000
- Delta
- 4.16%
- Verdict
- FAIR
- Comps
- 20 within 1.0 mi
Show comp detail 12 sales within ~0.75 mi
| Address | Dist | Beds/Ba | Sqft | Sold | Price | $/sf | Match |
|---|---|---|---|---|---|---|---|
| 4512 E 21st St | 0.11mi | 3/1.0 (-1) | 1,520 (+4%) | 4mo | $145,000 | $95 | 79 |
| 1943 N Drexel Ave | 0.10mi | 3/2.0 (-1) | 1,560 (+7%) | 5mo | $175,000 | $112 | 70 |
| 4621 E 17th St | 0.37mi | 3/1.5 (-1) | 1,542 (+6%) | 12mo | $170,000 | $110 | 56 |
| 1517 N Gladstone Ave | 0.52mi | 3/1.5 (-1) | 1,512 (+4%) | 8mo | $160,000 | $106 | 56 |
| 1820 N Dequincy St | 0.32mi | 4/2.0 | 1,261 (-13%) | 12mo | $190,000 | $151 | 48 |
| 1315 N Grant Ave N | 0.74mi | 3/2.5 (-1) | 1,404 (-4%) | 2mo | $250,000 | $178 | 47 |
| 1512 Wallace Ave | 0.51mi | 3/1.0 (-1) | 1,296 (-11%) | 8mo | $120,000 | $93 | 47 |
| 1610 N Euclid Ave | 0.41mi | 3/2.0 (-1) | 1,632 (+12%) | 9mo | $83,000 | $51 | 44 |
| 1433 N Denny St | 0.70mi | 3/1.0 (-1) | 1,384 (-5%) | 12mo | $53,000 | $38 | 44 |
| 2241 N Spencer Ave | 0.70mi | 3/2.0 (-1) | 1,272 (-13%) | 0mo | $147,000 | $116 | 37 |
| 1434 N Chester Ave | 0.69mi | 3/2.0 (-1) | 1,274 (-12%) | 2mo | $232,000 | $182 | 37 |
| 1331 N Grant Ave | 0.72mi | 3/1.0 (-1) | 1,591 (+9%) | 12mo | $245,000 | $154 | 36 |
Match score weights: distance 35% · size 25% · config 20% · recency 20%. Top-matched comps best support the ARV.
Projected returns pro-forma
-3.0% appreciation · 0.81% rent growth · sell at horizon
- IRR
- -16.2%
- Equity multiple
- 0.44×
- Total profit
- $-26,068
- Equity at exit
- $24,602
- IRR
- -12.2%
- Equity multiple
- 0.35×
- Total profit
- $-30,248
- Equity at exit
- $14,266
Cash invested: $46,200 (down + closing). Projections, not guarantees.
Landlord ↔ Tenant lean methodology
- Overall (STATE)
- 90 Strongly Landlord-Friendly
- State Indiana
- 90 Strongly Landlord-Friendly · R+11
- County
- — inherits STATE
- City
- — inherits STATE
ZIP-level market 46218
- Home prices YoY
- -17.1%
- Rents YoY
- 0.8%
- Active inventory
- 338
- Price-to-rent
- 9.3×
Monthly cashflow live
- Estimated rent
- $1,479 high interval (Pro) →
- Mortgage (P&I)
- −$865
- Tax from tax record
- −$174 /mo · $2,084/yr
- Insurance
- −$69
- HOA
- −$0
- Vacancy / Maint / Mgmt
- −$311
- Net cashflow
- $61
Break-even live
Sensitivity live
| Price | -10% $154 | -5% $107 | +0% $61 | +5% $14 | +10% $-33 |
|---|---|---|---|---|---|
| Rent | -10% $-56 | -5% $2 | +0% $61 | +5% $119 | +10% $177 |
| Rate | -1.0pp $144 | -0.5pp $103 | base $61 | +0.5pp $18 | +1.0pp $-26 |
UW: 25.0% down · 7.5% · 30yr · 1.5% tax · 5.0% vac · 8.0% maint · 8.0% mgmt
Financing live
Cash to close
- Down payment
- $41,250
- Closing costs
- $4,950
- Reserves months
- —
- Total cash needed
- —
Loan-product check · same deal, 3 products live
Conventional
25% down · 7.5% · 30yr
- Down + closing
- —
- Monthly P&I
- —
- Monthly cashflow
- —
- DSCR
- —
- Eligible?
- —
Personal DTI + credit; lowest rate.
DSCR
20% down · 8.5% · 30yr
- Down + closing
- —
- Monthly P&I
- —
- Monthly cashflow
- —
- DSCR
- —
- Eligible?
- —
No personal income docs; deal must DSCR.
Hard money
10% down · 12.0% · 12mo
- Down + closing
- —
- Monthly P&I
- —
- Monthly cashflow
- —
- DSCR
- —
- Eligible?
- —
Short-term bridge; refi at stabilization.
Rent comps 40 comps
| Address | Beds | Baths | Sqft | Rent | $/sqft | DOM | Units | Dist |
|---|---|---|---|---|---|---|---|---|
| 4732 E 18th St Unit A Indianapolis, IN | 3.0 | 2.0 | 1200 | $1,700 | $1.42 | 45d | 1 | 0.33mi |
| 2194 N Riley Ave Indianapolis, IN | 3.0 | 1.0 | 1100 | $1,749 | $1.59 | 45d | 1 | 0.45mi |
| 5130 E 21st St Indianapolis, IN | 3.0 | 2.0 | 1188 | $1,500 | $1.26 | 45d | 1 | 0.58mi |
| 5130 E 21st St Indianapolis, IN | 3.0 | 2.0 | 1188 | $1,500 | $1.26 | 25d | 1 | 0.58mi |
| 4930 Elliott Ave Indianapolis, IN | 4.0 | 1.0 | 1219 | $1,500 | $1.23 | 45d | 1 | 0.58mi |
| 2221 Station St Indianapolis, IN | 3.0 | 2.5 | 1312 | $1,600 | $1.22 | 25d | 1 | 0.63mi |
| 1531 N Kealing Ave Unit A Indianapolis, IN | 3.0 | 2.0 | 1250 | $1,397 | $1.12 | 25d | 1 | 0.74mi |
| 1531 N Kealing Ave Indianapolis, IN | 3.0 | 2.0 | 1250 | $1,500 | $1.20 | 25d | 1 | 0.74mi |
| 1424 N Denny St Indianapolis, IN | 3.0 | 1.0 | 1206 | $1,295 | $1.07 | 45d | 1 | 0.74mi |
| 1521 N Kealing Ave Indianapolis, IN | 3.0 | 1.0 | 1250 | $1,250 | $1.00 | 19d | 1 | 0.75mi |
| 2819 N Gladstone Ave Indianapolis, IN | 4.0 | 2.0 | 1261 | $1,450 | $1.15 | 45d | 1 | 0.87mi |
| 1341 N Gale St Indianapolis, IN | 4.0 | 2.0 | 899 | $2,000 | $2.22 | 25d | 1 | 0.93mi |
| 2864 Forest Manor Ave Indianapolis, IN | 3.0 | 1.0 | 1018 | $1,500 | $1.47 | 25d | 1 | 0.97mi |
| 2045 N Dearborn St Indianapolis, IN | 3.0 | 2.0 | 912 | $1,145 | $1.26 | 25d | 1 | 0.99mi |
| 2862 N Chester Ave Indianapolis, IN | 3.0 | 2.0 | 1076 | $1,520 | $1.41 | 45d | 1 | 1.00mi |
| 3451 E 26th St Indianapolis, IN | 3.0 | 2.0 | 1200 | $1,650 | $1.38 | 45d | 1 | 1.01mi |
| 3449 E 26th St Indianapolis, IN | 3.0 | 2.0 | 1200 | $1,512 | $1.26 | 3d | 1 | 1.01mi |
| 2932 Arthington Blvd Indianapolis, IN | 3.0 | 1.0 | 900 | $1,350 | $1.50 | 25d | 1 | 1.02mi |
| 2410 Adams St Indianapolis, IN | 3.0 | 1.0 | 900 | $1,200 | $1.33 | 12d | 1 | 1.02mi |
| 1938 N Dearborn St Indianapolis, IN | 3.0 | 1.0 | 1162 | $1,400 | $1.20 | 25d | 1 | 1.02mi |
| 2826 Station St Indianapolis, IN | 3.0 | 2.0 | 1248 | $1,550 | $1.24 | 45d | 1 | 1.06mi |
| 2950 N Dequincy St Indianapolis, IN | 3.0 | 1.0 | 888 | $1,375 | $1.55 | 15d | 1 | 1.07mi |
| 861 N Drexel Ave Indianapolis, IN | 3.0 | 1.0 | 1000 | $1,200 | $1.20 | 9d | 1 | 1.10mi |
| 861 N Drexel Ave Unit 863 Indianapolis, IN | 3.0 | 1.0 | 1000 | $1,200 | $1.20 | 45d | 1 | 1.10mi |
| 2828 N Gale St Indianapolis, IN | 3.0 | 2.0 | 1248 | $1,260 | $1.01 | 0d | 1 | 1.11mi |
| 4320 E 30th St Indianapolis, IN | 3.0 | 1.5 | 1152 | $1,195 | $1.04 | 25d | 1 | 1.11mi |
| 4320 E 30th St Indianapolis, IN | 3.0 | 1.5 | 1152 | $1,195 | $1.04 | 0d | 1 | 1.11mi |
| 1015 N Gale St Indianapolis, IN | 3.0 | 2.0 | 1200 | $1,550 | $1.29 | 16d | 1 | 1.13mi |
| 3920 E 30th St Indianapolis, IN | 3.0 | 1.0 | 1071 | $1,350 | $1.26 | 6d | 1 | 1.17mi |
| 3920 E 30th St Indianapolis, IN | 3.0 | 1.0 | 1071 | $1,350 | $1.26 | 9d | 1 | 1.17mi |
| 801 N Gladstone Ave Indianapolis, IN | 3.0 | 1.5 | 1776 | $1,225 | $0.69 | 45d | 1 | 1.22mi |
| 2815 Brookside Ave Indianapolis, IN | 3.0 | 2.0 | 1120 | $1,350 | $1.21 | 12d | 1 | 1.22mi |
| 2810 Adams St Indianapolis, IN | 3.0 | 2.0 | 912 | $1,200 | $1.32 | 0d | 1 | 1.23mi |
| 2822 E 19th St Indianapolis, IN | 3.0 | 2.0 | 1130 | $1,300 | $1.15 | 45d | 1 | 1.23mi |
| 1018 N Tuxedo St Unit 1016 Indianapolis, IN | 3.0 | 1.5 | 1250 | $1,099 | $0.88 | 45d | 1 | 1.23mi |
| 1018 N Tuxedo St Unit 1016 Indianapolis, IN | 3.0 | 1.5 | 1250 | $1,099 | $0.88 | 0d | 1 | 1.23mi |
| 822 N Bradley Ave Unit 822 Indianapolis, IN | 3.0 | 1.0 | 1100 | $1,200 | $1.09 | 0d | 1 | 1.24mi |
| 822 N Bradley Ave Unit 822 Indianapolis, IN | 3.0 | 1.0 | 1100 | $1,200 | $1.09 | 45d | 1 | 1.24mi |
| 2827 Adams St Indianapolis, IN | 3.0 | 2.0 | 1200 | $1,512 | $1.26 | 3d | 1 | 1.24mi |
| 1119 N Dearborn St Indianapolis, IN | 3.0 | 1.5 | 1200 | $1,249 | $1.04 | 45d | 1 | 1.25mi |
Listing history 30 events
-
2026-06-21days on market $165,000 Active 80 DOM
-
2026-06-18days on market $165,000 Active 77 DOM
-
2026-06-17days on market $165,000 Active 76 DOM
-
2026-06-16days on market $165,000 Active 75 DOM
-
2026-06-15days on market $165,000 Active 74 DOM
-
2026-06-13days on market $165,000 Active 72 DOM
-
2026-06-13days on market $165,000 Active 71 DOM
-
2026-06-09days on market $165,000 Active 68 DOM
-
2026-06-08days on market $165,000 Active 67 DOM
-
2026-06-07days on market $165,000 Active 66 DOM
-
2026-06-03days on market $165,000 Active 62 DOM
-
2026-06-02days on market $165,000 Active 61 DOM
-
2026-06-01days on market $165,000 Active 60 DOM
-
2026-05-31days on market $165,000 Active 59 DOM
-
2026-04-02$165,000 Active 812-char remark
Show marketing remark (812 chars)
This 4-bedroom bungalow in the Wrighthurst subdivision offers a functional two-story layout with a classic aesthetic. The main level features hardwood flooring throughout the living room, formal dining room, and primary bedrooms, while the kitchen is equipped with a tiled backsplash and cabinetry. With a split-bedroom design, the home provides two bedrooms on the main floor and two additional bedrooms upstairs, complemented by an unfinished basement that serves as a versatile storage space. Exterior amenities include a fully fenced backyard, a covered front porch, and an oversized detached garage. Residents will appreciate the proximity to downtown Indianapolis, including the diverse dining and shopping options within the Bottleworks District and the nearby recreational green spaces of Brookside Park.
-
2026-03-17historical
-
2026-01-21price $185,000
-
2025-11-17price $190,000
-
2025-10-28price $200,000
-
2025-10-16price $205,000
-
2025-10-06$209,900 Active
-
2023-07-13soldstatus $172,500 Closed
-
2023-06-11status Pending
-
2023-06-01$175,000 Active
-
2023-03-27soldstatus $95,000 Closed
-
2023-02-28status Pending
-
2023-02-23$95,000 Active
-
2016-11-09historical
-
2016-07-05price $43,900
-
2016-05-10$44,900 Active
ⓘ Source: listings_history table (triggers on properties + properties_extension) + one-shot
backfill from property_details.listing_events for pre-trigger history.
Tax reassessment forecast IN · Partial reset (capped growth)
- Current annual tax
- $2,084 · $174/mo
- Projected year-2 tax
- $2,084 · $174/mo
- Expected delta
- $0/yr ($0/mo · 0.0%)
ⓘ Screening estimate from a state-policy table — verify with the county assessor before closing.
Climate risk First Street
- Flood 1/10 Low FEMA zone X (unshaded) · 0% chance over 30 yrs
- Wildfire 1/10 Low
- Heat 3/10 Moderate 7 d/yr ≥101°F today · 18 d/yr by 30 yrs out
- Wind 2/10 Low 0% chance of damaging wind over 30 yrs
- Air quality 4/10 Moderate 5 unhealthy d/yr today · 7 by 30 yrs out
Nearby sold comps map
Loading sold comps map…
Walkable amenities ~0.75 mi
Loading nearby amenities…
Taxation est. · year 1
- Rental income
- $17,746
- − Mortgage interest
- −$9,243
- − Property taxes
- −$2,084
- − Insurance
- −$825
- − Repairs & maintenance
- −$1,420
- − Management
- −$1,420
- − Depreciation
- −$4,800
- Taxable loss
- −$2,045
- Est. tax savings @ 24.0%
- +$491
- After-tax cash flow
- $1,217/yr
For passive investors: Depreciation is non-cash, so a rental often shows a tax loss while cash-flowing — sheltering income. Rental losses are passive: they offset passive income freely, and up to $25,000/yr can offset ordinary (W-2) income if you actively participate and your MAGI is under $100k (phasing out to $0 by $150k); unused losses carry forward. On sale, claimed depreciation is recaptured at up to 25%, and gains may owe capital-gains tax (a 1031 exchange can defer both). Figures are a year-1 estimate at your 24.0% rate — not tax advice; consult a CPA.
Schools (NCES district)
- District
- Indianapolis Public Schools
- NCES district ID
- 1804770
- Math proficiency
- 14% ▼ -7.00%
- Reading proficiency
- 20% ▼ -3.00%
- Median HH income
- $32,034
- Composite
- 13.69/100
- National rank
- #9499
- State rank
- #286 of 301 in IN
Livability — Indianapolis city (balance)
No livability data for this city. (Only ~50 U.S. cities are tracked.)
Census & demographics
- Census place
- Indianapolis city (balance), IN
- County
- Marion County · 998,460 people
- City population
- 881,119
- Metro
- Indianapolis-Carmel-Anderson, IN
- Population (ZIP)
- 29,360
- Household income
- $38,063
- Rent vs Own
- Severe rent burden
- 2340.0
Population outlook (Marion County) Hauer SSP2
- Today (2025)
- 1,025,572 people
- By 2030
- 1,065,727 · +3.9%
- By 2040
- 1,141,577 · +11.3%
- By 2050
- 1,208,920 · +17.9%
- By 2075
- 1,367,288 · +33.3%
- By 2100
- 1,438,201 · +40.2%
Race, ethnicity, and origin ACS 2023
- Neighborhood character
- Predominantly Black (68%)
- Race & ethnicity
- Black 68% White 18% Hispanic / Latino 9% Two or more races 6%
- Hispanic origin (detail)
- Mexican 6%
- Common ancestry
- Romanian 1%
- Foreign-born
- 5% · Canada, Philippines
- Languages at home
- 92% English-only · Spanish 7%
Political lean MEDSL · Marion
- 2024 margin
- Strong D (+27.7) · D 63.0% · R 35.3% · Other 1.7%
- 2008→2024 swing
- -0.7pp no change · 2008: 28.4pp · 2024: 27.7pp
- All cycles
- 2024: D+27.7 2020: D+29.1 2016: D+22.8 2012: D+22.2 2008: D+28.4
Not yet ingested
- Civics
- —
Market trends
- HPI YoY
- ▼ -81.57%
- Current HPI
- 395.7071
- Rent YoY
- ▲ 0.81%
- Metro
- Indianapolis-Carmel-Anderson, IN
- State GDP YoY
- ▲ 2.90%
- F500 in state
- 18
Industry mix (Fortune 500 HQ in IN)
| Industry | F500 HQs | Revenue |
|---|---|---|
| Industrial Machinery | 2 | $37B |
|
||
| Healthcare | 1 | $177B |
|
||
| Pharmaceuticals | 1 | $45B |
|
||
| Metals / Steel | 1 | $18B |
|
||
| Agriculture | 1 | $17B |
|
||
| Packaging | 1 | $12B |
|
||
Price history
+267.5% since first listed16 events — show timeline
- 2026-04-02 Listed $165,000 MIBOR as Distributed by MLS Grid
- 2026-03-17 Listing Removed — MIBOR as Distributed by MLS Grid
- 2026-01-21 Price Changed $185,000 MIBOR as Distributed by MLS Grid
- 2025-11-17 Price Changed $190,000 MIBOR as Distributed by MLS Grid
- 2025-10-28 Price Changed $200,000 MIBOR as Distributed by MLS Grid
- 2025-10-16 Price Changed $205,000 MIBOR as Distributed by MLS Grid
- 2025-10-06 Listed $209,900 MIBOR as Distributed by MLS Grid
- 2023-07-13 Sold (MLS) $172,500 MIBOR as Distributed by MLS Grid
- 2023-06-11 Pending — MIBOR as Distributed by MLS Grid
- 2023-06-01 Listed $175,000 MIBOR as Distributed by MLS Grid
- 2023-03-27 Sold (MLS) $95,000 MIBOR as Distributed by MLS Grid
- 2023-02-28 Pending — MIBOR as Distributed by MLS Grid
- 2023-02-23 Listed $95,000 MIBOR as Distributed by MLS Grid
- 2016-11-09 Listing Removed — MIBOR as Distributed by MLS Grid
- 2016-07-05 Price Changed $43,900 MIBOR as Distributed by MLS Grid
- 2016-05-10 Listed $44,900 MIBOR as Distributed by MLS Grid
Property tax history
+16.2%/yrLatest (2025): $2,084 · +3.1% YoY. Source: county tax records.
Cash-flow waterfall
monthlySold comps — $/sqft
last 12 mo · ≤1 miLoading sold comps…