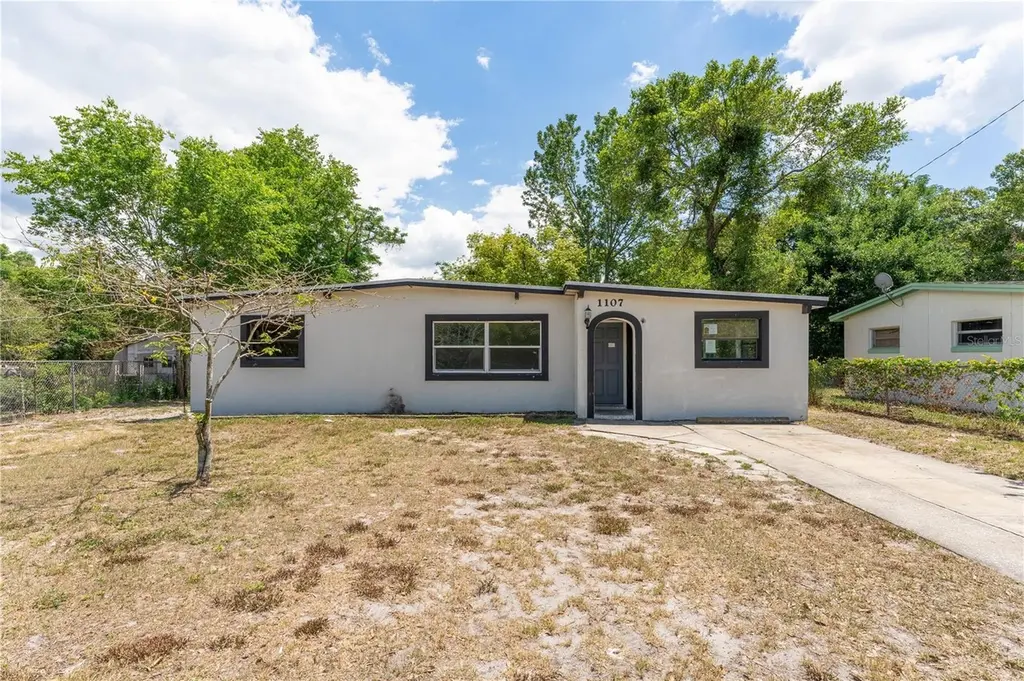
1107 Kimball Dr · Ocoee, FL
Flood risk 1/10 · Minimal
- FEMA flood zone
- X (unshaded)
- Chance of flooding over 30 yrs
- 0.0%
- Est. flood insurance / yr
- $507 – $1,088
Fire risk 3/10 · Minor
- Est. fire insurance / yr
- $947 – $1,759
Heat risk 8/10 · Major
- Hot days now (above 108°F)
- 7 days/yr
- Hot days in 30 yrs
- 23 days/yr
Wind risk 9/10 · Severe
- Chance of severe wind over 30 yrs
- 99.0%
Air-quality risk 1/10 · Minimal
- Unhealthy air days now
- 0 days/yr
- Unhealthy air days in 30 yrs
- 0 days/yr
Risk factors via First Street. Map © Google.
Why this score? — see what drove the D+ grade
The composite is a weighted blend of 9 inputs, each scored 0–100. Each bar is that input's sub-score; the figure is the points it added to the 100-point composite (weight × sub-score).
- Cash flow +13.4/30.0
- ARV discount +12.7/15.0
- Schools +4.1/10.0
- DSCR +4.0/10.0
- 1% rule +3.7/10.0
- Livability +3.3/5.0
- Rent growth +2.8/5.0
- Condition / age +2.5/5.0
- Appreciation +0.0/10.0
$240,000
🖨 Deal sheet (PDF) 📄 Offer letter ✓ Due diligence
Listing remarks
Welcome! This two-bedroom, one-bathroom home presents an excellent opportunity in the heart of Ocoee. Inside features vaulted ceilings, with a spacious living area and bedrooms, and a dedicated den/study, providing a versatile home fit for life’s ever-changing needs. Its private backyard adds to the versatility, offering a lovely outdoor space prime for relaxing or entertaining. The location offers exceptional convenience with proximity to schools, local shopping and dining options, highway access, and a variety of recreation activities, including Forest Lake Golf Club, Jim Beech Recreation Center, and numerous parks, placing everyday needs and entertainment activities just moments aw
Key facts
- 8,296 sq ft lot
- Built 1959
- Listed 52 days
Property features AI
Finance
- Other: Zoned R-1; Total living area approximately 1,051 square feet; Total building area approximately 1,126 square feet
- Financial info: No lease restrictions; Unfurnished
- HOA & community: No HOA; Pets allowed
Exterior
- Parking: No parking details provided
- Security: No security features listed
- Utilities: Public water; Septic tank sewer; Electricity available; Water service available
- Home design: Single family residence; Residential property; One story; Faces northwest; Entry on main level
- Construction: Block and stucco construction; Shingle roof; Slab foundation; Built on a 0.19-acre lot
- Exterior features: Sidewalk; Landscaped lot; Paved surfaces
Interior
- Kitchen: No appliances included
- Bedrooms: 2 bedrooms
- Flooring: Tile flooring
- Bathrooms: 1 full bathroom
- Heating & cooling: Central heating (electric); Central air conditioning
- Interior features: Living room and dining room combo; 6 total rooms
- Laundry & utility: Laundry room
Neighborhood map
What this means for you Summary
Snapshot
- This is a 3-bed/1.0-bath single-family listed at $240k.
Deal economics
- At list price, monthly cash flow is $5 ($61/yr) — positive.
- The deal already cash-flows at list — no discount required.
- To meet the 1% rule (rent ≥ 1% of price), the offer needs to be $209k (12.9% below list).
- Recommended offer: $209k (12.9% below list) — sets the bar for 1% rule.
- Cap rate 6.3% vs local median 3.6% in Ocoee — top-decile yield for the area; either an underpriced asset or a hidden risk that comps aren't pricing in. Stress-test before assuming the spread holds.
Location & tenants
- Location reads 66/100 on livability (#602 in FL) — a middle-class / working-renter tenant base. Strengths: housing A+, crime A-, employment A-; Watch: amenities F, commute F, health & safety F.
- Orange (suburban): math 46% / reading 51% proficiency, ranked #43 of 73 in FL (top 59%) — families likely to look elsewhere, expect single-tenant / working-renter base with shorter leases.
- Zoned schools: Spring Lake Elementary (math 45% / reading 52%, grade D, #1,152 of 2,144 statewide, top 55%, 442 students, 72% FRL); Ocoee High (math 17% / reading 38%, grade F, #470 of 667 statewide, top 71%, 2,536 students, 50% FRL) — zoned schools at 61% FRL track the district average.
- Market conditions: Rents rising (+1.0%/yr); 351 active listings in the ZIP; 12 comparable units currently listed for rent nearby; rentals at typical pace (median 21d on market — plan ~3-4 weeks tenant-placement turnaround); solid renter incomes; 8,053 units permitted in Orange County in 2024 (3,133 in 5+ unit buildings).
Forward outlook
- Local home prices are declining (-3.0%/yr); year-one equity from $2k of loan paydown is wiped out by about $7k of value loss. Plan a longer hold.
- Orange County population projected at +52% by 2050 — long-run rental-demand tailwind backs the buy-and-hold thesis.
Negotiation context
- It's been on market 52 days — a 3% lower offer ($233k) is reasonable based on typical stale-listing flexibility.
- 3 sale attempts since 13y ago with the ask held roughly flat each time — persistent listings suggest the price (not the market) is what's stuck; bring a comps-based counter.
- Current owner paid $82k; list at $240k implies a 193% gain — meaningful room to come down on a strong offer.
Risks & watch-outs
- Watch-outs: built in 1959 — expect roof / HVAC / electrical / plumbing capex.
- Climate carrying-cost: severe wind risk, 99% chance of damaging wind over 30y; extreme-heat days projected 7→23/yr by 2055 (HVAC capex compounding) — expect insurance premiums to compound above CPI over the hold.
Questions for the listing agent
- It's been on market 52 days. Have you received any prior offers? Is the seller open to a 13% concession, seller financing, or rate buy-down credit?
- Built in 1959 — when were the roof, HVAC, electrical panel, plumbing, and water heater last replaced?
- Is there a deadline driving the sale (1031 exchange, divorce, estate, relocation)? That informs how much negotiation room exists.
- The area grade is low — what's the realistic commute time and amenity access for the typical tenant pool here? Any planned neighborhood developments (good or bad) we should know about?
- What's the average days-on-market for RENTAL listings here right now (not sales)? A rising rental-DOM trend means longer vacancies and softer asking-rent achievability than the comps imply.
- What's the recent tenant-quality profile in this submarket — average credit score on applications, eviction rate, late-payment / NSF rate, and stable-employment percentage? A property-management company in the area should have these aggregated.
- How much new for-sale + rental construction is in the pipeline within 1–3 miles? Heavy new supply typically softens prices + rents 12–24 months out; constrained supply supports both.
Investment metrics
- 1% rule
- 0.87% ✗
- Cap rate
- 6.32%
- Cash-on-cash
- 0.09%
- DSCR
- 1.00
- GRM
- 9.6
CMA / ARV
- ARV (on-the-fly)
- $271,158
- Comps found
- 12
Show comp detail 12 sales within ~0.75 mi
| Address | Dist | Beds/Ba | Sqft | Sold | Price | $/sf | Match |
|---|---|---|---|---|---|---|---|
| 405 Caballero Rd | 0.57mi | 3/1.0 | 1,025 (-2%) | 2mo | $192,000 | $187 | 68 |
| 1909 Lauren Beth Ave | 0.64mi | 3/1.0 | 1,000 (-5%) | 2mo | $298,900 | $299 | 60 |
| 1402 Samantha St | 0.38mi | 3/2.0 | 1,050 (-0%) | 23mo | $306,000 | $291 | 59 |
| 911 Ursula St | 0.52mi | 3/2.0 | 1,075 (+2%) | 12mo | $265,000 | $247 | 58 |
| 1405 Snowden St | 0.58mi | 3/2.0 | 1,124 (+7%) | 3mo | $290,000 | $258 | 55 |
| 1906 Jessica Lea Ln | 0.65mi | 3/2.0 | 1,066 (+1%) | 10mo | $266,000 | $250 | 55 |
| 1006 Idaho Ct | 0.45mi | 2/1.0 (-1) | 1,008 (-4%) | 16mo | $240,000 | $238 | 54 |
| 624 Cardinal St | 0.56mi | 2/1.0 (-1) | 1,002 (-5%) | 12mo | $228,500 | $228 | 51 |
| 1604 Starfire Ln | 0.47mi | 3/2.0 | 1,102 (+5%) | 18mo | $316,000 | $287 | 51 |
| 1009 Arizona Ct | 0.47mi | 2/1.0 (-1) | 1,008 (-4%) | 20mo | $278,000 | $276 | 50 |
| 1907 Jessica Lea Ln | 0.64mi | 2/1.0 (-1) | 1,008 (-4%) | 15mo | $295,000 | $293 | 46 |
| 708 Snowden St | 0.50mi | 2/1.0 (-1) | 897 (-15%) | 7mo | $188,500 | $210 | 41 |
Match score weights: distance 35% · size 25% · config 20% · recency 20%. Top-matched comps best support the ARV.
Projected returns pro-forma
-3.0% appreciation · 1.04% rent growth · sell at horizon
- IRR
- -18.4%
- Equity multiple
- 0.37×
- Total profit
- $-42,586
- Equity at exit
- $35,785
- IRR
- -15.0%
- Equity multiple
- 0.22×
- Total profit
- $-52,519
- Equity at exit
- $20,751
Cash invested: $67,200 (down + closing). Projections, not guarantees.
Landlord ↔ Tenant lean methodology
- Overall (STATE)
- 87 Strongly Landlord-Friendly
- State Florida
- 87 Strongly Landlord-Friendly · R+3
- County
- — inherits STATE
- City
- — inherits STATE
ZIP-level market 34761
- Home prices YoY
- -28.3%
- Rents YoY
- 1.0%
- Active inventory
- 351
- Price-to-rent
- 9.6×
Monthly cashflow live
- Estimated rent
- $2,090 high interval (Pro) →
- Mortgage (P&I)
- −$1,259
- Tax from tax record
- −$288 /mo · $3,450/yr
- Insurance
- −$100
- HOA
- −$0
- Vacancy / Maint / Mgmt
- −$439
- Net cashflow
- $5
Break-even live
Sensitivity live
| Price | -10% $141 | -5% $73 | +0% $5 | +5% $-63 | +10% $-131 |
|---|---|---|---|---|---|
| Rent | -10% $-160 | -5% $-77 | +0% $5 | +5% $88 | +10% $170 |
| Rate | -1.0pp $126 | -0.5pp $66 | base $5 | +0.5pp $-57 | +1.0pp $-120 |
UW: 25.0% down · 7.5% · 30yr · 1.5% tax · 5.0% vac · 8.0% maint · 8.0% mgmt
Financing live
Cash to close
- Down payment
- $60,000
- Closing costs
- $7,200
- Reserves months
- —
- Total cash needed
- —
Loan-product check · same deal, 3 products live
Conventional
25% down · 7.5% · 30yr
- Down + closing
- —
- Monthly P&I
- —
- Monthly cashflow
- —
- DSCR
- —
- Eligible?
- —
Personal DTI + credit; lowest rate.
DSCR
20% down · 8.5% · 30yr
- Down + closing
- —
- Monthly P&I
- —
- Monthly cashflow
- —
- DSCR
- —
- Eligible?
- —
No personal income docs; deal must DSCR.
Hard money
10% down · 12.0% · 12mo
- Down + closing
- —
- Monthly P&I
- —
- Monthly cashflow
- —
- DSCR
- —
- Eligible?
- —
Short-term bridge; refi at stabilization.
Rent comps 12 comps
| Address | Beds | Baths | Sqft | Rent | $/sqft | DOM | Units | Dist |
|---|---|---|---|---|---|---|---|---|
| 1204 Sandy Beach Rd Ocoee, FL | 3.0 | 2.0 | 1380 | $2,175 | $1.58 | 8d | 1 | 0.32mi |
| 1013 Arizona Ct Ocoee, FL | 3.0 | 2.0 | 1108 | $1,850 | $1.67 | 5d | 1 | 0.47mi |
| 2007 Shari Lynn Ter Ocoee, FL | 3.0 | 2.0 | 1378 | $2,175 | $1.58 | 5d | 1 | 0.75mi |
| 1903 Brancaster Cir Ocoee, FL | 2.0 | 2.5 | 1275 | $1,900 | $1.49 | 13d | 1 | 1.00mi |
| 224 10th Ave Ocoee, FL | 3.0 | 1.0 | 1500 | $1,500 | $1.00 | 24d | 1 | 1.01mi |
| 10536 3rd Ave Ocoee, FL | 3.0 | 2.0 | 1425 | $2,040 | $1.43 | 21d | 1 | 1.07mi |
| 611 N Lakewood Ave Ocoee, FL | 2.0 | 1.0 | 944 | $800 | $0.85 | 24d | 1 | 1.08mi |
| 114 Parker Cove Ct Ocoee, FL | 3.0 | 2.0 | 1425 | $2,115 | $1.48 | 24d | 1 | 1.15mi |
| 772 Olympic Cir Unit H2 Ocoee, FL | 3.0 | 2.0 | 1401 | $1,995 | $1.42 | 13d | 1 | 1.30mi |
| 763 Olympic Cir Ocoee, FL | 3.0 | 2.0 | 1401 | $2,200 | $1.57 | 24d | 1 | 1.32mi |
| 611 Olympic Dr Unit B Ocoee, FL | 2.0 | 2.0 | 1493 | $1,770 | $1.19 | 5d | 1 | 1.41mi |
| 1512 Prairie Lake Blvd Ocoee, FL | 3.0 | 2.0 | 1340 | $2,100 | $1.57 | 22d | 1 | 1.50mi |
Listing history 21 events
-
2026-06-18days on market $240,000 Active 52 DOM
-
2026-06-17price $240,000 Active 51 DOM
-
2026-06-17days on market $250,000 Active 51 DOM
-
2026-06-16days on market $250,000 Active 50 DOM
-
2026-06-15days on market $250,000 Active 49 DOM
-
2026-06-13days on market $250,000 Active 47 DOM
-
2026-06-13days on market $250,000 Active 46 DOM
-
2026-06-09days on market $250,000 Active 43 DOM
-
2026-06-08days on market $250,000 Active 42 DOM
-
2026-06-07days on market $250,000 Active 41 DOM
-
2026-06-04days on market $250,000 Active 38 DOM
-
2026-06-03days on market $250,000 Active 37 DOM
-
2026-06-02days on market $250,000 Active 36 DOM
-
2026-06-02days on market $250,000 Active 35 DOM
-
2026-05-31days on market $250,000 Active 34 DOM
-
2026-04-27$250,000 Active
-
2022-02-09$124,000 Active
-
2013-10-17historical
-
2013-05-16$50,000
-
2002-08-14soldstatus $82,000
-
1991-09-01soldstatus $57,000
ⓘ Source: listings_history table (triggers on properties + properties_extension) + one-shot
backfill from property_details.listing_events for pre-trigger history.
Tax reassessment forecast FL · Resets to sale price
- Current annual tax
- $3,450 · $288/mo
- Projected year-2 tax
- $3,450 · $288/mo
- Expected delta
- $0/yr ($0/mo · 0.0%)
ⓘ Screening estimate from a state-policy table — verify with the county assessor before closing.
Climate risk First Street
- Flood 1/10 Low FEMA zone X (unshaded) · 0% chance over 30 yrs
- Wildfire 3/10 Moderate
- Heat 8/10 Severe 7 d/yr ≥108°F today · 23 d/yr by 30 yrs out
- Wind 9/10 Extreme 99% chance of damaging wind over 30 yrs
- Air quality 1/10 Low 0 unhealthy d/yr today · 0 by 30 yrs out
Nearby sold comps map
Loading sold comps map…
Walkable amenities ~0.75 mi
Loading nearby amenities…
Taxation est. · year 1
- Rental income
- $25,082
- − Mortgage interest
- −$13,444
- − Property taxes
- −$3,450
- − Insurance
- −$1,200
- − Repairs & maintenance
- −$2,007
- − Management
- −$2,007
- − Depreciation
- −$6,982
- Taxable loss
- −$4,007
- Est. tax savings @ 24.0%
- +$962
- After-tax cash flow
- $1,023/yr
For passive investors: Depreciation is non-cash, so a rental often shows a tax loss while cash-flowing — sheltering income. Rental losses are passive: they offset passive income freely, and up to $25,000/yr can offset ordinary (W-2) income if you actively participate and your MAGI is under $100k (phasing out to $0 by $150k); unused losses carry forward. On sale, claimed depreciation is recaptured at up to 25%, and gains may owe capital-gains tax (a 1031 exchange can defer both). Figures are a year-1 estimate at your 24.0% rate — not tax advice; consult a CPA.
Schools (NCES district)
- District
- Orange
- NCES district ID
- 1201440
- Math proficiency
- 46% ▼ -9.00%
- Reading proficiency
- 51% ▼ -2.00%
- Median HH income
- $49,350
- Composite
- 41.47/100
- National rank
- #3461
- State rank
- #43 of 73 in FL
Livability — Ocoee
- Score
- 66/100
- State rank
- #602
- US rank
- #11554
Category grades
Schools grade is shown separately in the Schools card above.
Census & demographics
- Census place
- Ocoee, FL
- County
- Orange County · 1,471,359 people
- City population
- 47,327
- Metro
- Orlando-Kissimmee-Sanford, FL
- Population (ZIP)
- 47,327
- Household income
- $96,415
- Rent vs Own
- Severe rent burden
- 1197.0
Population outlook (Orange County) Hauer SSP2
- Today (2025)
- 1,618,226 people
- By 2030
- 1,787,404 · +10.5%
- By 2040
- 2,125,621 · +31.4%
- By 2050
- 2,454,016 · +51.6%
- By 2075
- 3,173,711 · +96.1%
- By 2100
- 3,607,781 · +122.9%
Race, ethnicity, and origin ACS 2023
- Neighborhood character
- Highly diverse neighborhood (Simpson 0.72)
- Race & ethnicity
- White 39% Hispanic / Latino 29% Black 19% Two or more races 13% Asian 5%
- Hispanic origin (detail)
- Mexican 8% Puerto Rican 8% Cuban 2% Dominican 1%
- Common ancestry
- Hispanic 2% Romanian 2% German 2%
- Foreign-born
- 22% · Canada, China, Vietnam
- Languages at home
- 72% English-only · Spanish 19% Other Indo-European 2% French/Haitian/Cajun 2%
Political lean MEDSL · Orange
- 2024 margin
- D (+13.6) · D 56.1% · R 42.5% · Other 1.3%
- 2008→2024 swing
- -5.0pp toward R · 2008: 18.6pp · 2024: 13.6pp
- All cycles
- 2024: D+13.6 2020: D+23.1 2016: D+24.6 2012: D+18.2 2008: D+18.6
Not yet ingested
- Civics
- —
Market trends
- HPI YoY
- ▼ -114.83%
- Current HPI
- 290.5598
- Rent YoY
- ▲ 1.04%
- Metro
- Orlando-Kissimmee-Sanford, FL
- State GDP YoY
- ▲ 3.28%
- F500 in state
- 36
Industry mix (Fortune 500 HQ in FL)
| Industry | F500 HQs | Revenue |
|---|---|---|
| Industrial Technology | 2 | $29B |
|
||
| Insurance | 2 | $17B |
|
||
| Retail | 1 | $60B |
|
||
| Technology Distribution | 1 | $58B |
|
||
| Homebuilding | 1 | $35B |
|
||
| Technology Manufacturing | 1 | $35B |
|
||
Price history
+338.6% since first listed6 events — show timeline
- 2026-04-27 Listed $250,000 Stellar MLS as Distributed by MLS Grid
- 2022-02-09 Listed $124,000 Stellar MLS as Distributed by MLS Grid
- 2013-10-17 Listing Removed — Stellar MLS as Distributed by MLS Grid
- 2013-05-16 Listed $50,000 Stellar MLS as Distributed by MLS Grid
- 2002-08-14 Sold (Public Records) $82,000 Public Records
- 1991-09-01 Sold (Public Records) $57,000 Public Records
Property tax history
+9.2%/yrLatest (2025): $3,450 · +5.2% YoY. Source: county tax records.
Cash-flow waterfall
monthlySold comps — $/sqft
last 12 mo · ≤1 miLoading sold comps…