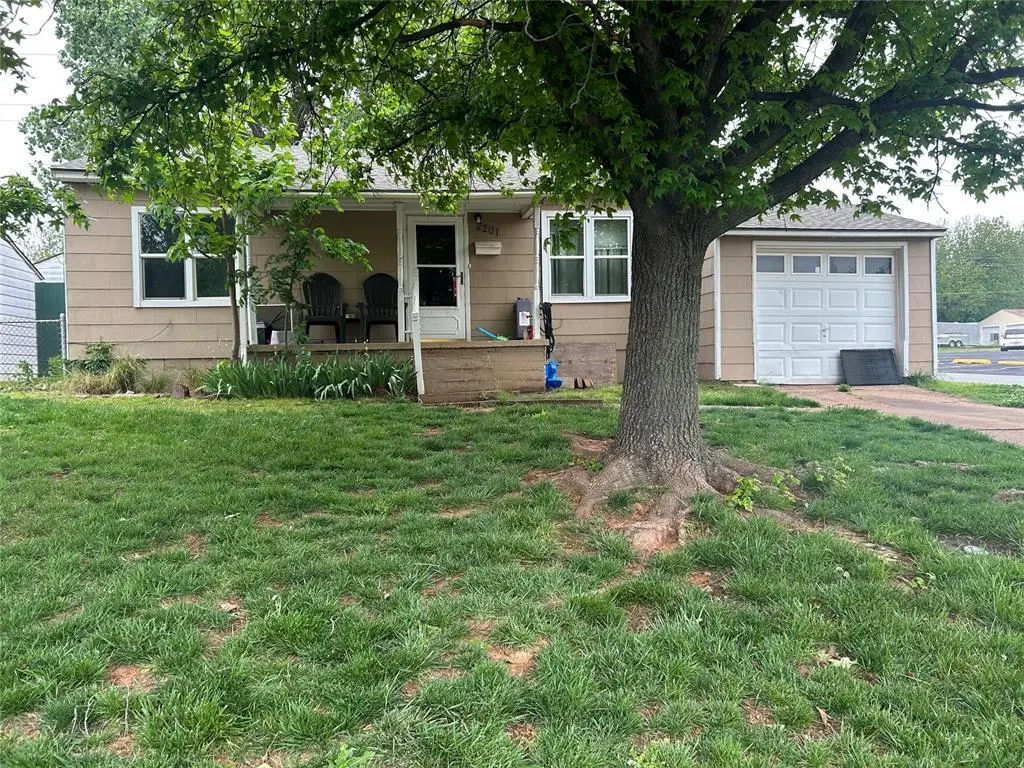
2201 Doris Ave · Del City, OK
Flood risk 1/10 · Minimal
- FEMA flood zone
- X (unshaded)
- Chance of flooding over 30 yrs
- 0.0%
- Est. flood insurance / yr
- $507 – $1,088
Fire risk 1/10 · Minimal
- Est. fire insurance / yr
- $2,463 – $4,575
Heat risk 5/10 · Moderate
- Hot days now (above 107°F)
- 7 days/yr
- Hot days in 30 yrs
- 19 days/yr
Wind risk 2/10 · Minimal
- Chance of severe wind over 30 yrs
- 4.0%
Air-quality risk 2/10 · Minimal
- Unhealthy air days now
- 1 days/yr
- Unhealthy air days in 30 yrs
- 3 days/yr
Risk factors via First Street. Map © Google.
Why this score? — see what drove the B grade
The composite is a weighted blend of 9 inputs, each scored 0–100. Each bar is that input's sub-score; the figure is the points it added to the 100-point composite (weight × sub-score).
- Cash flow +30.0/30.0
- ARV discount +15.0/15.0
- DSCR +10.0/10.0
- 1% rule +8.7/10.0
- Livability +3.2/5.0
- Rent growth +2.8/5.0
- Condition / age +2.5/5.0
- Schools +1.2/10.0
- Appreciation +0.0/10.0
$85,000
🖨 Deal sheet 📄 Offer letter ✓ Due diligence
Listing remarks MLS
Close to everything whether it's school or work this cute little 3 bedroom, on a spacious corner lot, is within close distance. Minutes away from Tinker, or downtown Oklahoma City. Schedule your showing as this one won't last long.
Key facts
- 6,625 sq ft lot
- Garage
- Built 1948
Property features AI
Finance
- Other: Lender approval / Short Sale may affect sale conditions; Occupied; Directions available from S. Sunnylane Rd to SE 22nd St to Doris Ave
- Financial info: Not assumable
- HOA & community: No mandatory association dues
Exterior
- Parking: 1-car garage
- Utilities: No storm shelter
- Home design: Single family residence; One story; Residential property; Located in Epperly Heights Subdivision; Homestead eligible
- Construction: Shingle roof; Other construction materials; Built (existing)
- Exterior features: Corner lot; No additional exterior features listed
Interior
- Kitchen: Range (2-burner?)
- Bedrooms: 3 bedrooms (single-level)
- Bathrooms: 2 full bathrooms
- Heating & cooling: Other heating; Other cooling
- Interior features: One living area; No fireplace; Existing property
- Laundry & utility: Conventional foundation
Neighborhood map
What this means for you Summary
Snapshot
- This is a 3-bed/1.0-bath single-family listed at $85k.
Deal economics
- At list price, monthly cash flow is $345 ($4k/yr) — positive.
- The deal already cash-flows at list — no discount required.
- Meets the 1% rule at list price ($1k rent vs $85k).
- Cap rate 11.2% vs local median 5.9% in Del City — top-decile yield for the area; either an underpriced asset or a hidden risk that comps aren't pricing in. Stress-test before assuming the spread holds.
Location & tenants
- Location reads 64/100 on livability (#180 in OK) — a middle-class / working-renter tenant base. Strengths: cost of living A+, housing A+; Watch: health & safety C-, amenities D, crime F.
- Midwest City-Del City (suburban): math 10% / reading 17% proficiency, ranked #231 of 270 in OK (top 86%) — low school quality limits family demand, transient renter base, plan for 1-2y turnover.
- Zoned schools: Del City Es (math 8% / reading 12%, grade F, #711 of 845 statewide, top 87%, 523 students, 0% FRL); Del City Hs (math 5% / reading 15%, grade F, #361 of 447 statewide, top 94%, 1,158 students, 0% FRL) — zoned schools average 0% FRL vs 57% district-wide (57 pts lower); this property's tenant base skews higher-income than the district average.
- Market conditions: Rents rising (+1.3%/yr); 119 active listings in the ZIP; 27 comparable units currently listed for rent nearby; rentals leasing fast (median 12d on market — plan ~1-2 weeks tenant-placement turnaround); 5,365 units permitted in Oklahoma County in 2024 (569 in 5+ unit buildings).
Forward outlook
- Local home prices are declining (-3.0%/yr); year-one equity from $588 of loan paydown is wiped out by about $3k of value loss. Plan a longer hold.
- Oklahoma County population projected at +41% by 2050 — long-run rental-demand tailwind backs the buy-and-hold thesis.
- At projected returns (-3.0% appreciation + 1.3% rent growth), your $24k cash investment doubles in ~9 years — after that, you're playing with house money.
Negotiation context
- Only 5 days on market — expect competitive offers; lowballing is unlikely to land.
- 5 sale attempts since 22y ago; this cycle's ask has dropped $40k (32%) from the opening price — seller is motivated, your offer sets the floor, not the list.
Risks & watch-outs
- Watch-outs: built in 1948 — expect roof / HVAC / electrical / plumbing capex.
- Climate carrying-cost: extreme-heat days projected 7→19/yr by 2055 (HVAC capex compounding) — expect insurance premiums to compound above CPI over the hold.
Questions for the listing agent
- Built in 1948 — when were the roof, HVAC, electrical panel, plumbing, and water heater last replaced?
- Is there a deadline driving the sale (1031 exchange, divorce, estate, relocation)? That informs how much negotiation room exists.
- Schools are F-rated, which usually means shorter tenancies and higher turnover. Who's the typical renter profile here, and what's been the actual vacancy rate?
- Crime grade is F in this area — have there been break-ins, vandalism, or insurance claims at this property in the last 3 years? What carrier currently insures it and at what premium?
- What's the average days-on-market for RENTAL listings here right now (not sales)? A rising rental-DOM trend means longer vacancies and softer asking-rent achievability than the comps imply.
- What's the recent tenant-quality profile in this submarket — average credit score on applications, eviction rate, late-payment / NSF rate, and stable-employment percentage? A property-management company in the area should have these aggregated.
- How much new for-sale + rental construction is in the pipeline within 1–3 miles? Heavy new supply typically softens prices + rents 12–24 months out; constrained supply supports both.
Investment metrics
- 1% rule
- 1.37% ✓
- Cap rate
- 11.16%
- Cash-on-cash
- 17.37%
- DSCR
- 1.77
- GRM
- 6.1
CMA / ARV
- ARV (on-the-fly)
- $114,240
- Comps found
- 12
Show comp detail 12 sales within ~0.75 mi
| Address | Dist | Beds/Ba | Sqft | Sold | Price | $/sf | Match |
|---|---|---|---|---|---|---|---|
| 4008 Pine Ave | 0.17mi | 3/1.0 | 1,026 (+7%) | 2mo | $77,500 | $76 | 79 |
| 4036 Pine Ave | 0.13mi | 3/1.0 | 834 (-13%) | 2mo | $70,000 | $84 | 70 |
| 1736 Cherry Ln | 0.50mi | 3/1.0 | 1,025 (+7%) | 0mo | $102,900 | $100 | 65 |
| 4620 SE 21st St | 0.39mi | 3/1.0 | 1,058 (+10%) | 1mo | $110,000 | $104 | 64 |
| 4804 Park Vista Dr | 0.74mi | 3/1.0 | 979 (+2%) | 1mo | $139,000 | $142 | 61 |
| 4624 SE 22nd St | 0.44mi | 3/1.0 | 1,071 (+12%) | 1mo | $130,000 | $121 | 60 |
| 4620 SE 27th St | 0.54mi | 2/1.0 (-1) | 1,017 (+6%) | 0mo | $100,000 | $98 | 60 |
| 4605 SE 20th St | 0.37mi | 2/1.0 (-1) | 1,055 (+10%) | 2mo | $143,000 | $136 | 60 |
| 4404 SE 13th St | 0.63mi | 3/1.0 | 1,026 (+7%) | 2mo | $151,000 | $147 | 58 |
| 4608 SE 23rd St | 0.38mi | 2/1.0 (-1) | 825 (-14%) | 1mo | $90,000 | $109 | 52 |
| 4745 SE 25th St | 0.62mi | 3/2.0 | 1,065 (+11%) | 0mo | $126,500 | $119 | 49 |
| 2512 S Glenn Ave | 0.64mi | 3/1.0 | 836 (-13%) | 1mo | $135,000 | $161 | 48 |
Match score weights: distance 35% · size 25% · config 20% · recency 20%. Top-matched comps best support the ARV.
Projected returns pro-forma
-3.0% appreciation · 1.26% rent growth · sell at horizon
- IRR
- 6.8%
- Equity multiple
- 1.26×
- Total profit
- $6,180
- Equity at exit
- $12,674
- IRR
- 14.6%
- Equity multiple
- 2.08×
- Total profit
- $25,749
- Equity at exit
- $7,349
Cash invested: $23,800 (down + closing). Projections, not guarantees.
Landlord ↔ Tenant lean methodology
- Overall (STATE)
- 83 Strongly Landlord-Friendly
- State Oklahoma
- 83 Strongly Landlord-Friendly · R+20
- County
- — inherits STATE
- City
- — inherits STATE
ZIP-level market 73115
- Home prices YoY
- -20.9%
- Rents YoY
- 1.3%
- Active inventory
- 119
- Price-to-rent
- 6.1×
Monthly cashflow live
- Estimated rent
- $1,163 high interval (Pro) →
- Mortgage (P&I)
- −$446
- Tax from tax record
- −$93 /mo · $1,113/yr
- Insurance
- −$35
- HOA
- −$0
- Vacancy / Maint / Mgmt
- −$244
- Net cashflow
- $345
Break-even live
UW: 25.0% down · 7.5% · 30yr · 1.5% tax · 5.0% vac · 8.0% maint · 8.0% mgmt
Financing live
Cash to close
- Down payment
- $21,250
- Closing costs
- $2,550
- Reserves months
- —
- Total cash needed
- —
Loan-product check · same deal, 3 products live
Conventional
25% down · 7.5% · 30yr
- Down + closing
- —
- Monthly P&I
- —
- Monthly cashflow
- —
- DSCR
- —
- Eligible?
- —
Personal DTI + credit; lowest rate.
DSCR
20% down · 8.5% · 30yr
- Down + closing
- —
- Monthly P&I
- —
- Monthly cashflow
- —
- DSCR
- —
- Eligible?
- —
No personal income docs; deal must DSCR.
Hard money
10% down · 12.0% · 12mo
- Down + closing
- —
- Monthly P&I
- —
- Monthly cashflow
- —
- DSCR
- —
- Eligible?
- —
Short-term bridge; refi at stabilization.
Rent comps 27 comps
| Address | Beds | Baths | Sqft | Rent | $/sqft | DOM | Units | Dist |
|---|---|---|---|---|---|---|---|---|
| 3932 Mallard Dr Oklahoma City, OK | 3.0 | 1.0 | 958 | $950 | $0.99 | 2d | 1 | 0.15mi |
| 3900 Mallard Dr Oklahoma City, OK | 3.0 | 1.0 | 960 | $975 | $1.02 | 16d | 1 | 0.23mi |
| 3928 Teal Dr Oklahoma City, OK | 3.0 | 1.0 | 1033 | $1,200 | $1.16 | 17d | 1 | 0.28mi |
| 1608 Breckenridge Dr Del City, OK | 2.0 | 1.0 | 820 | $1,050 | $1.28 | 2d | 1 | 0.34mi |
| 3812 SE 25th St Del City, OK | 3.0 | 1.0 | 1044 | $1,050 | $1.01 | 23d | 1 | 0.44mi |
| 1700 Karen Dr Oklahoma City, OK | 2.0 | 1.0 | 748 | $950 | $1.27 | 23d | 1 | 0.46mi |
| 4613 SE 27th St Oklahoma City, OK | 2.0 | 1.0 | 768 | $1,050 | $1.37 | 23d | 1 | 0.51mi |
| 4713 SE 23rd St Oklahoma City, OK | 3.0 | 1.0 | 750 | $1,095 | $1.46 | 23d | 1 | 0.52mi |
| 4613 SE 28th St Del City, OK | 3.0 | 1.0 | 1056 | $1,255 | $1.19 | 2d | 1 | 0.55mi |
| 3628 Firethorn Dr Oklahoma City, OK | 3.0 | 1.0 | 968 | $995 | $1.03 | 23d | 1 | 0.58mi |
| 1321 Mallard Dr Oklahoma City, OK | 3.0 | 1.0 | 920 | $1,288 | $1.40 | 23d | 1 | 0.61mi |
| 2312 Mustang St Oklahoma City, OK | 3.0 | 1.5 | 912 | $1,100 | $1.21 | 10d | 1 | 0.62mi |
| 4772 SE 23rd St Oklahoma City, OK | 3.0 | 1.0 | 1044 | $1,300 | $1.25 | 2d | 1 | 0.66mi |
| 4765 SE 25th St Oklahoma City, OK | 2.0 | 1.0 | 864 | $895 | $1.04 | 4d | 1 | 0.67mi |
| 4650 SE 29th St Del City, OK | 2.0 | 1.0 | 1100 | $900 | $0.82 | 23d | 1 | 0.68mi |
| 2333 Becker Pl Del City, OK | 3.0 | 1.0 | 972 | $1,025 | $1.05 | 21d | 1 | 0.71mi |
| 4769 SE 27th St Oklahoma City, OK | 3.0 | 1.0 | 1000 | $1,300 | $1.30 | 23d | 1 | 0.73mi |
| 4340 Woodedge Dr Oklahoma City, OK | 3.0 | 1.0 | 1026 | $1,250 | $1.22 | 2d | 1 | 0.74mi |
| 3204 SE 19th St Oklahoma City, OK | 2.0 | 1.0 | 822 | $1,100 | $1.34 | 4d | 1 | 0.78mi |
| 4741 Ridgeway Dr Oklahoma City, OK | 2.0 | 1.0 | 615 | $850 | $1.38 | 2d | 7 | 0.80mi |
| 4625 Tinker Diagonal Oklahoma City, OK | 2.0 | 2.0 | 900 | $1,050 | $1.17 | 11d | 1 | 0.81mi |
| 3107 SE 21st St Oklahoma City, OK | 2.0 | 1.0 | 720 | $900 | $1.25 | 3d | 1 | 0.87mi |
| 1424 Tanglewood Dr Oklahoma City, OK | 3.0 | 1.0 | 968 | $1,145 | $1.18 | 2d | 1 | 0.91mi |
| 1401 Hampton Dr Oklahoma City, OK | 4.0 | 1.5 | 1032 | $1,150 | $1.11 | 4d | 1 | 0.93mi |
| 3224 SE 24th St Oklahoma City, OK | 3.0 | 1.0 | 1122 | $1,195 | $1.07 | 4d | 1 | 0.94mi |
| 4814 Kristie Dr Oklahoma City, OK | 2.0 | 1.0 | 825 | $895 | $1.08 | 23d | 1 | 1.07mi |
| 4128 SE 43rd St Oklahoma City, OK | 3.0 | 1.0 | 620 | $1,275 | $2.06 | 23d | 1 | 1.41mi |
Listing history 14 events
-
2026-05-17status Pending
-
2026-05-11price $85,000
-
2026-05-11status Active
-
2026-05-08status Pending
-
2026-04-21$125,000 Active
-
2025-05-01historical $1,095
-
2025-04-17$1,095
-
2021-11-08soldstatus $79,500
-
2021-11-05soldstatus $79,500 Sold 232-char remark
Show marketing remark (232 chars)
Close to everything whether it's school or work this cute little 3 bedroom, on a spacious corner lot, is within close distance. Minutes away from Tinker, or downtown Oklahoma City. Schedule your showing as this one won't last long.
-
2021-09-28status Pending 232-char remark
Show marketing remark (232 chars)
Close to everything whether it's school or work this cute little 3 bedroom, on a spacious corner lot, is within close distance. Minutes away from Tinker, or downtown Oklahoma City. Schedule your showing as this one won't last long.
-
2021-09-24$89,500 Active 232-char remark
Show marketing remark (232 chars)
Close to everything whether it's school or work this cute little 3 bedroom, on a spacious corner lot, is within close distance. Minutes away from Tinker, or downtown Oklahoma City. Schedule your showing as this one won't last long.
-
2004-06-02soldstatus $48,000
-
2004-05-28soldstatus $48,000 191-char remark
Show marketing remark (191 chars)
GREAT AREA IN WELL ESTABLISHED NEIGHBOORHOOD CLOSE TO SCHOOLS & SHOPPING. EASY ACCES TO TINKER, GM, OR ROSE STATE!!! HARDWOOD FLOORS THROUGHOUT, STORAGE BLDG, CHAIN LINK FENCED BACK YARD.
-
2004-03-16$42,900 191-char remark
Show marketing remark (191 chars)
GREAT AREA IN WELL ESTABLISHED NEIGHBOORHOOD CLOSE TO SCHOOLS & SHOPPING. EASY ACCES TO TINKER, GM, OR ROSE STATE!!! HARDWOOD FLOORS THROUGHOUT, STORAGE BLDG, CHAIN LINK FENCED BACK YARD.
ⓘ Source: listings_history table (triggers on properties + properties_extension) + one-shot
backfill from property_details.listing_events for pre-trigger history.
Tax reassessment forecast OK · Resets to sale price
- Current annual tax
- $1,113 · $93/mo
- Projected year-2 tax
- $1,113 · $93/mo
- Expected delta
- $0/yr ($0/mo · 0.0%)
ⓘ Screening estimate from a state-policy table — verify with the county assessor before closing.
Climate risk First Street
- Flood 1/10 Low FEMA zone X (unshaded) · 0% chance over 30 yrs
- Wildfire 1/10 Low
- Heat 5/10 Major 7 d/yr ≥107°F today · 19 d/yr by 30 yrs out
- Wind 2/10 Low 4% chance of damaging wind over 30 yrs
- Air quality 2/10 Low 1 unhealthy d/yr today · 3 by 30 yrs out
Nearby sold comps map
Loading sold comps map…
Walkable amenities ~0.75 mi
Loading nearby amenities…
Taxation est. · year 1
- Rental income
- $13,952
- − Mortgage interest
- −$4,761
- − Property taxes
- −$1,113
- − Insurance
- −$425
- − Repairs & maintenance
- −$1,116
- − Management
- −$1,116
- − Depreciation
- −$2,473
- Taxable income
- $2,947
- Est. tax owed @ 24.0%
- −$707
- After-tax cash flow
- $3,427/yr
For passive investors: Depreciation is non-cash, so a rental often shows a tax loss while cash-flowing — sheltering income. Rental losses are passive: they offset passive income freely, and up to $25,000/yr can offset ordinary (W-2) income if you actively participate and your MAGI is under $100k (phasing out to $0 by $150k); unused losses carry forward. On sale, claimed depreciation is recaptured at up to 25%, and gains may owe capital-gains tax (a 1031 exchange can defer both). Figures are a year-1 estimate at your 24.0% rate — not tax advice; consult a CPA.
Schools (NCES district)
- District
- Midwest City-Del City
- NCES district ID
- 4019950
- Math proficiency
- 10% ▼ -11.00%
- Reading proficiency
- 17% ▼ -8.00%
- Median HH income
- $45,724
- Composite
- 12.09/100
- National rank
- #9658
- State rank
- #231 of 270 in OK
Livability — Del City
- Score
- 64/100
- State rank
- #180
- US rank
- #14305
Category grades
Schools grade is shown separately in the Schools card above.
Census & demographics
- Census place
- Del City, OK
- County
- Oklahoma County · 771,644 people
- City population
- 20,225
- Metro
- Oklahoma City, OK
- Population (ZIP)
- 20,225
- Household income
- $46,810
- Rent vs Own
- Severe rent burden
- 965.0
Population outlook (Oklahoma County) Hauer SSP2
- Today (2025)
- 911,875 people
- By 2030
- 982,413 · +7.7%
- By 2040
- 1,130,468 · +24.0%
- By 2050
- 1,288,422 · +41.3%
- By 2075
- 1,711,482 · +87.7%
- By 2100
- 2,088,448 · +129.0%
Race, ethnicity, and origin ACS 2023
- Neighborhood character
- Diverse neighborhood (Simpson 0.69)
- Race & ethnicity
- White 50% Black 19% Hispanic / Latino 15% Two or more races 14% Native American 5% Asian 1%
- Hispanic origin (detail)
- Mexican 11% Puerto Rican 2%
- Common ancestry
- Italian 2% Lithuanian 1% Slovak 1%
- Foreign-born
- 4% · Canada
- Languages at home
- 91% English-only · Spanish 8%
Political lean MEDSL · Oklahoma
- 2024 margin
- Toss-up / Even · D 48.0% · R 49.7% · Other 2.3%
- 2008→2024 swing
- +15.1pp toward D · 2008: -16.8pp · 2024: -1.7pp
- All cycles
- 2024: R+1.7 2020: R+1.1 2016: R+10.5 2012: R+16.7 2008: R+16.8
Not yet ingested
- Civics
- —
Market trends
- HPI YoY
- ▼ -71.80%
- Current HPI
- 271.8383
- Rent YoY
- ▲ 1.26%
- Metro
- Oklahoma City, OK
- State GDP YoY
- ▲ 1.55%
- F500 in state
- 6
Industry mix (Fortune 500 HQ in OK)
| Industry | F500 HQs | Revenue |
|---|---|---|
| Energy | 3 | $48B |
|
||
Price history
+98.1% since first listed14 events — show timeline
- 2026-05-17 Pending — MLSOK
- 2026-05-11 Price Changed $85,000 MLSOK
- 2026-05-11 Relisted — MLSOK
- 2026-05-08 Pending — MLSOK
- 2026-04-21 Listed $125,000 MLSOK
- 2025-05-01 Rental Removed $1,095 MLSOK
- 2025-04-17 Listed for Rent $1,095 MLSOK
- 2021-11-08 Sold (Public Records) $79,500 Public Records
- 2021-11-05 Sold (MLS) $79,500 MLSOK
- 2021-09-28 Pending — MLSOK
- 2021-09-24 Listed $89,500 MLSOK
- 2004-06-02 Sold (Public Records) $48,000 Public Records
- 2004-05-28 Sold (MLS) $48,000 MLSOK
- 2004-03-16 Listed $42,900 MLSOK
Property tax history
+5.9%/yrLatest (2025): $1,113 · +2.8% YoY. Source: county tax records.
Cash-flow waterfall
monthlySold comps — $/sqft
last 12 mo · ≤1 miLoading sold comps…