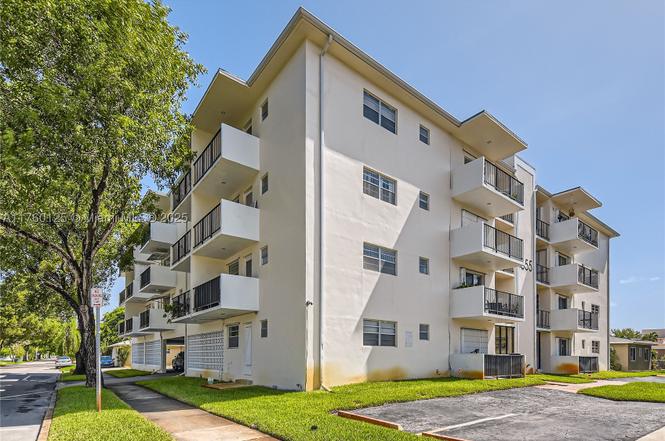
1855 Plunkett St #406 · Hollywood, FL
Flood risk 6/10 · Moderate
- FEMA flood zone
- X (shaded)
- Chance of flooding over 30 yrs
- 0.57%
- Est. flood insurance / yr
- $507 – $1,088
Fire risk 1/10 · Minimal
- Est. fire insurance / yr
- $947 – $1,759
Heat risk 10/10 · Severe
- Hot days now (above 105°F)
- 7 days/yr
- Hot days in 30 yrs
- 27 days/yr
Wind risk 10/10 · Severe
- Chance of severe wind over 30 yrs
- 99.0%
Air-quality risk 2/10 · Minimal
- Unhealthy air days now
- 1 days/yr
- Unhealthy air days in 30 yrs
- 2 days/yr
Risk factors via First Street. Map © Google.
Why this score? — see what drove the D+ grade
The composite is a weighted blend of 9 inputs, each scored 0–100. Each bar is that input's sub-score; the figure is the points it added to the 100-point composite (weight × sub-score).
- Cash flow +15.8/30.0
- 1% rule +8.8/10.0
- ARV discount +7.5/15.0
- DSCR +4.9/10.0
- Schools +4.1/10.0
- Livability +3.8/5.0
- Rent growth +2.6/5.0
- Condition / age +2.5/5.0
- Appreciation +0.0/10.0
$229,000
🖨 Deal sheet (PDF) 📄 Offer letter ✓ Due diligence
Listing remarks MLS
Corner 2 bedroom 2 bathroom with balcony top floor apartment in great condition, fully remodeled kitchen, upgraded with new appliances, titles floors throughout, balcony, and assigned covered parking space. PERFECT LOCATION! Good for investors and also for owner occupants! Buyer have to pay $595 processing fee to Miami Dream Properties at closing - Available for occupancy. Easy to show.
Key facts
- Storage room
- Covered parking
- Walk-in closets
Tags
Property features AI
Finance
- HOA & community: Quarterly association fee; Association fee covers common areas, hot water, insurance, laundry, grounds maintenance, structure maintenance, parking, sewer, trash and water; Building amenities include laundry, trash service and elevators
Exterior
- Parking: Attached carport; Assigned parking; Attached garage with 1 space; One covered space
- Security: Intercom
- Home design: Multi-story building (4 total stories); Unit on 4th floor; Attached property
- Construction: Block construction; Effective year built
- Exterior features: Balcony; Open balcony/patio
Interior
- Kitchen: Electric range; Microwave; Refrigerator
- Bedrooms: Storage room
- Flooring: Tile
- Bathrooms: 2 full bathrooms
- Heating & cooling: Central heating; Central air conditioning
- Interior features: Living/dining room; Walk-in closet(s); Other; Blinds; Impact glass windows; Unfurnished
- Laundry & utility: Common area laundry
Neighborhood map
What this means for you Summary
Snapshot
- This is a 2-bed/2.0-bath condo listed at $229k.
Deal economics
- At list price, monthly cash flow is $104 ($1k/yr) — positive.
- The deal already cash-flows at list — no discount required.
- Meets the 1% rule at list price ($3k rent vs $229k).
- Recommended offer: $202k (12.0% below list) — sets the bar for market timing.
- Cap rate 6.8% vs local median 3.2% in Hollywood — top-decile yield for the area; either an underpriced asset or a hidden risk that comps aren't pricing in. Stress-test before assuming the spread holds.
Location & tenants
- Location reads 76/100 on livability (#232 in FL, #3,548 nationally) — a middle-class / working-renter tenant base. Strengths: commute A+, housing A+, crime B+; Watch: amenities D.
- Broward (suburban): math 42% / reading 53% proficiency, ranked #46 of 73 in FL (top 63%) — families likely to look elsewhere, expect single-tenant / working-renter base with shorter leases.
- Market conditions: Rents flat; 589 active listings in the ZIP; 30 comparable units currently listed for rent nearby; rentals at typical pace (median 16d on market — plan ~3-4 weeks tenant-placement turnaround); 2,111 units permitted in Broward County in 2024 (1,265 in 5+ unit buildings).
- At $3,171/mo this rent would consume 67% of the median local household income ($56k/yr) (locally 3948% of renters already pay >50% of income on rent) — very limited rent-growth headroom before tenants either downsize or default.
Forward outlook
- Local home prices are declining (-3.0%/yr); year-one equity from $2k of loan paydown is wiped out by about $7k of value loss. Plan a longer hold.
- Broward County population projected at +34% by 2050 — long-run rental-demand tailwind backs the buy-and-hold thesis.
Negotiation context
- It's been on market 465 days — a 12% lower offer ($202k) is reasonable based on typical stale-listing flexibility.
- 8 sale attempts since 10y ago with the ask held roughly flat each time — persistent listings suggest the price (not the market) is what's stuck; bring a comps-based counter.
Risks & watch-outs
- Watch-outs: HOA is 23% of rent.
- Climate carrying-cost: major flood risk; severe wind risk, 99% chance of damaging wind over 30y; extreme-heat days projected 7→27/yr by 2055 (HVAC capex compounding) — expect insurance premiums to compound above CPI over the hold.
Questions for the listing agent
- It's been on market 465 days. Have you received any prior offers? Is the seller open to a 12% concession, seller financing, or rate buy-down credit?
- Built in 1966 — when were the roof, HVAC, electrical panel, plumbing, and water heater last replaced?
- What does the HOA fee cover, when was the last increase, and are there any pending special assessments or reserve-fund shortfalls?
- Any open or pending special assessments — roof, HVAC, plumbing, elevator, façade? What's the per-unit balance and payoff schedule, and is the seller paying it off at close or rolling it to the buyer?
- Why hasn't it sold? Are there any deal-killer items the seller is aware of (foundation, flood, title, zoning, code violations)?
- Is there a deadline driving the sale (1031 exchange, divorce, estate, relocation)? That informs how much negotiation room exists.
- The area grade is low — what's the realistic commute time and amenity access for the typical tenant pool here? Any planned neighborhood developments (good or bad) we should know about?
- What's the average days-on-market for RENTAL listings here right now (not sales)? A rising rental-DOM trend means longer vacancies and softer asking-rent achievability than the comps imply.
- What's the recent tenant-quality profile in this submarket — average credit score on applications, eviction rate, late-payment / NSF rate, and stable-employment percentage? A property-management company in the area should have these aggregated.
- How much new apartment / multifamily construction is in the pipeline within 1–3 miles? Heavy new supply (>2% of stock underway) typically softens rents 12–24 months out; light construction supports rent growth.
Investment metrics
- 1% rule
- 1.38% ✓
- Cap rate
- 6.84%
- Cash-on-cash
- 1.95%
- DSCR
- 1.09
- GRM
- 6.0
CMA / ARV
No comps found within radius.
Projected returns pro-forma
-3.0% appreciation · 0.43% rent growth · sell at horizon
- IRR
- -17.3%
- Equity multiple
- 0.41×
- Total profit
- $-37,914
- Equity at exit
- $34,145
- IRR
- -18.6%
- Equity multiple
- 0.17×
- Total profit
- $-53,392
- Equity at exit
- $19,800
Cash invested: $64,120 (down + closing). Projections, not guarantees.
Landlord ↔ Tenant lean methodology
- Overall (STATE)
- 87 Strongly Landlord-Friendly
- State Florida
- 87 Strongly Landlord-Friendly · R+3
- County
- — inherits STATE
- City
- — inherits STATE
ZIP-level market 33020
- Rents YoY
- 0.4%
- Active inventory
- 589
- Price-to-rent
- 6.0×
Monthly cashflow live
- Estimated rent
- $3,171 high interval (Pro) →
- Mortgage (P&I)
- −$1,201
- Tax from tax record
- −$380 /mo · $4,557/yr
- Insurance
- −$95
- HOA
- −$725
- Vacancy / Maint / Mgmt
- −$666
- Net cashflow
- $104
Break-even live
Sensitivity live
| Price | -10% $234 | -5% $169 | +0% $104 | +5% $39 | +10% $-25 |
|---|---|---|---|---|---|
| Rent | -10% $-146 | -5% $-21 | +0% $104 | +5% $229 | +10% $355 |
| Rate | -1.0pp $220 | -0.5pp $162 | base $104 | +0.5pp $45 | +1.0pp $-15 |
UW: 25.0% down · 7.5% · 30yr · 1.5% tax · 5.0% vac · 8.0% maint · 8.0% mgmt
Financing live
Cash to close
- Down payment
- $57,250
- Closing costs
- $6,870
- Reserves months
- —
- Total cash needed
- —
Loan-product check · same deal, 3 products live
Conventional
25% down · 7.5% · 30yr
- Down + closing
- —
- Monthly P&I
- —
- Monthly cashflow
- —
- DSCR
- —
- Eligible?
- —
Personal DTI + credit; lowest rate.
DSCR
20% down · 8.5% · 30yr
- Down + closing
- —
- Monthly P&I
- —
- Monthly cashflow
- —
- DSCR
- —
- Eligible?
- —
No personal income docs; deal must DSCR.
Hard money
10% down · 12.0% · 12mo
- Down + closing
- —
- Monthly P&I
- —
- Monthly cashflow
- —
- DSCR
- —
- Eligible?
- —
Short-term bridge; refi at stabilization.
Rent comps 30 comps
| Address | Beds | Baths | Sqft | Rent | $/sqft | DOM | Units | Dist |
|---|---|---|---|---|---|---|---|---|
| 200 E Pembroke Rd Hallandale Beach, FL | 3.0 | 1.0–2.0 | 1006 | $3,480 | $3.46 | 2d | 62 | 0.37mi |
| 320 S Federal Hwy Hollywood, FL | 2.0 | 1.0–2.0 | 742 | $3,616 | $4.87 | 25d | 9 | 0.55mi |
| 303 S Federal Hwy Hollywood, FL | 1.0–3.0 | 1.0–3.0 | 992 | $2,932 | $2.95 | 3d | 35 | 0.57mi |
| 1770 S Young Cir Hollywood, FL | 2.0 | 1.0–2.0 | 881 | $4,768 | $5.41 | 2d | 42 | 0.62mi |
| 2001 Van Buren St Hollywood, FL | 2.0 | 1.0–2.0 | 788 | $3,599 | $4.57 | 16d | 171 | 0.63mi |
| 906 NE 6th St Hallandale Beach, FL | 3.0 | 2.0 | 1080 | $4,250 | $3.94 | 6d | 1 | 0.67mi |
| 906 NE 6th St Hallandale Beach, FL | 3.0 | 2.0 | 1080 | $4,250 | $3.94 | 25d | 1 | 0.67mi |
| 906 NE 6th St Hallandale Beach, FL | 3.0 | 2.0 | 1080 | $4,250 | $3.94 | 12d | 1 | 0.67mi |
| 1818 Hollywood Blvd Hollywood, FL | 3.0 | 1.0–2.5 | 1089 | $4,135 | $3.80 | 2d | 17 | 0.70mi |
| 401 N Federal Hwy Hallandale Beach, FL | 1.0–3.0 | 1.0–2.0 | 973 | $2,765 | $2.84 | 16d | 48 | 0.77mi |
| 2165 Van Buren St Hollywood, FL | 3.0 | 1.0–3.0 | 1072 | $3,609 | $3.37 | 2d | 14 | 0.78mi |
| 1776 Polk St Hollywood, FL | 1.0–2.0 | 1.0–2.0 | 954 | $3,598 | $3.77 | 16d | 25 | 0.85mi |
| 2233 Hollywood Blvd Hollywood, FL | 1.0–2.0 | 1.0–2.0 | 913 | $3,515 | $3.85 | 16d | 94 | 0.89mi |
| 832 NW 10th St Unit 1 Hallandale Beach, FL | 2.0 | 1.0 | 800 | $1,800 | $2.25 | 25d | 1 | 1.10mi |
| 2750 Washington St Hollywood, FL | 2.0 | 1.0 | 1053 | $3,500 | $3.32 | 15d | 1 | 1.18mi |
| 2750 Washington St Hollywood, FL | 2.0 | 1.0 | 1053 | $3,300 | $3.13 | 3d | 1 | 1.18mi |
| 1180 E Hallandale Beach Blvd Unit 1241877P Hallandale Beach, FL | 1.0–2.0 | 1.0–2.0 | 844 | $5,453 | $6.46 | 4d | 2 | 1.25mi |
| 927 N 17th Ave Unit 1258729P Hollywood, FL | 1.0 | 1.0 | 818 | $5,128 | $6.27 | 17d | 1 | 1.31mi |
| 1046 Foster Rd Hallandale Beach, FL | 2.0 | 1.0 | 750 | $1,795 | $2.39 | 8d | 1 | 1.33mi |
| 1041 NW 7th Ct Unit 2 Hallandale Beach, FL | 1.0 | 1.0 | 600 | $1,550 | $2.58 | 25d | 1 | 1.34mi |
| 101 Diplomat Pkwy Hallandale Beach, FL | 1.0 | 1.0 | 859 | $3,740 | $4.35 | 25d | 1 | 1.36mi |
| 90 SW 3rd St Unit 2400 Hallandale Beach, FL | 2.0 | 2.0 | 1079 | $3,700 | $3.43 | 25d | 1 | 1.36mi |
| 2917 Plunkett St Unit 15C Hollywood, FL | 2.0 | 1.0 | 900 | $1,950 | $2.17 | 8d | 1 | 1.36mi |
| 2915 Plunkett St Unit 10D Hollywood, FL | 1.0 | 1.0 | 640 | $1,700 | $2.66 | 17d | 1 | 1.36mi |
| 215 SE 5th St Hallandale Beach, FL | 2.0–3.0 | 2.0 | 1133 | $2,700 | $2.38 | 25d | 5 | 1.43mi |
| 2918 Jackson St Unit 1 Hollywood, FL | 2.0 | 1.0 | 750 | $1,700 | $2.27 | 8d | 1 | 1.44mi |
| 2918 Jackson St Hollywood, FL | 2.0 | 1.0 | 750 | $1,700 | $2.27 | 4d | 1 | 1.44mi |
| 1012 N 13th Ter Hollywood, FL | 3.0 | 2.0 | 1003 | $6,500 | $6.48 | 25d | 1 | 1.47mi |
| 2806 Taylor St Apt C Hollywood, FL | 2.0 | 2.0 | 650 | $2,295 | $3.53 | 8d | 1 | 1.49mi |
| 2806 Taylor St Apt C Hollywood, FL | 2.0 | 2.0 | 650 | $2,295 | $3.53 | 25d | 1 | 1.49mi |
HOA detail condo
- Monthly dues
- $725 · $8,700/yr
- Assessments
- None detected in remarks — confirm with the listing agent.
Listing history 45 events
-
2026-06-18days on market $229,000 Active 465 DOM
-
2026-06-17days on market $229,000 Active 464 DOM
-
2026-06-16days on market $229,000 Active 463 DOM
-
2026-06-15days on market $229,000 Active 462 DOM
-
2026-06-13days on market $229,000 Active 460 DOM
-
2026-06-09days on market $229,000 Active 456 DOM
-
2026-06-07days on market $229,000 Active 454 DOM
-
2026-06-04days on market $229,000 Active 451 DOM
-
2026-06-03days on market $229,000 Active 450 DOM
-
2026-06-02days on market $229,000 Active 449 DOM
-
2026-06-01days on market $229,000 Active 448 DOM
-
2026-05-31days on market $229,000 Active 447 DOM
-
2025-09-22price $229,000
-
2025-07-18price $234,500
-
2025-03-10$238,500 Active
-
2024-10-23historical $2,100
-
2024-10-06price $2,100
-
2024-09-30price $2,200
-
2024-09-14$2,300
-
2023-09-18historical $2,200
-
2023-09-09price $2,200
-
2023-08-29price $2,300
-
2023-08-17$2,450
-
2022-10-19soldstatus $228,000
-
2022-10-05soldstatus $240,000 Closed 389-char remark
Show marketing remark (389 chars)
Corner 2 bedroom 2 bathroom with balcony top floor apartment in great condition, fully remodeled kitchen, upgraded with new appliances, titles floors throughout, balcony, and assigned covered parking space. PERFECT LOCATION! Good for investors and also for owner occupants! Buyer have to pay $595 processing fee to Miami Dream Properties at closing - Available for occupancy. Easy to show.
-
2022-09-23status Pending 389-char remark
Show marketing remark (389 chars)
Corner 2 bedroom 2 bathroom with balcony top floor apartment in great condition, fully remodeled kitchen, upgraded with new appliances, titles floors throughout, balcony, and assigned covered parking space. PERFECT LOCATION! Good for investors and also for owner occupants! Buyer have to pay $595 processing fee to Miami Dream Properties at closing - Available for occupancy. Easy to show.
-
2022-09-16status Active 389-char remark
Show marketing remark (389 chars)
Corner 2 bedroom 2 bathroom with balcony top floor apartment in great condition, fully remodeled kitchen, upgraded with new appliances, titles floors throughout, balcony, and assigned covered parking space. PERFECT LOCATION! Good for investors and also for owner occupants! Buyer have to pay $595 processing fee to Miami Dream Properties at closing - Available for occupancy. Easy to show.
-
2022-09-15price $240,000 389-char remark
Show marketing remark (389 chars)
Corner 2 bedroom 2 bathroom with balcony top floor apartment in great condition, fully remodeled kitchen, upgraded with new appliances, titles floors throughout, balcony, and assigned covered parking space. PERFECT LOCATION! Good for investors and also for owner occupants! Buyer have to pay $595 processing fee to Miami Dream Properties at closing - Available for occupancy. Easy to show.
-
2022-06-21$230,000 Active 389-char remark
Show marketing remark (389 chars)
Corner 2 bedroom 2 bathroom with balcony top floor apartment in great condition, fully remodeled kitchen, upgraded with new appliances, titles floors throughout, balcony, and assigned covered parking space. PERFECT LOCATION! Good for investors and also for owner occupants! Buyer have to pay $595 processing fee to Miami Dream Properties at closing - Available for occupancy. Easy to show.
-
2022-06-21historical
Show marketing remark (389 chars)
Corner 2 bedroom 2 bathroom with balcony top floor apartment in great condition, fully remodeled kitchen, upgraded with new appliances, titles floors throughout, balcony, and assigned covered parking space. PERFECT LOCATION! Good for investors and also for owner occupants! Buyer have to pay $595 processing fee to Miami Dream Properties at closing - Available for occupancy. Easy to show.
-
2022-06-14price $230,000
-
2022-05-25price $240,000
-
2022-04-08$250,000 Active
-
2017-05-05historical
-
2017-05-04price $144,000
-
2017-02-16$142,000 Active
-
2017-02-15historical
-
2016-08-18price $144,000
-
2016-06-24$149,000 Active
-
2012-12-31soldstatus $45,500
-
2012-12-16soldstatus $45,500
-
2006-01-20soldstatus $175,000
-
2001-04-10soldstatus $61,000
-
1999-05-27soldstatus $44,000
-
1979-11-01soldstatus $38,400
ⓘ Source: listings_history table (triggers on properties + properties_extension) + one-shot
backfill from property_details.listing_events for pre-trigger history.
Tax reassessment forecast FL · Resets to sale price
- Current annual tax
- $4,557 · $380/mo
- Projected year-2 tax
- $4,557 · $380/mo
- Expected delta
- $0/yr ($0/mo · 0.0%)
ⓘ Screening estimate from a state-policy table — verify with the county assessor before closing.
Climate risk First Street
- Flood 6/10 Major FEMA zone X (shaded) · 57% chance over 30 yrs
- Wildfire 1/10 Low
- Heat 10/10 Extreme 7 d/yr ≥105°F today · 27 d/yr by 30 yrs out
- Wind 10/10 Extreme 99% chance of damaging wind over 30 yrs
- Air quality 2/10 Low 1 unhealthy d/yr today · 2 by 30 yrs out
Nearby sold comps map
Loading sold comps map…
Walkable amenities ~0.75 mi
Loading nearby amenities…
Taxation est. · year 1
- Rental income
- $38,055
- − Mortgage interest
- −$12,828
- − Property taxes
- −$4,557
- − Insurance
- −$1,145
- − Repairs & maintenance
- −$3,044
- − Management
- −$3,044
- − HOA
- −$8,700
- − Depreciation
- −$6,662
- Taxable loss
- −$1,925
- Est. tax savings @ 24.0%
- +$462
- After-tax cash flow
- $1,713/yr
For passive investors: Depreciation is non-cash, so a rental often shows a tax loss while cash-flowing — sheltering income. Rental losses are passive: they offset passive income freely, and up to $25,000/yr can offset ordinary (W-2) income if you actively participate and your MAGI is under $100k (phasing out to $0 by $150k); unused losses carry forward. On sale, claimed depreciation is recaptured at up to 25%, and gains may owe capital-gains tax (a 1031 exchange can defer both). Figures are a year-1 estimate at your 24.0% rate — not tax advice; consult a CPA.
Schools (NCES district)
- District
- Broward
- NCES district ID
- 1200180
- Math proficiency
- 42% ▼ -18.00%
- Reading proficiency
- 53% ▼ -5.00%
- Median HH income
- $52,139
- Composite
- 40.88/100
- National rank
- #3621
- State rank
- #46 of 73 in FL
Livability — Hollywood
- Score
- 76/100
- State rank
- #232
- US rank
- #3548
Category grades
Schools grade is shown separately in the Schools card above.
Census & demographics
- Census place
- Hollywood, FL
- County
- Broward County · 1,963,430 people
- City population
- 109,079
- Metro
- Miami-Fort Lauderdale-Pompano Beach, FL
- Population (ZIP)
- 46,322
- Household income
- $56,473
- Rent vs Own
- Severe rent burden
- 3948.0
Population outlook (Broward County) Hauer SSP2
- Today (2025)
- 2,207,033 people
- By 2030
- 2,360,704 · +7.0%
- By 2040
- 2,661,208 · +20.6%
- By 2050
- 2,946,698 · +33.5%
- By 2075
- 3,602,273 · +63.2%
- By 2100
- 3,970,984 · +79.9%
Race, ethnicity, and origin ACS 2023
- Neighborhood character
- Diverse neighborhood (Simpson 0.68)
- Race & ethnicity
- Hispanic / Latino 43% Two or more races 31% White 28% Black 24% Asian 1%
- Hispanic origin (detail)
- Mexican 1% Puerto Rican 4% Cuban 9% Dominican 3% Salvadoran 3%
- Common ancestry
- Hispanic 5% Lithuanian 2% Scotch-Irish 1%
- Foreign-born
- 41% · Canada, Jamaica, Dominican Republic
- Languages at home
- 48% English-only · Spanish 38% French/Haitian/Cajun 6% Russian/Polish/Slavic 2%
Political lean MEDSL · Broward
- 2024 margin
- D (+17.0) · D 58.0% · R 41.0%
- 2008→2024 swing
- -17.8pp toward R · 2008: 34.7pp · 2024: 17.0pp
- All cycles
- 2024: D+17.0 2020: D+29.8 2016: D+35.0 2012: D+34.9 2008: D+34.7
Not yet ingested
- Civics
- —
Market trends
- HPI YoY
- ▼ -406.34%
- Current HPI
- 524.7664
- Rent YoY
- ▲ 0.43%
- Metro
- Miami-Fort Lauderdale-Pompano Beach, FL
- State GDP YoY
- ▲ 3.28%
- F500 in state
- 36
Industry mix (Fortune 500 HQ in FL)
| Industry | F500 HQs | Revenue |
|---|---|---|
| Industrial Technology | 2 | $29B |
|
||
| Insurance | 2 | $17B |
|
||
| Retail | 1 | $60B |
|
||
| Technology Distribution | 1 | $58B |
|
||
| Homebuilding | 1 | $35B |
|
||
| Technology Manufacturing | 1 | $35B |
|
||
Price history
+496.4% since first listed33 events — show timeline
- 2025-09-22 Price Changed $229,000 MARMLS
- 2025-07-18 Price Changed $234,500 MARMLS
- 2025-03-10 Listed $238,500 MARMLS
- 2024-10-23 Rental Removed $2,100 MARMLS
- 2024-10-06 Price Changed $2,100 MARMLS
- 2024-09-30 Price Changed $2,200 MARMLS
- 2024-09-14 Listed for Rent $2,300 MARMLS
- 2023-09-18 Rental Removed $2,200 MARMLS
- 2023-09-09 Price Changed $2,200 MARMLS
- 2023-08-29 Price Changed $2,300 MARMLS
- 2023-08-17 Listed for Rent $2,450 MARMLS
- 2022-10-19 Sold (Public Records) $228,000 Public Records
- 2022-10-05 Sold (MLS) $240,000 MARMLS
- 2022-09-23 Pending — MARMLS
- 2022-09-16 Relisted — MARMLS
- 2022-09-15 Price Changed $240,000 MARMLS
- 2022-06-21 Listing Removed — MARMLS
- 2022-06-21 Listed $230,000 MARMLS
- 2022-06-14 Price Changed $230,000 MARMLS
- 2022-05-25 Price Changed $240,000 MARMLS
- 2022-04-08 Listed $250,000 MARMLS
- 2017-05-05 Listing Removed — MARMLS
- 2017-05-04 Price Changed $144,000 MARMLS
- 2017-02-16 Listed $142,000 MARMLS
- 2017-02-15 Listing Removed — MARMLS
- 2016-08-18 Price Changed $144,000 MARMLS
- 2016-06-24 Listed $149,000 MARMLS
- 2012-12-31 Sold (Public Records) $45,500 Public Records
- 2012-12-16 Sold (MLS) $45,500 MARMLS
- 2006-01-20 Sold (Public Records) $175,000 Public Records
- 2001-04-10 Sold (Public Records) $61,000 Public Records
- 1999-05-27 Sold (Public Records) $44,000 Public Records
- 1979-11-01 Sold (Public Records) $38,400 Public Records
Property tax history
+10.6%/yrLatest (2025): $4,557 · +0.8% YoY. Source: county tax records.
Cash-flow waterfall
monthlySold comps — $/sqft
last 12 mo · ≤1 miLoading sold comps…