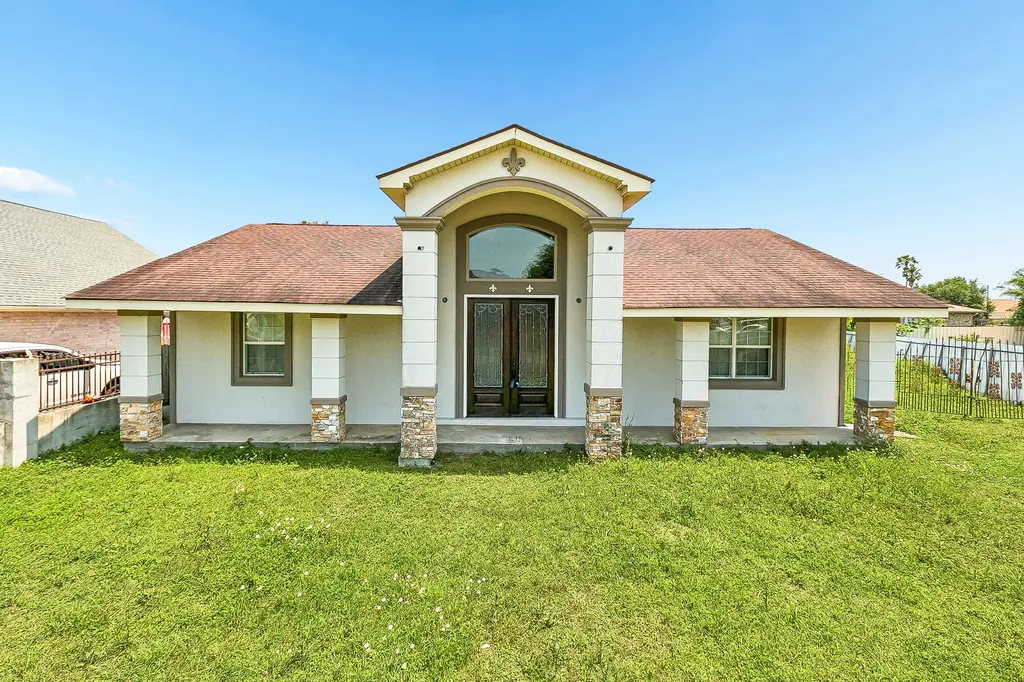
5001 Beaucaire St · New Orleans, LA
Flood risk 8/10 · Major
- FEMA flood zone
- X (shaded)
- Chance of flooding over 30 yrs
- 0.6%
- Est. flood insurance / yr
- $507 – $1,088
Fire risk 1/10 · Minimal
- Est. fire insurance / yr
- $1,269 – $2,357
Heat risk 10/10 · Severe
- Hot days now (above 107°F)
- 7 days/yr
- Hot days in 30 yrs
- 23 days/yr
Wind risk 10/10 · Severe
- Chance of severe wind over 30 yrs
- 99.0%
Air-quality risk 3/10 · Minor
- Unhealthy air days now
- 3 days/yr
- Unhealthy air days in 30 yrs
- 3 days/yr
Risk factors via First Street. Map © Google.
Why this score? — see what drove the B- grade
The composite is a weighted blend of 9 inputs, each scored 0–100. Each bar is that input's sub-score; the figure is the points it added to the 100-point composite (weight × sub-score).
- Cash flow +30.0/30.0
- 1% rule +10.0/10.0
- DSCR +10.0/10.0
- ARV discount +7.5/15.0
- Livability +4.0/5.0
- Rent growth +2.5/5.0
- Condition / age +2.5/5.0
- Schools +1.6/10.0
- Appreciation +0.0/10.0
$80,000
🖨 Deal sheet 📄 Offer letter ✓ Due diligence
Listing remarks MLS
Skip the demo and get straight to the finishes! This spacious 4-bedroom, 2-bathroom home has been meticulously gutted to the studs and features brand-new interior framing. All the heavy lifting is done, offering a "blank slate" for your next flip or custom primary residence. This property is priced to sell and ready for your vision. Sold as-is, where-is. Cash or hard money preferred. Don't miss this chance to build equity from the ground up!
Key facts
- 9,639 sq ft lot
- 2 parking spots
- Built 1975
Property features AI
Exterior
- Parking: Driveway with two parking spaces
- Utilities: Public water; Public sewer
- Home design: Two-story home; Entry level not specified; Facing direction not specified; Property type not specified
- Construction: Brick and stucco construction; Shingle roof; Slab foundation; Built year not specified
- Exterior features: Concrete patio/porch; Corner lot; City lot; Lot dimensions approximately 53' x 110' x 110' x 128'
Interior
- Bathrooms: Two full bathrooms
- Interior features: Six total rooms; Average condition
Neighborhood map
What this means for you Summary
Snapshot
- This is a 3-bed/2.0-bath single-family listed at $80k.
Deal economics
- At list price, monthly cash flow is $671 ($8k/yr) — positive.
- The deal already cash-flows at list — no discount required.
- Meets the 1% rule at list price ($2k rent vs $80k).
- Recommended offer: $78k (3.0% below list) — sets the bar for market timing.
- Cap rate 17.3% vs local median 4.4% in New Orleans — top-decile yield for the area; either an underpriced asset or a hidden risk that comps aren't pricing in. Stress-test before assuming the spread holds.
Location & tenants
- Location reads 81/100 on livability (#3 in LA, #1,383 nationally) — a professional / high-income tenant draw. Strengths: amenities A+, commute A+, health & safety A+; Watch: crime C-, employment D.
- Orleans Parish (urban): math 11% / reading 27% proficiency, ranked #69 of 98 in LA (top 70%) — low school quality limits family demand, transient renter base, plan for 1-2y turnover; 68% free/reduced lunch — lower-income household profile, screen leases tightly.
- Market conditions: 139 active listings in the ZIP; 710 units permitted in Orleans Parish in 2024 (244 in 5+ unit buildings).
Forward outlook
- Local home prices are declining (-3.0%/yr); year-one equity from $553 of loan paydown is wiped out by about $2k of value loss. Plan a longer hold.
- Orleans County population projected at +61% by 2050 — long-run rental-demand tailwind backs the buy-and-hold thesis.
- At projected returns (-3.0% appreciation + 3.0% rent growth), your $22k cash investment doubles in ~4 years — after that, you're playing with house money.
Negotiation context
- It's been on market 43 days — a 3% lower offer ($78k) is reasonable based on typical stale-listing flexibility.
- 3 sale attempts with the ask held roughly flat each time — persistent listings suggest the price (not the market) is what's stuck; bring a comps-based counter.
Risks & watch-outs
- Watch-outs: flood insurance adds $66/mo.
- Climate carrying-cost: severe flood risk; severe wind risk, 99% chance of damaging wind over 30y; extreme-heat days projected 7→23/yr by 2055 (HVAC capex compounding) — expect insurance premiums to compound above CPI over the hold.
Questions for the listing agent
- It's been on market 43 days. Have you received any prior offers? Is the seller open to a 3% concession, seller financing, or rate buy-down credit?
- Built in 1975 — when were the roof, HVAC, electrical panel, plumbing, and water heater last replaced?
- What's the actual annual flood-insurance premium (NFIP or private), and is the property in a SFHA with mandatory coverage?
- Is there a deadline driving the sale (1031 exchange, divorce, estate, relocation)? That informs how much negotiation room exists.
- What's the average days-on-market for RENTAL listings here right now (not sales)? A rising rental-DOM trend means longer vacancies and softer asking-rent achievability than the comps imply.
- What's the recent tenant-quality profile in this submarket — average credit score on applications, eviction rate, late-payment / NSF rate, and stable-employment percentage? A property-management company in the area should have these aggregated.
- How much new for-sale + rental construction is in the pipeline within 1–3 miles? Heavy new supply typically softens prices + rents 12–24 months out; constrained supply supports both.
Investment metrics
- 1% rule
- 2.08% ✓
- Cap rate
- 17.35%
- Cash-on-cash
- 39.48%
- DSCR
- 2.76
- GRM
- 4.0
CMA / ARV
- ARV (median comp)
- $173,445
- List price
- $80,000
- Delta
- -53.88%
- Verdict
- UNDERPRICED
- Comps
- 20 within 1.0 mi
Show comp detail 8 sales within ~0.75 mi
| Address | Dist | Beds/Ba | Sqft | Sold | Price | $/sf | Match |
|---|---|---|---|---|---|---|---|
| 13010 Chateau Ct | 0.09mi | 3/2.5 | 2,159 (+2%) | 3mo | $155,000 | $72 | 88 |
| 13134 Dwyer Blvd | 0.12mi | 4/2.5 (+1) | 2,223 (+5%) | 7mo | $63,000 | $28 | 73 |
| 5170 Toulon St | 0.23mi | 4/2.0 (+1) | 2,180 (+3%) | 13mo | $215,000 | $99 | 69 |
| 4919 Bergerac St | 0.27mi | 4/2.0 (+1) | 2,318 (+9%) | 7mo | $160,000 | $69 | 61 |
| 4827 Michoud Blvd | 0.23mi | 4/2.5 (+1) | 1,982 (-6%) | 19mo | $94,000 | $47 | 56 |
| 13018 Deauville Ct | 0.27mi | 4/2.0 (+1) | 1,904 (-10%) | 14mo | $75,000 | $39 | 54 |
| 13734 Lourdes St | 0.56mi | 3/2.0 | 2,294 (+8%) | 8mo | $110,000 | $48 | 54 |
| 13110 Maplewood Dr | 0.36mi | 4/2.5 (+1) | 2,300 (+9%) | 21mo | $235,000 | $102 | 44 |
Match score weights: distance 35% · size 25% · config 20% · recency 20%. Top-matched comps best support the ARV.
Projected returns pro-forma
-3.0% appreciation · 3.0% rent growth · sell at horizon
- IRR
- 31.7%
- Equity multiple
- 2.33×
- Total profit
- $29,826
- Equity at exit
- $11,928
- IRR
- 38.8%
- Equity multiple
- 4.63×
- Total profit
- $81,298
- Equity at exit
- $6,917
Cash invested: $22,400 (down + closing). Projections, not guarantees.
Landlord ↔ Tenant lean methodology
- Overall (STATE)
- 90 Strongly Landlord-Friendly
- State Louisiana
- 90 Strongly Landlord-Friendly · R+12
- County
- — inherits STATE
- City
- — inherits STATE
ZIP-level market 70129
- Active inventory
- 139
- Price-to-rent
- 4.0×
Monthly cashflow live
- Estimated rent
- $1,667 medium interval (Pro) →
- Mortgage (P&I)
- −$420
- Tax from tax record
- −$127 /mo · $1,520/yr
- Insurance
- −$33
- Flood insurance flood zone
- −$66 /mo · $798/yr
- HOA
- −$0
- Vacancy / Maint / Mgmt
- −$350
- Net cashflow
- $671
Break-even live
UW: 25.0% down · 7.5% · 30yr · 1.5% tax · 5.0% vac · 8.0% maint · 8.0% mgmt
Financing live
Cash to close
- Down payment
- $20,000
- Closing costs
- $2,400
- Reserves months
- —
- Total cash needed
- —
Loan-product check · same deal, 3 products live
Conventional
25% down · 7.5% · 30yr
- Down + closing
- —
- Monthly P&I
- —
- Monthly cashflow
- —
- DSCR
- —
- Eligible?
- —
Personal DTI + credit; lowest rate.
DSCR
20% down · 8.5% · 30yr
- Down + closing
- —
- Monthly P&I
- —
- Monthly cashflow
- —
- DSCR
- —
- Eligible?
- —
No personal income docs; deal must DSCR.
Hard money
10% down · 12.0% · 12mo
- Down + closing
- —
- Monthly P&I
- —
- Monthly cashflow
- —
- DSCR
- —
- Eligible?
- —
Short-term bridge; refi at stabilization.
Listing history 20 events
-
2026-06-18days on market $80,000 Active 43 DOM
-
2026-06-17days on market $80,000 Active 42 DOM
-
2026-06-16days on market $80,000 Active 41 DOM
-
2026-06-15days on market $80,000 Active 40 DOM
-
2026-06-13days on market $80,000 Active 38 DOM
-
2026-06-10days on market $80,000 Active 35 DOM
-
2026-06-09days on market $80,000 Active 34 DOM
-
2026-06-08days on market $80,000 Active 33 DOM
-
2026-06-07days on market $80,000 Active 32 DOM
-
2026-06-05days on market $80,000 Active 29 DOM
-
2026-06-03days on market $80,000 Active 28 DOM
-
2026-06-02days on market $80,000 Active 27 DOM
-
2026-06-01days on market $80,000 Active 26 DOM
-
2026-05-31days on market $80,000 Active 25 DOM
-
2026-05-06$80,000 Active 455-char remark
Show marketing remark (455 chars)
Skip the demo and get straight to the finishes! This spacious 4-bedroom, 2-bathroom home has been meticulously gutted to the studs and features brand-new interior framing. All the heavy lifting is done, offering a "blank slate" for your next flip or custom primary residence. This property is priced to sell and ready for your vision. Sold as-is, where-is. Cash or hard money preferred. Don't miss this chance to build equity from the ground up!
-
2025-09-11$120,000 Active
-
2025-09-11$120,000 Active
-
1993-12-16soldstatus $76,093
-
1979-12-06soldstatus $13,000
ⓘ Source: listings_history table (triggers on properties + properties_extension) + one-shot
backfill from property_details.listing_events for pre-trigger history.
Tax reassessment forecast LA · Resets to sale price
- Current annual tax
- $1,520 · $127/mo
- Projected year-2 tax
- $1,520 · $127/mo
- Expected delta
- $0/yr ($0/mo · 0.0%)
ⓘ Screening estimate from a state-policy table — verify with the county assessor before closing.
Climate risk First Street
- Flood 8/10 Severe FEMA zone X (shaded) · 60% chance over 30 yrs
- Wildfire 1/10 Low
- Heat 10/10 Extreme 7 d/yr ≥107°F today · 23 d/yr by 30 yrs out
- Wind 10/10 Extreme 99% chance of damaging wind over 30 yrs
- Air quality 3/10 Moderate 3 unhealthy d/yr today · 3 by 30 yrs out
Nearby sold comps map
Loading sold comps map…
Walkable amenities ~0.75 mi
Loading nearby amenities…
Taxation est. · year 1
- Rental income
- $19,998
- − Mortgage interest
- −$4,481
- − Property taxes
- −$1,520
- − Insurance
- −$1,198
- − Repairs & maintenance
- −$1,600
- − Management
- −$1,600
- − Depreciation
- −$2,327
- Taxable income
- $7,272
- Est. tax owed @ 24.0%
- −$1,745
- After-tax cash flow
- $6,301/yr
For passive investors: Depreciation is non-cash, so a rental often shows a tax loss while cash-flowing — sheltering income. Rental losses are passive: they offset passive income freely, and up to $25,000/yr can offset ordinary (W-2) income if you actively participate and your MAGI is under $100k (phasing out to $0 by $150k); unused losses carry forward. On sale, claimed depreciation is recaptured at up to 25%, and gains may owe capital-gains tax (a 1031 exchange can defer both). Figures are a year-1 estimate at your 24.0% rate — not tax advice; consult a CPA.
Schools (NCES district)
- District
- Orleans Parish
- NCES district ID
- 2201170
- Math proficiency
- 11% ▼ -52.00%
- Reading proficiency
- 27% ▼ -46.00%
- Median HH income
- $37,011
- Composite
- 15.78/100
- National rank
- #9271
- State rank
- #69 of 98 in LA
Livability — New Orleans
- Score
- 81/100
- State rank
- #3
- US rank
- #1383
Category grades
Schools grade is shown separately in the Schools card above.
Census & demographics
- Census place
- New Orleans, LA
- City population
- 338,817
- Population (ZIP)
- 10,219
Population outlook (Orleans County) Hauer SSP2
- Today (2025)
- 513,025 people
- By 2030
- 575,781 · +12.2%
- By 2040
- 700,174 · +36.5%
- By 2050
- 826,541 · +61.1%
- By 2075
- 1,123,374 · +119.0%
- By 2100
- 1,355,609 · +164.2%
Race, ethnicity, and origin ACS 2023
- Neighborhood character
- Diverse neighborhood (Simpson 0.65)
- Race & ethnicity
- Black 49% Asian 29% Hispanic / Latino 12% White 8% Two or more races 2%
- Hispanic origin (detail)
- Mexican 2%
- Common ancestry
- Lithuanian 1%
- Foreign-born
- 32% · Vietnam, Canada, Jamaica
- Languages at home
- 63% English-only · Vietnamese 29% Spanish 8%
Political lean MEDSL · Orleans
- 2024 margin
- Solid D (+67.0) · D 82.2% · R 15.2% · Other 2.7%
- 2008→2024 swing
- +6.7pp toward D · 2008: 60.3pp · 2024: 67.0pp
- All cycles
- 2024: D+67.0 2020: D+68.2 2016: D+66.2 2012: D+62.5 2008: D+60.3
Not yet ingested
- Civics
- —
Market trends
- HPI YoY
- ▼ -80.58%
- Current HPI
- 116.8578
- Rent YoY
- —
- Metro
- —
- State GDP YoY
- ▲ 3.29%
- F500 in state
- 10
Industry mix (Fortune 500 HQ in LA)
| Industry | F500 HQs | Revenue |
|---|---|---|
| Telecommunications | 2 | $23B |
|
||
| Utilities | 1 | $12B |
|
||
| Wholesale / Distribution | 1 | $5B |
|
||
| Advertising | 1 | $2B |
|
||
Price history
+515.4% since first listed5 events — show timeline
- 2026-05-06 Listed $80,000 AcadianaMLS
- 2026-05-06 Listed $80,000 GSREIN
- 2025-09-11 Listed $120,000 AcadianaMLS
- 1993-12-16 Sold (Public Records) $76,093 Public Records
- 1979-12-06 Sold (Public Records) $13,000 Public Records
Property tax history
+2.5%/yrLatest (2026): $1,520 · +1.1% YoY. Source: county tax records.
Cash-flow waterfall
monthlySold comps — $/sqft
last 12 mo · ≤1 miLoading sold comps…