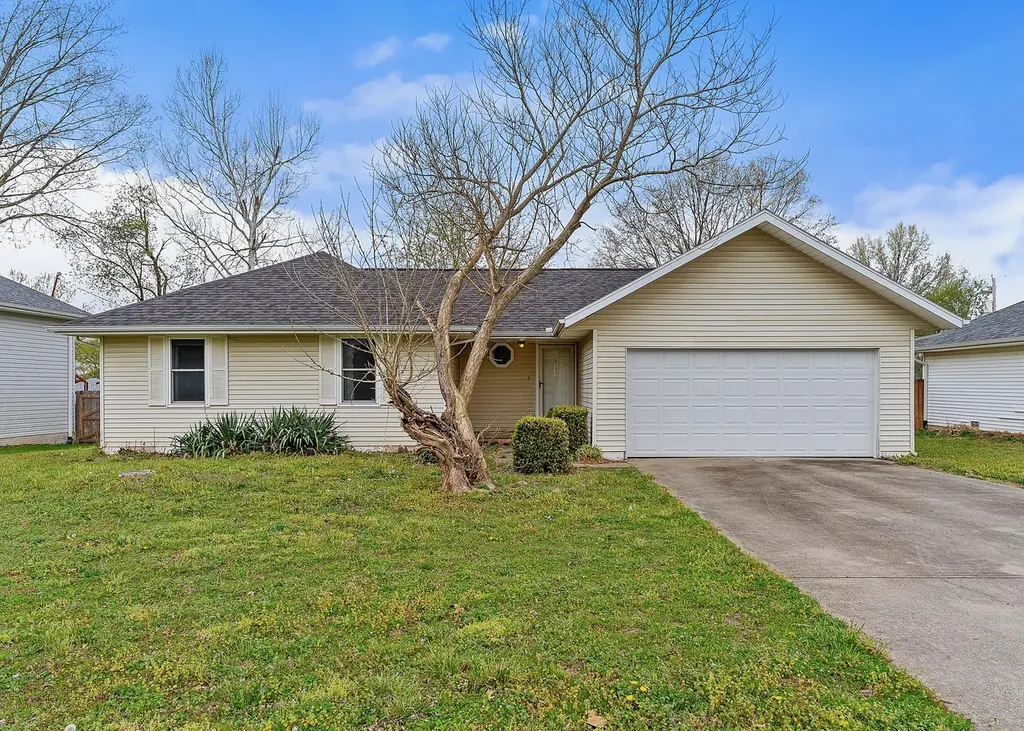
5661 S Dayton Ave · Springfield, MO
Flood risk 1/10 · Minimal
- FEMA flood zone
- X (unshaded)
- Chance of flooding over 30 yrs
- 0.0%
- Est. flood insurance / yr
- $507 – $1,088
Fire risk 2/10 · Minimal
- Est. fire insurance / yr
- $1,054 – $1,958
Heat risk 5/10 · Moderate
- Hot days now (above 105°F)
- 7 days/yr
- Hot days in 30 yrs
- 19 days/yr
Wind risk 2/10 · Minimal
- Chance of severe wind over 30 yrs
- —
Air-quality risk 1/10 · Minimal
- Unhealthy air days now
- 0 days/yr
- Unhealthy air days in 30 yrs
- 0 days/yr
Risk factors via First Street. Map © Google.
Why this score? — see what drove the C- grade
The composite is a weighted blend of 9 inputs, each scored 0–100. Each bar is that input's sub-score; the figure is the points it added to the 100-point composite (weight × sub-score).
- Cash flow +18.9/30.0
- ARV discount +9.1/15.0
- DSCR +6.0/10.0
- 1% rule +4.1/10.0
- Livability +3.8/5.0
- Schools +3.2/10.0
- Rent growth +3.1/5.0
- Condition / age +2.5/5.0
- Appreciation +0.0/10.0
$200,000
🖨 Deal sheet 📄 Offer letter ✓ Due diligence
Listing remarks MLS
So many updates to this immaculate home in great neighborhood in Kickapoo School District. Lovely ceiling treatments with cathedral ceiling in LR & raised, tray ceiling in MBR for a spacious, airy feeling. Home has new: architectural roof, gutters & downspouts; garage door; upgraded laminate flooring in kitchen, living room, laundry room, & hall; linoleum in both baths; carpet in bedrooms; dishwasher, and furnace. The light fixtures, ceiling fans, and kitchen countertops were replaced just 4 years ago. All ready for new owners!
Key facts
- 0.23 acre lot
- 2 garage spots
- Built 1991
Tags
Neighborhood map
What this means for you Summary
Snapshot
- This is a 3-bed/2.0-bath single-family listed at $200k.
Deal economics
- At list price, monthly cash flow is $205 ($2k/yr) — positive.
- The deal already cash-flows at list — no discount required.
- To meet the 1% rule (rent ≥ 1% of price), the offer needs to be $182k (9.1% below list).
- Recommended offer: $182k (9.1% below list) — sets the bar for 1% rule.
- Cap rate 7.5% vs local median 4.6% in Springfield — top-decile yield for the area; either an underpriced asset or a hidden risk that comps aren't pricing in. Stress-test before assuming the spread holds.
Location & tenants
- Location reads 75/100 on livability (#57 in MO, #4,121 nationally) — a middle-class / working-renter tenant base. Strengths: commute A+, cost of living A+, housing A+; Watch: crime F, employment F.
- Springfield R-XII (urban): math 32% / reading 46% proficiency, ranked #174 of 324 in MO (top 54%) — families likely to look elsewhere, expect single-tenant / working-renter base with shorter leases.
- Zoned schools: Cherokee Middle (math 50% / reading 62%, grade B-, #40 of 391 statewide, top 10%, 758 students, 27% FRL); Kickapoo High (math 39% / reading 66%, grade C-, #89 of 521 statewide, top 17%, 1,881 students, 26% FRL) — zoned schools average 27% FRL vs 46% district-wide (20 pts lower); this property's tenant base skews higher-income than the district average.
- Zoned-school proficiency averages 54% at this address vs 39% district-wide (+15 pts) — the actual schools serving this property are materially stronger than the Springfield R-XII average implies; a family-tenant draw the district grade alone would hide.
- Market conditions: Rents rising (+2.5%/yr); 250 active listings in the ZIP; 4 comparable units currently listed for rent nearby; rentals leasing fast (median 14d on market — plan ~1-2 weeks tenant-placement turnaround); solid renter incomes; 1,302 units permitted in Greene County in 2024 (250 in 5+ unit buildings).
Forward outlook
- Local home prices are declining (-3.0%/yr); year-one equity from $1k of loan paydown is wiped out by about $6k of value loss. Plan a longer hold.
- Greene County population projected at +25% by 2050 — long-run rental-demand tailwind backs the buy-and-hold thesis.
Negotiation context
- Only 2 days on market — expect competitive offers; lowballing is unlikely to land.
- 3 sale attempts since 10y ago with the ask held roughly flat each time — persistent listings suggest the price (not the market) is what's stuck; bring a comps-based counter.
Risks & watch-outs
- Climate carrying-cost: extreme-heat days projected 7→19/yr by 2055 (HVAC capex compounding) — expect insurance premiums to compound above CPI over the hold.
Questions for the listing agent
- Is there a deadline driving the sale (1031 exchange, divorce, estate, relocation)? That informs how much negotiation room exists.
- Crime grade is F in this area — have there been break-ins, vandalism, or insurance claims at this property in the last 3 years? What carrier currently insures it and at what premium?
- What's the average days-on-market for RENTAL listings here right now (not sales)? A rising rental-DOM trend means longer vacancies and softer asking-rent achievability than the comps imply.
- What's the recent tenant-quality profile in this submarket — average credit score on applications, eviction rate, late-payment / NSF rate, and stable-employment percentage? A property-management company in the area should have these aggregated.
- How much new for-sale + rental construction is in the pipeline within 1–3 miles? Heavy new supply typically softens prices + rents 12–24 months out; constrained supply supports both.
Investment metrics
- 1% rule
- 0.91% ✗
- Cap rate
- 7.52%
- Cash-on-cash
- 4.39%
- DSCR
- 1.20
- GRM
- 9.2
CMA / ARV
- ARV (on-the-fly)
- $207,432
- Comps found
- 9
Show comp detail 9 sales within ~0.75 mi
| Address | Dist | Beds/Ba | Sqft | Sold | Price | $/sf | Match |
|---|---|---|---|---|---|---|---|
| 5626 S Stonegate Ave | 0.12mi | 3/1.5 | 1,068 (+4%) | 5mo | $214,900 | $201 | 82 |
| 5670 S Dayton Ave | 0.03mi | 2/1.0 (-1) | 1,000 (-3%) | 6mo | $163,500 | $164 | 79 |
| 5784 S Michigan Ave | 0.17mi | 3/1.0 | 1,004 (-3%) | 7mo | $184,900 | $184 | 78 |
| 5783 S Franklin Ave | 0.36mi | 3/2.0 | 1,022 (-1%) | 6mo | $207,400 | $203 | 77 |
| 5759 S Ferguson Ave | 0.41mi | 3/2.0 | 1,014 (-2%) | 2mo | $190,000 | $187 | 77 |
| 5649 S Pinehurst Ave | 0.06mi | 2/1.5 (-1) | 984 (-5%) | 9mo | $199,900 | $203 | 74 |
| 5649 S Franklin Ave | 0.33mi | 3/2.0 | 1,022 (-1%) | 20mo | $225,000 | $220 | 67 |
| 5715 S Ferguson Ave | 0.40mi | 3/2.0 | 1,031 (-0%) | 20mo | $220,000 | $213 | 65 |
| 5649 S Ferguson Ave | 0.39mi | 3/2.0 | 998 (-3%) | 22mo | $119,900 | $120 | 58 |
Match score weights: distance 35% · size 25% · config 20% · recency 20%. Top-matched comps best support the ARV.
Projected returns pro-forma
-3.0% appreciation · 2.53% rent growth · sell at horizon
- IRR
- -10.0%
- Equity multiple
- 0.64×
- Total profit
- $-20,288
- Equity at exit
- $29,821
- IRR
- -1.2%
- Equity multiple
- 0.92×
- Total profit
- $-4,617
- Equity at exit
- $17,292
Cash invested: $56,000 (down + closing). Projections, not guarantees.
Landlord ↔ Tenant lean methodology
- Overall (STATE)
- 81 Strongly Landlord-Friendly
- State Missouri
- 81 Strongly Landlord-Friendly · R+10
- County
- — inherits STATE
- City
- — inherits STATE
ZIP-level market 65810
- Home prices YoY
- -28.8%
- Rents YoY
- 2.5%
- Active inventory
- 250
- Price-to-rent
- 9.2×
Monthly cashflow live
- Estimated rent
- $1,818 medium interval (Pro) →
- Mortgage (P&I)
- −$1,049
- Tax from tax record
- −$99 /mo · $1,191/yr
- Insurance
- −$83
- HOA
- −$0
- Vacancy / Maint / Mgmt
- −$382
- Net cashflow
- $205
Break-even live
UW: 25.0% down · 7.5% · 30yr · 1.5% tax · 5.0% vac · 8.0% maint · 8.0% mgmt
Financing live
Cash to close
- Down payment
- $50,000
- Closing costs
- $6,000
- Reserves months
- —
- Total cash needed
- —
Loan-product check · same deal, 3 products live
Conventional
25% down · 7.5% · 30yr
- Down + closing
- —
- Monthly P&I
- —
- Monthly cashflow
- —
- DSCR
- —
- Eligible?
- —
Personal DTI + credit; lowest rate.
DSCR
20% down · 8.5% · 30yr
- Down + closing
- —
- Monthly P&I
- —
- Monthly cashflow
- —
- DSCR
- —
- Eligible?
- —
No personal income docs; deal must DSCR.
Hard money
10% down · 12.0% · 12mo
- Down + closing
- —
- Monthly P&I
- —
- Monthly cashflow
- —
- DSCR
- —
- Eligible?
- —
Short-term bridge; refi at stabilization.
Rent comps 4 comps
| Address | Beds | Baths | Sqft | Rent | $/sqft | DOM | Units | Dist |
|---|---|---|---|---|---|---|---|---|
| 5305 S Michigan Ave Springfield, MO | 2.0–3.0 | 2.0–2.5 | 1644 | $2,017 | $1.23 | 13d | 3 | 0.33mi |
| 565 W Bryant Springfield, MO | 1.0–2.0 | 1.0–2.0 | 891 | $1,621 | $1.82 | 13d | 4 | 0.58mi |
| 5100 S Main Ave Springfield, MO | 1.0–2.0 | 1.0–2.0 | 925 | $1,275 | $1.38 | 13d | 1 | 0.71mi |
| 4730 S Robberson Ave Springfield, MO | 3.0 | 1.0–2.0 | 807 | $1,195 | $1.48 | 43d | 7 | 1.30mi |
Listing history 11 events
-
2026-04-04status Pending
-
2026-04-02$200,000 Active
-
2024-12-31soldstatus
-
2021-02-11soldstatus
-
2021-02-10soldstatus 550-char remark
Show marketing remark (550 chars)
So many updates to this immaculate home in great neighborhood in Kickapoo School District. Lovely ceiling treatments with cathedral ceiling in LR & raised, tray ceiling in MBR for a spacious, airy feeling. Home has new: architectural roof, gutters & downspouts; garage door; upgraded laminate flooring in kitchen, living room, laundry room, & hall; linoleum in both baths; carpet in bedrooms; dishwasher, and furnace. The light fixtures, ceiling fans, and kitchen countertops were replaced just 4 years ago. All ready for new owners!
-
2020-12-30$139,900 550-char remark
Show marketing remark (550 chars)
So many updates to this immaculate home in great neighborhood in Kickapoo School District. Lovely ceiling treatments with cathedral ceiling in LR & raised, tray ceiling in MBR for a spacious, airy feeling. Home has new: architectural roof, gutters & downspouts; garage door; upgraded laminate flooring in kitchen, living room, laundry room, & hall; linoleum in both baths; carpet in bedrooms; dishwasher, and furnace. The light fixtures, ceiling fans, and kitchen countertops were replaced just 4 years ago. All ready for new owners!
-
2016-02-24soldstatus
-
2016-02-23soldstatus 301-char remark
Show marketing remark (301 chars)
Super clean move in ready home! Great schools, great location, great house! Sellers just put in all new flooring in family room/kitchen. Cabinets are freshly painted, new counter tops, light fixtures & ceiling fans! Privacy fenced yard, fire pit and kids play set stay! All ready for new owners!
-
2016-01-19$94,900 301-char remark
Show marketing remark (301 chars)
Super clean move in ready home! Great schools, great location, great house! Sellers just put in all new flooring in family room/kitchen. Cabinets are freshly painted, new counter tops, light fixtures & ceiling fans! Privacy fenced yard, fire pit and kids play set stay! All ready for new owners!
-
2012-12-12soldstatus
-
2004-05-24soldstatus
ⓘ Source: listings_history table (triggers on properties + properties_extension) + one-shot
backfill from property_details.listing_events for pre-trigger history.
Tax reassessment forecast MO · Resets to sale price
- Current annual tax
- $1,191 · $99/mo
- Projected year-2 tax
- $1,940 · $162/mo
- Expected delta
- +$749/yr (+$62/mo · 62.9%)
ⓘ Screening estimate from a state-policy table — verify with the county assessor before closing.
Climate risk First Street
- Flood 1/10 Low FEMA zone X (unshaded) · 0% chance over 30 yrs
- Wildfire 2/10 Low
- Heat 5/10 Major 7 d/yr ≥105°F today · 19 d/yr by 30 yrs out
- Wind 2/10 Low
- Air quality 1/10 Low 0 unhealthy d/yr today · 0 by 30 yrs out
Nearby sold comps map
Loading sold comps map…
Walkable amenities ~0.75 mi
Loading nearby amenities…
Taxation est. · year 1
- Rental income
- $21,816
- − Mortgage interest
- −$11,203
- − Property taxes
- −$1,191
- − Insurance
- −$1,000
- − Repairs & maintenance
- −$1,745
- − Management
- −$1,745
- − Depreciation
- −$5,818
- Taxable loss
- −$887
- Est. tax savings @ 24.0%
- +$213
- After-tax cash flow
- $2,670/yr
For passive investors: Depreciation is non-cash, so a rental often shows a tax loss while cash-flowing — sheltering income. Rental losses are passive: they offset passive income freely, and up to $25,000/yr can offset ordinary (W-2) income if you actively participate and your MAGI is under $100k (phasing out to $0 by $150k); unused losses carry forward. On sale, claimed depreciation is recaptured at up to 25%, and gains may owe capital-gains tax (a 1031 exchange can defer both). Figures are a year-1 estimate at your 24.0% rate — not tax advice; consult a CPA.
Schools (NCES district)
- District
- Springfield R-XII
- NCES district ID
- 2928860
- Math proficiency
- 32% ▼ -2.00%
- Reading proficiency
- 46% ▼ -3.00%
- Median HH income
- $37,886
- Composite
- 32.45/100
- National rank
- #5717
- State rank
- #174 of 324 in MO
Livability — Springfield
- Score
- 75/100
- State rank
- #57
- US rank
- #4121
Category grades
Schools grade is shown separately in the Schools card above.
Census & demographics
- County
- Greene County · 244,327 people
- City population
- 223,044
- Metro
- Springfield, MO
- Population (ZIP)
- 22,137
- Household income
- $95,160
- Rent vs Own
- Severe rent burden
- 437.0
Population outlook (Greene County) Hauer SSP2
- Today (2025)
- 319,054 people
- By 2030
- 335,135 · +5.0%
- By 2040
- 366,186 · +14.8%
- By 2050
- 397,431 · +24.6%
- By 2075
- 477,035 · +49.5%
- By 2100
- 520,828 · +63.2%
Race, ethnicity, and origin ACS 2023
- Neighborhood character
- Predominantly White (89%)
- Race & ethnicity
- White 89% Two or more races 4% Hispanic / Latino 3% Asian 3% Black 2%
- Common ancestry
- Italian 4% Lithuanian 3% Portuguese 3%
- Foreign-born
- 4% · Vietnam, China, Canada
- Languages at home
- 95% English-only · Other Indo-European 1% Spanish 1% Chinese 1%
Political lean MEDSL · Greene
- 2024 margin
- Strong R (+20.8) · D 38.9% · R 59.7% · Other 1.4%
- 2008→2024 swing
- -5.0pp toward R · 2008: -15.8pp · 2024: -20.8pp
- All cycles
- 2024: R+20.8 2020: R+20.1 2016: R+27.4 2012: R+24.4 2008: R+15.8
Not yet ingested
- Civics
- —
Market trends
- HPI YoY
- ▼ -78.67%
- Current HPI
- 194.8736
- Rent YoY
- ▲ 2.53%
- Metro
- Springfield, MO
- State GDP YoY
- ▲ 1.84%
- F500 in state
- 20
Industry mix (Fortune 500 HQ in MO)
| Industry | F500 HQs | Revenue |
|---|---|---|
| Healthcare | 1 | $163B |
|
||
| Insurance | 1 | $21B |
|
||
| Industrial Technology | 1 | $17B |
|
||
| Retail | 1 | $16B |
|
||
| Industrial Distribution | 1 | $10B |
|
||
| Utilities | 1 | $9B |
|
||
Price history
+110.7% since first listed11 events — show timeline
- 2026-04-04 Pending — SOMO
- 2026-04-02 Listed $200,000 SOMO
- 2024-12-31 Sold (Public Records) — Public Records
- 2021-02-11 Sold (Public Records) — Public Records
- 2021-02-10 Sold (MLS) — SOMO
- 2020-12-30 Listed $139,900 SOMO
- 2016-02-24 Sold (Public Records) — Public Records
- 2016-02-23 Sold (MLS) — SOMO
- 2016-01-19 Listed $94,900 SOMO
- 2012-12-12 Sold (Public Records) — Public Records
- 2004-05-24 Sold (Public Records) — Public Records
Property tax history
+2.8%/yrLatest (2025): $1,191 · +4.1% YoY. Source: county tax records.
Cash-flow waterfall
monthlySold comps — $/sqft
last 12 mo · ≤1 miLoading sold comps…