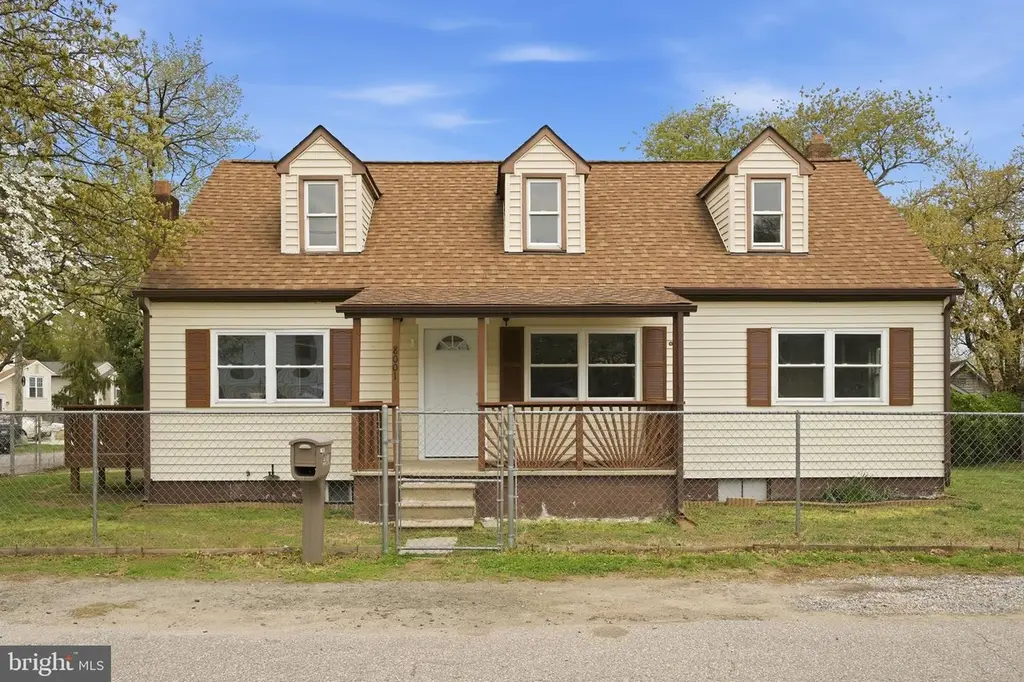
8001 W End Dr · Riviera Beach, MD
Flood risk 1/10 · Minimal
- FEMA flood zone
- X (unshaded)
- Chance of flooding over 30 yrs
- 0.0%
- Est. flood insurance / yr
- $473 – $860
Fire risk 1/10 · Minimal
- Est. fire insurance / yr
- $755 – $1,403
Heat risk 8/10 · Major
- Hot days now (above 103°F)
- 7 days/yr
- Hot days in 30 yrs
- 15 days/yr
Wind risk 6/10 · Moderate
- Chance of severe wind over 30 yrs
- 67.0%
Air-quality risk 5/10 · Moderate
- Unhealthy air days now
- 6 days/yr
- Unhealthy air days in 30 yrs
- 8 days/yr
Risk factors via First Street. Map © Google.
Why this score? — see what drove the C+ grade
The composite is a weighted blend of 9 inputs, each scored 0–100. Each bar is that input's sub-score; the figure is the points it added to the 100-point composite (weight × sub-score).
- Cash flow +20.1/30.0
- ARV discount +12.7/15.0
- Appreciation +8.9/10.0
- DSCR +6.4/10.0
- 1% rule +4.5/10.0
- Livability +3.2/5.0
- Schools +2.9/10.0
- Rent growth +2.5/5.0
- Condition / age +2.5/5.0
$479,900
🖨 Deal sheet 📄 Offer letter ✓ Due diligence
Listing remarks MLS
BEAUTIFUL NEWLY RENOVATED CORNER LOT NOW AVAILABLE IN SOUGHT AFTER ORCHARD BEACH. AWESOME COMMUNITY WITH INCREDIBLE WATER VIEWS. OVER 3,000 SQUARE FEET. LOADS OF NATURAL LIGHT. GLEAMING HARDWOODS CASCADE THROUGHOUT. ENJOY OAK CABINETRY, IMPORTED TILE, GORGEOUS GRANITE COUNTERTOPS, BRAND NEW SS APPLIANCES IN DESIGNER KITCHEN. OVERSIZED FAMILY ROOM WITH LARGE DINING SPACE. SPACIOUS 5 BEDROOMS WITH 2 BATHROOMS. LOWER LEVEL AND SECOND LEVEL BORH OFFER A SPACIOUS SECONDARY GREAT ROOM - PERFECT FOR KIDS PLAYROOM, OFFICE, OR HOME GYM. FENCED-IN FLAT YARD WITH OVERSIZED DECK - GREAT FOR ENTERTAINING. REAR SHED INCLUDED, PERFECT FOR ADDITIONAL STORAGE. CLOSE PROXIMITY TO LOCAL DINING, RETAIL SHOPPING, AND MAJOR HIGHWAYS. ACCESS TO COMMUNITY PLAYGROUND AND BOAT RAMPS. SCHEDULE A PRIVATE TOUR TODAY!
Key facts
- Oak cabinetry
- Imported tile
- Water views
Tags
Neighborhood map
What this means for you Summary
Snapshot
- This is a 5-bed/1.0-bath single-family listed at $480k.
Deal economics
- At list price, monthly cash flow is $593 ($7k/yr) — positive.
- The deal already cash-flows at list — no discount required.
- To meet the 1% rule (rent ≥ 1% of price), the offer needs to be $456k (5.0% below list).
- Recommended offer: $451k (6.0% below list) — sets the bar for market timing.
- Cap rate 7.8% vs local median 5.6% in Riviera Beach — top-decile yield for the area; either an underpriced asset or a hidden risk that comps aren't pricing in. Stress-test before assuming the spread holds.
Location & tenants
- Location reads 64/100 on livability (#280 in MD) — a middle-class / working-renter tenant base. Strengths: employment A+, housing A+; Watch: crime D, cost of living D, schools D-.
- Anne Arundel County Public Schools (suburban): math 20% / reading 37% proficiency, ranked #10 of 24 in MD (top 42%) — low school quality limits family demand, transient renter base, plan for 1-2y turnover.
- Market conditions: 45 active listings in the ZIP; 4 comparable units currently listed for rent nearby; rentals lingering (median 44d on market — plan ~5-8 weeks vacancy on turnover, expect pricing pressure); 50% of comp listings sitting > 30 days — soft ceiling on asking rent; 1,303 units permitted in Anne Arundel County in 2024 (299 in 5+ unit buildings).
Forward outlook
- In year one you build about $41k of equity ($3k loan paydown + $37k appreciation (7.8% local appreciation)).
- Anne Arundel County population projected at +17% by 2050 — long-run rental-demand tailwind backs the buy-and-hold thesis.
- At projected returns (7.8% appreciation + 3.0% rent growth), your $134k cash investment doubles in ~3 years — after that, you're playing with house money.
- By year 2, paydown + projected appreciation supports a ~$65k cash-out refi (75% LTV) — recoverable capital for the next deal without selling this one.
Negotiation context
- It's been on market 65 days — a 6% lower offer ($451k) is reasonable based on typical stale-listing flexibility.
- 3 sale attempts since 28y ago; this cycle's ask has dropped $50k (9%) from the opening price — seller is motivated, your offer sets the floor, not the list.
- Current owner paid $190k; list at $480k implies a 153% gain — meaningful room to come down on a strong offer.
Risks & watch-outs
- Watch-outs: built in 1940 — expect roof / HVAC / electrical / plumbing capex.
- Climate carrying-cost: major wind risk, 67% chance of damaging wind over 30y; extreme-heat days projected 7→15/yr by 2055 (HVAC capex compounding) — expect insurance premiums to compound above CPI over the hold.
Questions for the listing agent
- It's been on market 65 days. Have you received any prior offers? Is the seller open to a 6% concession, seller financing, or rate buy-down credit?
- Built in 1940 — when were the roof, HVAC, electrical panel, plumbing, and water heater last replaced?
- Why hasn't it sold? Are there any deal-killer items the seller is aware of (foundation, flood, title, zoning, code violations)?
- Is there a deadline driving the sale (1031 exchange, divorce, estate, relocation)? That informs how much negotiation room exists.
- Schools are D-rated, which usually means shorter tenancies and higher turnover. Who's the typical renter profile here, and what's been the actual vacancy rate?
- Crime grade is D in this area — have there been break-ins, vandalism, or insurance claims at this property in the last 3 years? What carrier currently insures it and at what premium?
- What's the average days-on-market for RENTAL listings here right now (not sales)? A rising rental-DOM trend means longer vacancies and softer asking-rent achievability than the comps imply.
- What's the recent tenant-quality profile in this submarket — average credit score on applications, eviction rate, late-payment / NSF rate, and stable-employment percentage? A property-management company in the area should have these aggregated.
- How much new for-sale + rental construction is in the pipeline within 1–3 miles? Heavy new supply typically softens prices + rents 12–24 months out; constrained supply supports both.
Investment metrics
- 1% rule
- 0.95% ✗
- Cap rate
- 7.78%
- Cash-on-cash
- 5.30%
- DSCR
- 1.24
- GRM
- 8.8
CMA / ARV
- ARV (median comp)
- $542,974
- List price
- $479,900
- Delta
- -11.62%
- Verdict
- UNDERPRICED
- Comps
- 20 within 1.0 mi
Show comp detail 6 sales within ~0.75 mi
| Address | Dist | Beds/Ba | Sqft | Sold | Price | $/sf | Match |
|---|---|---|---|---|---|---|---|
| 8225-A Highpoint Rd | 0.16mi | 4/2.0 (-1) | 1,498 (+4%) | 16mo | $485,000 | $324 | 64 |
| 8111 Holly Rd | 0.15mi | 4/2.0 (-1) | 1,560 (+8%) | 10mo | $414,900 | $266 | 62 |
| 708 Waterview | 0.24mi | 4/2.0 (-1) | 1,528 (+6%) | 12mo | $415,000 | $272 | 60 |
| 181 Roland Rd | 0.60mi | 4/2.0 (-1) | 1,424 (-1%) | 7mo | $435,000 | $305 | 55 |
| 8210 Fort Smallwood Rd | 0.32mi | 5/3.5 | 1,500 (+4%) | 24mo | $430,000 | $287 | 48 |
| 8427 Hall Rd | 0.55mi | 4/2.0 (-1) | 1,340 (-7%) | 16mo | $425,000 | $317 | 40 |
Match score weights: distance 35% · size 25% · config 20% · recency 20%. Top-matched comps best support the ARV.
Projected returns pro-forma
7.75% appreciation · 3.0% rent growth · sell at horizon
- IRR
- 23.5%
- Equity multiple
- 2.69×
- Total profit
- $227,705
- Equity at exit
- $356,455
- IRR
- 21.5%
- Equity multiple
- 5.70×
- Total profit
- $632,180
- Equity at exit
- $699,936
Cash invested: $134,372 (down + closing). Projections, not guarantees.
Landlord ↔ Tenant lean methodology
- Overall (STATE)
- 27 Tenant-Leaning
- State Maryland
- 27 Tenant-Leaning · D+14
- County
- — inherits STATE
- City
- — inherits STATE
ZIP-level market 21226
- Home prices YoY
- 2.5%
- Active inventory
- 45
- Price-to-rent
- 8.8×
Monthly cashflow live
- Estimated rent
- $4,558 medium interval (Pro) →
- Mortgage (P&I)
- −$2,517
- Tax from tax record
- −$291 /mo · $3,496/yr
- Insurance
- −$200
- HOA
- −$0
- Vacancy / Maint / Mgmt
- −$957
- Net cashflow
- $593
Break-even live
UW: 25.0% down · 7.5% · 30yr · 1.5% tax · 5.0% vac · 8.0% maint · 8.0% mgmt
Financing live
Cash to close
- Down payment
- $119,975
- Closing costs
- $14,397
- Reserves months
- —
- Total cash needed
- —
Loan-product check · same deal, 3 products live
Conventional
25% down · 7.5% · 30yr
- Down + closing
- —
- Monthly P&I
- —
- Monthly cashflow
- —
- DSCR
- —
- Eligible?
- —
Personal DTI + credit; lowest rate.
DSCR
20% down · 8.5% · 30yr
- Down + closing
- —
- Monthly P&I
- —
- Monthly cashflow
- —
- DSCR
- —
- Eligible?
- —
No personal income docs; deal must DSCR.
Hard money
10% down · 12.0% · 12mo
- Down + closing
- —
- Monthly P&I
- —
- Monthly cashflow
- —
- DSCR
- —
- Eligible?
- —
Short-term bridge; refi at stabilization.
Rent comps 4 comps
| Address | Beds | Baths | Sqft | Rent | $/sqft | DOM | Units | Dist |
|---|---|---|---|---|---|---|---|---|
| 8436 Bay Dr Pasadena, MD | 4.0 | 3.0 | 1004 | $3,200 | $3.19 | 24d | 1 | 0.67mi |
| 950 Nabbs Creek Rd Glen Burnie, MD | 4.0 | 3.5 | 1752 | $6,500 | $3.71 | 24d | 1 | 0.87mi |
| 202 Glen Rd Pasadena, MD | 5.0 | 3.0 | 1510 | $4,999 | $3.31 | 44d | 1 | 0.88mi |
| 216 Dunlap Rd Pasadena, MD | 4.0 | 2.0 | 1110 | $3,000 | $2.70 | 44d | 1 | 1.35mi |
Listing history 25 events
-
2026-06-18days on market $479,900 Active 65 DOM
-
2026-06-17days on market $479,900 Active 64 DOM
-
2026-06-16pricedays on market $479,900 Active 63 DOM
-
2026-06-15days on market $489,900 Active 62 DOM
-
2026-06-13days on market $489,900 Active 60 DOM
-
2026-06-09days on market $489,900 Active 56 DOM
-
2026-06-08days on market $489,900 Active 55 DOM
-
2026-06-07days on market $489,900 Active 54 DOM
-
2026-06-04days on market $489,900 Active 51 DOM
-
2026-06-03days on market $489,900 Active 50 DOM
-
2026-06-02days on market $489,900 Active 49 DOM
-
2026-06-01days on market $489,900 Active 48 DOM
-
2026-05-31days on market $489,900 Active 47 DOM
-
2026-05-18price $489,900 799-char remark
Show marketing remark (799 chars)
BEAUTIFUL NEWLY RENOVATED CORNER LOT NOW AVAILABLE IN SOUGHT AFTER ORCHARD BEACH. AWESOME COMMUNITY WITH INCREDIBLE WATER VIEWS. OVER 3,000 SQUARE FEET. LOADS OF NATURAL LIGHT. GLEAMING HARDWOODS CASCADE THROUGHOUT. ENJOY OAK CABINETRY, IMPORTED TILE, GORGEOUS GRANITE COUNTERTOPS, BRAND NEW SS APPLIANCES IN DESIGNER KITCHEN. OVERSIZED FAMILY ROOM WITH LARGE DINING SPACE. SPACIOUS 5 BEDROOMS WITH 2 BATHROOMS. LOWER LEVEL AND SECOND LEVEL BORH OFFER A SPACIOUS SECONDARY GREAT ROOM - PERFECT FOR KIDS PLAYROOM, OFFICE, OR HOME GYM. FENCED-IN FLAT YARD WITH OVERSIZED DECK - GREAT FOR ENTERTAINING. REAR SHED INCLUDED, PERFECT FOR ADDITIONAL STORAGE. CLOSE PROXIMITY TO LOCAL DINING, RETAIL SHOPPING, AND MAJOR HIGHWAYS. ACCESS TO COMMUNITY PLAYGROUND AND BOAT RAMPS. SCHEDULE A PRIVATE TOUR TODAY!
-
2026-04-22price $499,900 799-char remark
Show marketing remark (799 chars)
BEAUTIFUL NEWLY RENOVATED CORNER LOT NOW AVAILABLE IN SOUGHT AFTER ORCHARD BEACH. AWESOME COMMUNITY WITH INCREDIBLE WATER VIEWS. OVER 3,000 SQUARE FEET. LOADS OF NATURAL LIGHT. GLEAMING HARDWOODS CASCADE THROUGHOUT. ENJOY OAK CABINETRY, IMPORTED TILE, GORGEOUS GRANITE COUNTERTOPS, BRAND NEW SS APPLIANCES IN DESIGNER KITCHEN. OVERSIZED FAMILY ROOM WITH LARGE DINING SPACE. SPACIOUS 5 BEDROOMS WITH 2 BATHROOMS. LOWER LEVEL AND SECOND LEVEL BORH OFFER A SPACIOUS SECONDARY GREAT ROOM - PERFECT FOR KIDS PLAYROOM, OFFICE, OR HOME GYM. FENCED-IN FLAT YARD WITH OVERSIZED DECK - GREAT FOR ENTERTAINING. REAR SHED INCLUDED, PERFECT FOR ADDITIONAL STORAGE. CLOSE PROXIMITY TO LOCAL DINING, RETAIL SHOPPING, AND MAJOR HIGHWAYS. ACCESS TO COMMUNITY PLAYGROUND AND BOAT RAMPS. SCHEDULE A PRIVATE TOUR TODAY!
-
2026-04-14$529,900 Active 799-char remark
Show marketing remark (799 chars)
BEAUTIFUL NEWLY RENOVATED CORNER LOT NOW AVAILABLE IN SOUGHT AFTER ORCHARD BEACH. AWESOME COMMUNITY WITH INCREDIBLE WATER VIEWS. OVER 3,000 SQUARE FEET. LOADS OF NATURAL LIGHT. GLEAMING HARDWOODS CASCADE THROUGHOUT. ENJOY OAK CABINETRY, IMPORTED TILE, GORGEOUS GRANITE COUNTERTOPS, BRAND NEW SS APPLIANCES IN DESIGNER KITCHEN. OVERSIZED FAMILY ROOM WITH LARGE DINING SPACE. SPACIOUS 5 BEDROOMS WITH 2 BATHROOMS. LOWER LEVEL AND SECOND LEVEL BORH OFFER A SPACIOUS SECONDARY GREAT ROOM - PERFECT FOR KIDS PLAYROOM, OFFICE, OR HOME GYM. FENCED-IN FLAT YARD WITH OVERSIZED DECK - GREAT FOR ENTERTAINING. REAR SHED INCLUDED, PERFECT FOR ADDITIONAL STORAGE. CLOSE PROXIMITY TO LOCAL DINING, RETAIL SHOPPING, AND MAJOR HIGHWAYS. ACCESS TO COMMUNITY PLAYGROUND AND BOAT RAMPS. SCHEDULE A PRIVATE TOUR TODAY!
-
2019-10-17soldstatus $190,000
-
2003-03-31soldstatus $180,000
-
2003-03-24soldstatus $180,000
-
2003-03-13historical
-
2002-11-08soldstatus $97,000
-
2002-09-19$185,000
-
1998-10-29soldstatus $112,000
-
1998-10-14historical
-
1998-08-10
ⓘ Source: listings_history table (triggers on properties + properties_extension) + one-shot
backfill from property_details.listing_events for pre-trigger history.
Tax reassessment forecast MD · Partial reset (capped growth)
- Current annual tax
- $3,496 · $291/mo
- Projected year-2 tax
- $4,364 · $364/mo
- Expected delta
- +$867/yr (+$72/mo · 24.8%)
ⓘ Screening estimate from a state-policy table — verify with the county assessor before closing.
Climate risk First Street
- Flood 1/10 Low FEMA zone X (unshaded) · 0% chance over 30 yrs
- Wildfire 1/10 Low
- Heat 8/10 Severe 7 d/yr ≥103°F today · 15 d/yr by 30 yrs out
- Wind 6/10 Major 67% chance of damaging wind over 30 yrs
- Air quality 5/10 Major 6 unhealthy d/yr today · 8 by 30 yrs out
Nearby sold comps map
Loading sold comps map…
Walkable amenities ~0.75 mi
Loading nearby amenities…
Taxation est. · year 1
- Rental income
- $54,702
- − Mortgage interest
- −$26,882
- − Property taxes
- −$3,496
- − Insurance
- −$2,400
- − Repairs & maintenance
- −$4,376
- − Management
- −$4,376
- − Depreciation
- −$13,961
- Taxable loss
- −$789
- Est. tax savings @ 24.0%
- +$189
- After-tax cash flow
- $7,308/yr
For passive investors: Depreciation is non-cash, so a rental often shows a tax loss while cash-flowing — sheltering income. Rental losses are passive: they offset passive income freely, and up to $25,000/yr can offset ordinary (W-2) income if you actively participate and your MAGI is under $100k (phasing out to $0 by $150k); unused losses carry forward. On sale, claimed depreciation is recaptured at up to 25%, and gains may owe capital-gains tax (a 1031 exchange can defer both). Figures are a year-1 estimate at your 24.0% rate — not tax advice; consult a CPA.
Schools (NCES district)
- District
- Anne Arundel County Public Schools
- NCES district ID
- 2400060
- Math proficiency
- 20% ▼ -21.00%
- Reading proficiency
- 37% ▼ -13.00%
- Median HH income
- $87,880
- Composite
- 28.52/100
- National rank
- #6733
- State rank
- #10 of 24 in MD
Livability — Riviera Beach
- Score
- 64/100
- State rank
- #280
- US rank
- #14429
Category grades
Schools grade is shown separately in the Schools card above.
Census & demographics
- Census place
- Riviera Beach, MD
- Population (ZIP)
- 6,593
Population outlook (Anne Arundel County) Hauer SSP2
- Today (2025)
- 617,384 people
- By 2030
- 642,094 · +4.0%
- By 2040
- 686,621 · +11.2%
- By 2050
- 723,031 · +17.1%
- By 2075
- 809,346 · +31.1%
- By 2100
- 837,658 · +35.7%
Race, ethnicity, and origin ACS 2023
- Neighborhood character
- Diverse neighborhood (Simpson 0.61)
- Race & ethnicity
- White 59% Black 18% Two or more races 13% Hispanic / Latino 8% Asian 4%
- Hispanic origin (detail)
- Mexican 4% Puerto Rican 3%
- Common ancestry
- Slovak 7% Romanian 2% Scotch-Irish 1%
- Foreign-born
- 7% · Canada, Jamaica
- Languages at home
- 91% English-only · Spanish 7% Tagalog/Filipino 1% Other Indo-European 1%
Political lean MEDSL · Anne Arundel
- 2024 margin
- D (+13.9) · D 55.7% · R 41.7% · Other 2.6%
- 2008→2024 swing
- +15.7pp toward D · 2008: -1.8pp · 2024: 13.9pp
- All cycles
- 2024: D+13.9 2020: D+14.5 2016: D+0.7 2012: R+0.9 2008: R+1.8
Not yet ingested
- Civics
- —
Market trends
- HPI YoY
- ▲ 7.75%
- Current HPI
- 318.79
- Rent YoY
- —
- Metro
- —
- State GDP YoY
- ▲ 2.97%
- F500 in state
- 12
Industry mix (Fortune 500 HQ in MD)
| Industry | F500 HQs | Revenue |
|---|---|---|
| Aerospace / Defense | 1 | $71B |
|
||
| Utilities | 1 | $25B |
|
||
| Hotels | 1 | $24B |
|
||
| Consumer Goods | 1 | $7B |
|
||
| Real Estate | 1 | $6B |
|
||
| Chemicals | 1 | $2B |
|
||
Price history
+337.4% since first listed12 events — show timeline
- 2026-05-18 Price Changed $489,900 BRIGHT MLS
- 2026-04-22 Price Changed $499,900 BRIGHT MLS
- 2026-04-14 Listed $529,900 BRIGHT MLS
- 2019-10-17 Sold (Public Records) $190,000 Public Records
- 2003-03-31 Sold (Public Records) $180,000 Public Records
- 2003-03-24 Sold (MLS) $180,000 MRIS
- 2003-03-13 Delisted — MRIS
- 2002-11-08 Sold (Public Records) $97,000 Public Records
- 2002-09-19 Listed $185,000 MRIS
- 1998-10-29 Sold (Public Records) $112,000 Public Records
- 1998-10-14 Delisted — MRIS
- 1998-08-10 Listed — MRIS
Property tax history
+6.7%/yrLatest (2025): $3,496 · +6.2% YoY. Source: county tax records.
Cash-flow waterfall
monthlySold comps — $/sqft
last 12 mo · ≤1 miLoading sold comps…