 🏷️ Likely Rental
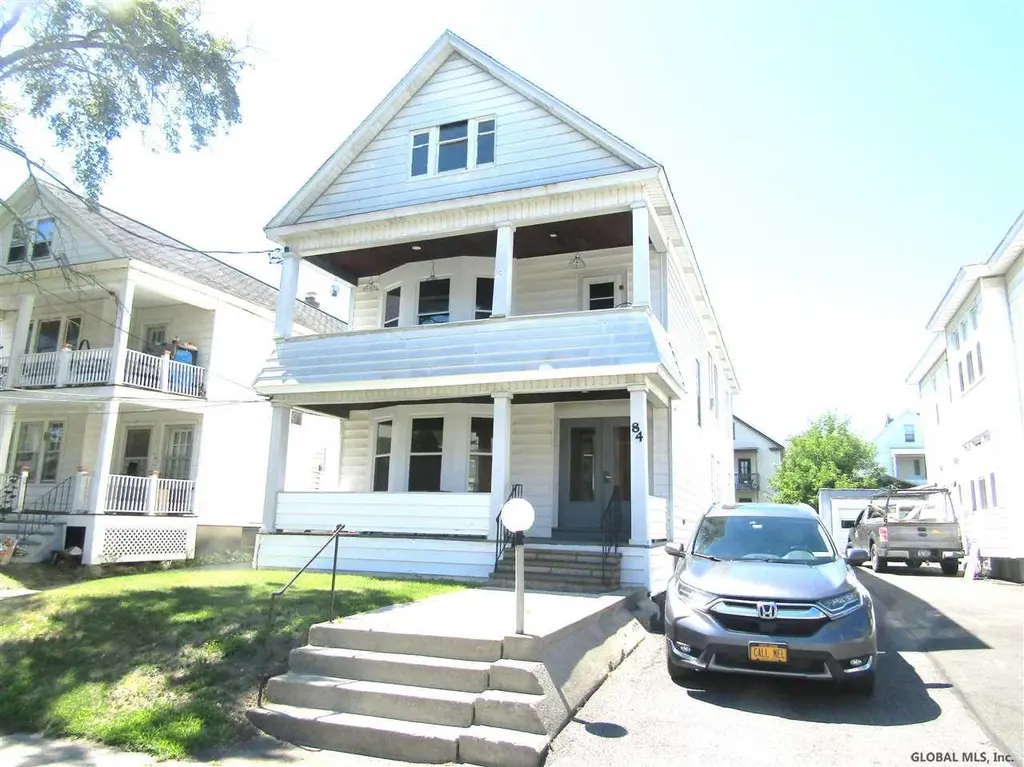
84 Winthrop Ave · Albany, NY
Flood risk 6/10 · Moderate
- FEMA flood zone
- X (unshaded)
- Chance of flooding over 30 yrs
- 0.68%
- Est. flood insurance / yr
- $473 – $860
Fire risk 1/10 · Minimal
- Est. fire insurance / yr
- $691 – $1,283
Heat risk 4/10 · Minor
- Hot days now (above 97°F)
- 7 days/yr
- Hot days in 30 yrs
- 16 days/yr
Wind risk 3/10 · Minor
- Chance of severe wind over 30 yrs
- 6.0%
Air-quality risk 1/10 · Minimal
- Unhealthy air days now
- 0 days/yr
- Unhealthy air days in 30 yrs
- 0 days/yr
Risk factors via First Street. Map © Google.
Why this score? — see what drove the B+ grade
The composite is a weighted blend of 9 inputs, each scored 0–100. Each bar is that input's sub-score; the figure is the points it added to the 100-point composite (weight × sub-score).
- Cash flow +30.0/30.0
- ARV discount +15.0/15.0
- 1% rule +10.0/10.0
- DSCR +10.0/10.0
- Livability +4.0/5.0
- Schools +3.2/10.0
- Rent growth +3.0/5.0
- Condition / age +2.5/5.0
- Appreciation +0.0/10.0
$264,800
🖨 Deal sheet (PDF) 📄 Offer letter ✓ Due diligence
Multi-family units
County records classify this as Multi-Family (2-4 Unit). Listing-text estimate: 3 units. confirmed
Listing remarks
Super clean 3 family in the heart of Albany. Walk to local shopping or the many major hospitals or Colleges. Unit 1 is vacant & features 4 BR's & 1.5 bath in addition to lot of natural wood work, wood floors, & custom built ins. Unit 2 has an immaculate long term tenant in place & features 2 BR's, eat in kitchen, & living room plus access to 2nd flr balcony. Unit 3 is a 1BR apartment w/ kitchen & LR. Full bsmnt features coin operated laundry. Sep utilities & off st parking. Rents could be a little higher. Excellent Condition
Key facts
- 4,791 sq ft lot
- Built 1935
- Listed 3 days
Neighborhood map
What this means for you Summary
Snapshot
- This is a 1×4.0bd/1.5ba + 1×2.0bd/1.0ba + 1×1.0bd/1.0ba units multifamily listed at $265k.
Deal economics
- At list price, monthly cash flow is $2k ($22k/yr) — positive. Per door: $598/mo.
- The deal already cash-flows at list — no discount required.
- Meets the 1% rule at list price ($5k rent vs $265k).
- Cap rate 14.4% vs local median 5.7% in Albany — top-decile yield for the area; either an underpriced asset or a hidden risk that comps aren't pricing in. Stress-test before assuming the spread holds.
Location & tenants
- Location reads 79/100 on livability (#129 in NY, #2,083 nationally) — a middle-class / working-renter tenant base. Strengths: amenities A+, commute A+, housing A+; Watch: employment C-, crime F.
- Albany City School District (urban): math 37% / reading 40% proficiency, ranked #543 of 590 in NY (top 92%) — families likely to look elsewhere, expect single-tenant / working-renter base with shorter leases; 66% free/reduced lunch — lower-income household profile, screen leases tightly.
- Zoned schools: Albany High School (math 74% / reading 67%, grade B+, #710 of 1,100 statewide, top 65%, 2,676 students, 69% FRL) — zoned schools at 69% FRL track the district average.
- Zoned-school proficiency averages 70% at this address vs 38% district-wide (+32 pts) — the actual schools serving this property are materially stronger than the Albany City School District average implies; a family-tenant draw the district grade alone would hide.
- Market conditions: Rents rising (+1.9%/yr); 124 active listings in the ZIP; 4 comparable units currently listed for rent nearby; rentals lingering (median 44d on market — plan ~5-8 weeks vacancy on turnover, expect pricing pressure); 100% of comp listings sitting > 30 days — soft ceiling on asking rent; solid renter incomes; 675 units permitted in Albany County in 2024 (451 in 5+ unit buildings).
- At $5,234/mo this rent would consume 76% of the median local household income ($83k/yr) (locally 1704% of renters already pay >50% of income on rent) — very limited rent-growth headroom before tenants either downsize or default.
Forward outlook
- Local home prices are declining (-3.0%/yr); year-one equity from $2k of loan paydown is wiped out by about $8k of value loss. Plan a longer hold.
- Albany County population projected at +9% by 2050 — modest demand growth; plan on rents tracking national, not racing it.
- At projected returns (-3.0% appreciation + 1.9% rent growth), your $74k cash investment doubles in ~5 years — after that, you're playing with house money.
Negotiation context
- Only 3 days on market — expect competitive offers; lowballing is unlikely to land.
Risks & watch-outs
- Watch-outs: property tax is 3.8% of price; built in 1935 — expect roof / HVAC / electrical / plumbing capex.
- Climate carrying-cost: major flood risk — expect insurance premiums to compound above CPI over the hold.
Questions for the listing agent
- Can we see the unit-by-unit rent roll, current vacancy, and any below-market leases? What's the average tenancy length?
- What capital expenditures (roof, boiler, parking lot, exteriors) have been made in the last 5 years, and what's planned in the next 2?
- Built in 1935 — when were the roof, HVAC, electrical panel, plumbing, and water heater last replaced?
- Property tax is high relative to price — has the assessment been appealed recently, and will the sale trigger a re-assessment?
- Is there a deadline driving the sale (1031 exchange, divorce, estate, relocation)? That informs how much negotiation room exists.
- Crime grade is F in this area — have there been break-ins, vandalism, or insurance claims at this property in the last 3 years? What carrier currently insures it and at what premium?
- What's the average days-on-market for RENTAL listings here right now (not sales)? A rising rental-DOM trend means longer vacancies and softer asking-rent achievability than the comps imply.
- What's the recent tenant-quality profile in this submarket — average credit score on applications, eviction rate, late-payment / NSF rate, and stable-employment percentage? A property-management company in the area should have these aggregated.
- How much new apartment / multifamily construction is in the pipeline within 1–3 miles? Heavy new supply (>2% of stock underway) typically softens rents 12–24 months out; light construction supports rent growth.
Investment metrics
- 1% rule
- 1.98% ✓
- Cap rate
- 14.43%
- Cash-on-cash
- 29.06%
- DSCR
- 2.29
- GRM
- 4.2
CMA / ARV
- ARV (on-the-fly)
- $353,804
- Comps found
- 6
Show comp detail 6 sales within ~0.75 mi
| Address | Dist | Beds/Ba | Sqft | Sold | Price | $/sf | Match |
|---|---|---|---|---|---|---|---|
| 481 Western Ave | 0.45mi | 4/4.0 | 3,056 (+4%) | 7mo | $330,000 | $108 | 65 |
| 115 Homestead Ave | 0.08mi | 5/2.0 (+1) | 2,641 (-10%) | 2mo | $380,000 | $144 | 65 |
| 112 N Allen St | 0.34mi | 4/3.0 | 2,504 (-14%) | 6mo | $350,000 | $140 | 52 |
| 1014 Washington Ave | 0.27mi | 5/2.0 (+1) | 2,600 (-11%) | 8mo | $315,000 | $121 | 50 |
| 166 N Allen St | 0.46mi | 4/2.0 | 2,514 (-14%) | 12mo | $165,000 | $66 | 38 |
| 95 Hunter Ave | 0.73mi | 5/3.0 (+1) | 3,208 (+10%) | 23mo | $235,000 | $73 | 22 |
Match score weights: distance 35% · size 25% · config 20% · recency 20%. Top-matched comps best support the ARV.
Projected returns pro-forma
-3.0% appreciation · 1.85% rent growth · sell at horizon
- IRR
- 22.0%
- Equity multiple
- 1.89×
- Total profit
- $65,848
- Equity at exit
- $39,483
- IRR
- 29.3%
- Equity multiple
- 3.46×
- Total profit
- $182,172
- Equity at exit
- $22,895
Cash invested: $74,144 (down + closing). Projections, not guarantees.
Landlord ↔ Tenant lean methodology
- Overall (STATE)
- 15 Strongly Tenant-Friendly
- State New York
- 15 Strongly Tenant-Friendly · D+10
- County
- — inherits STATE
- City
- — inherits STATE
ZIP-level market 12203
- Home prices YoY
- -31.0%
- Rents YoY
- 1.9%
- Active inventory
- 124
- Price-to-rent
- 10.6×
Monthly cashflow live
- Estimated rent
- $5,234 high interval (Pro) →
- Mortgage (P&I)
- −$1,389
- Tax from tax record
- −$840 /mo · $10,085/yr
- Insurance
- −$110
- HOA
- −$0
- Vacancy / Maint / Mgmt
- −$1,099
- Net cashflow
- $1,795
Break-even live
Sensitivity live
| Price | -10% $1,945 | -5% $1,870 | +0% $1,795 | +5% $1,720 | +10% $1,646 |
|---|---|---|---|---|---|
| Rent | -10% $1,382 | -5% $1,589 | +0% $1,795 | +5% $2,002 | +10% $2,209 |
| Rate | -1.0pp $1,929 | -0.5pp $1,863 | base $1,795 | +0.5pp $1,727 | +1.0pp $1,657 |
3-unit breakdown (identical units grouped — click to expand)
| Units | Beds | Baths | Est. rent |
|---|---|---|---|
| 1× unit | 4.0 | 1.5 | $2,077 |
| 1× unit | 2.0 | 1 | $1,669 |
| 1× unit | 1.0 | 1 | $1,487 |
| Total (3 units) | $5,234 | ||
UW: 25.0% down · 7.5% · 30yr · 1.5% tax · 5.0% vac · 8.0% maint · 8.0% mgmt
Financing live
Cash to close
- Down payment
- $66,200
- Closing costs
- $7,944
- Reserves months
- —
- Total cash needed
- —
Loan-product check · same deal, 3 products live
Conventional
25% down · 7.5% · 30yr
- Down + closing
- —
- Monthly P&I
- —
- Monthly cashflow
- —
- DSCR
- —
- Eligible?
- —
Personal DTI + credit; lowest rate.
DSCR
20% down · 8.5% · 30yr
- Down + closing
- —
- Monthly P&I
- —
- Monthly cashflow
- —
- DSCR
- —
- Eligible?
- —
No personal income docs; deal must DSCR.
Hard money
10% down · 12.0% · 12mo
- Down + closing
- —
- Monthly P&I
- —
- Monthly cashflow
- —
- DSCR
- —
- Eligible?
- —
Short-term bridge; refi at stabilization.
Rent comps 4 comps
| Address | Beds | Baths | Sqft | Rent | $/sqft | DOM | Units | Dist |
|---|---|---|---|---|---|---|---|---|
| 57 S Main Ave Albany, NY | 4.0 | 1.0 | 2695 | $1,600 | $0.59 | 44d | 1 | 0.62mi |
| 32 Peyster St Unit 1st floor Albany, NY | 3.0 | 2.0 | 2714 | $2,500 | $0.92 | 44d | 1 | 0.78mi |
| 154 Spring St Albany, NY | 3.0 | 1.0 | 2500 | $1,695 | $0.68 | 44d | 1 | 1.05mi |
| 257 Quail St Albany, NY | 4.0 | 2.5 | 2208 | $2,800 | $1.27 | 44d | 1 | 1.09mi |
Listing history 5 events
-
2023-03-29status Pending
-
2021-12-14status Pending
-
2018-09-28soldstatus $268,000
-
2018-07-13status Pend (Under Cntr)
-
2018-07-09$264,800 New
ⓘ Source: listings_history table (triggers on properties + properties_extension) + one-shot
backfill from property_details.listing_events for pre-trigger history.
Tax reassessment forecast NY · Partial reset (capped growth)
- Current annual tax
- $10,085 · $840/mo
- Projected year-2 tax
- $10,085 · $840/mo
- Expected delta
- $0/yr ($0/mo · 0.0%)
ⓘ Screening estimate from a state-policy table — verify with the county assessor before closing.
Climate risk First Street
- Flood 6/10 Major FEMA zone X (unshaded) · 68% chance over 30 yrs
- Wildfire 1/10 Low
- Heat 4/10 Moderate 7 d/yr ≥97°F today · 16 d/yr by 30 yrs out
- Wind 3/10 Moderate 6% chance of damaging wind over 30 yrs
- Air quality 1/10 Low 0 unhealthy d/yr today · 0 by 30 yrs out
Nearby sold comps map
Loading sold comps map…
Walkable amenities ~0.75 mi
Loading nearby amenities…
Taxation est. · year 1
- Rental income
- $62,808
- − Mortgage interest
- −$14,833
- − Property taxes
- −$10,085
- − Insurance
- −$1,324
- − Repairs & maintenance
- −$5,025
- − Management
- −$5,025
- − Depreciation
- −$7,703
- Taxable income
- $18,813
- Est. tax owed @ 24.0%
- −$4,515
- After-tax cash flow
- $17,030/yr
For passive investors: Depreciation is non-cash, so a rental often shows a tax loss while cash-flowing — sheltering income. Rental losses are passive: they offset passive income freely, and up to $25,000/yr can offset ordinary (W-2) income if you actively participate and your MAGI is under $100k (phasing out to $0 by $150k); unused losses carry forward. On sale, claimed depreciation is recaptured at up to 25%, and gains may owe capital-gains tax (a 1031 exchange can defer both). Figures are a year-1 estimate at your 24.0% rate — not tax advice; consult a CPA.
Schools (NCES district)
- District
- Albany City School District
- NCES district ID
- 3602460
- Math proficiency
- 37% ▲ 6.00%
- Reading proficiency
- 40% ▲ 7.00%
- Median HH income
- $40,568
- Composite
- 32.34/100
- National rank
- #5744
- State rank
- #543 of 590 in NY
Livability — Albany
- Score
- 79/100
- State rank
- #129
- US rank
- #2083
Category grades
Schools grade is shown separately in the Schools card above.
Census & demographics
- Census place
- Albany, NY
- County
- Albany County · 196,626 people
- City population
- 116,921
- Metro
- Albany-Schenectady-Troy, NY
- Population (ZIP)
- 30,771
- Household income
- $83,147
- Rent vs Own
- Severe rent burden
- 1704.0
Population outlook (Albany County) Hauer SSP2
- Today (2025)
- 320,794 people
- By 2030
- 327,401 · +2.1%
- By 2040
- 338,218 · +5.4%
- By 2050
- 348,467 · +8.6%
- By 2075
- 381,693 · +19.0%
- By 2100
- 393,809 · +22.8%
Race, ethnicity, and origin ACS 2023
- Neighborhood character
- Predominantly White (69%)
- Race & ethnicity
- White 69% Black 10% Asian 8% Hispanic / Latino 7% Two or more races 7%
- Hispanic origin (detail)
- Mexican 2% Puerto Rican 2%
- Common ancestry
- Romanian 5% Lithuanian 3% Slovak 2%
- Foreign-born
- 16% · Canada, China, South Korea
- Languages at home
- 82% English-only · Other Indo-European 6% Spanish 3% Russian/Polish/Slavic 2%
Political lean MEDSL · Albany
- 2024 margin
- Strong D (+25.8) · D 62.9% · R 37.1%
- 2008→2024 swing
- -3.6pp toward R · 2008: 29.4pp · 2024: 25.8pp
- All cycles
- 2024: D+25.8 2020: D+31.4 2016: D+24.3 2012: D+31.0 2008: D+29.4
Not yet ingested
- Civics
- —
Market trends
- HPI YoY
- ▼ -133.05%
- Current HPI
- 296.0467
- Rent YoY
- ▲ 1.85%
- Metro
- Albany-Schenectady-Troy, NY
- State GDP YoY
- ▲ 2.60%
- F500 in state
- 92
Industry mix (Fortune 500 HQ in NY)
| Industry | F500 HQs | Revenue |
|---|---|---|
| Financial Services | 10 | $950B |
|
||
| Consumer Goods | 9 | $162B |
|
||
| Insurance | 4 | $225B |
|
||
| Telecommunications | 2 | $144B |
|
||
| Pharmaceuticals | 2 | $112B |
|
||
| Media / Entertainment | 2 | $69B |
|
||
Price history
+1.2% since first listed5 events — show timeline
- 2023-03-29 Pending — Global MLS
- 2021-12-14 Pending — Global MLS
- 2018-09-28 Sold (Public Records) $268,000 Public Records
- 2018-07-13 Pending — Global MLS
- 2018-07-09 Listed $264,800 Global MLS
Property tax history
+1.7%/yrLatest (2025): $10,085 · -5.7% YoY. Source: county tax records.
Cash-flow waterfall
monthlySold comps — $/sqft
last 12 mo · ≤1 miLoading sold comps…