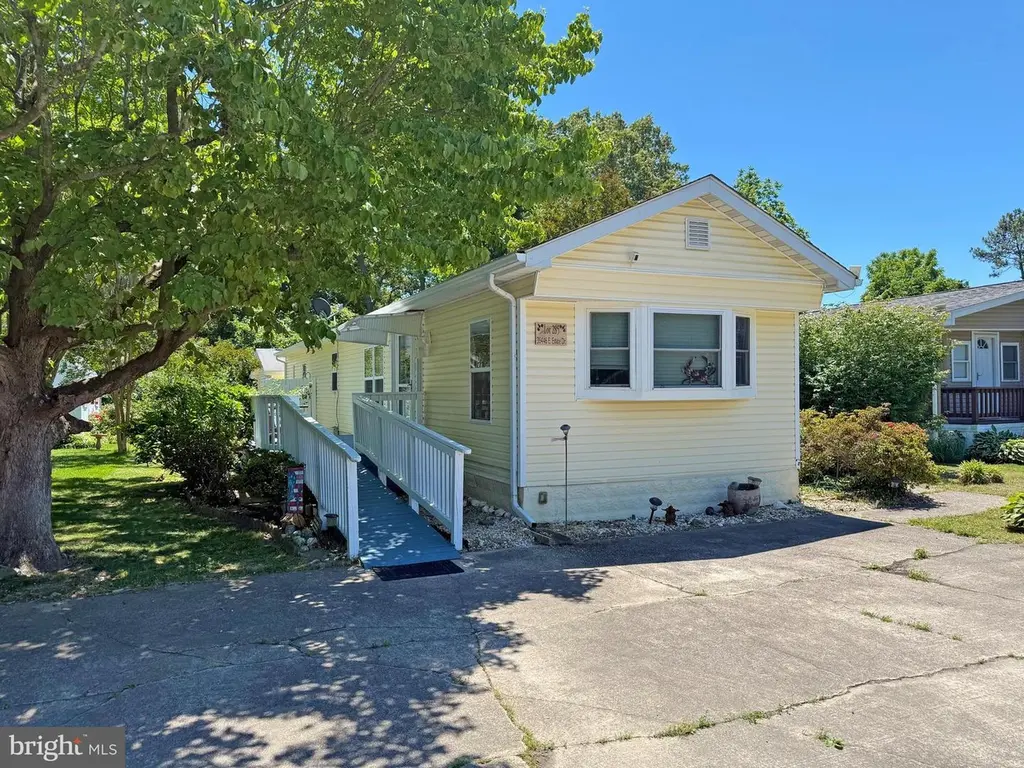
36438 E Estate Dr #285 · Rehoboth Beach, DE
Flood risk 1/10 · Minimal
- FEMA flood zone
- X (unshaded)
- Chance of flooding over 30 yrs
- 0.0%
- Est. flood insurance / yr
- $473 – $860
Fire risk 1/10 · Minimal
- Est. fire insurance / yr
- $476 – $884
Heat risk 8/10 · Major
- Hot days now (above 101°F)
- 7 days/yr
- Hot days in 30 yrs
- 17 days/yr
Wind risk 8/10 · Major
- Chance of severe wind over 30 yrs
- 80.0%
Air-quality risk 2/10 · Minimal
- Unhealthy air days now
- 1 days/yr
- Unhealthy air days in 30 yrs
- 1 days/yr
Risk factors via First Street. Map © Google.
Why this score? — see what drove the B+ grade
The composite is a weighted blend of 9 inputs, each scored 0–100. Each bar is that input's sub-score; the figure is the points it added to the 100-point composite (weight × sub-score).
- Cash flow +30.0/30.0
- ARV discount +15.0/15.0
- 1% rule +10.0/10.0
- DSCR +10.0/10.0
- Schools +4.2/10.0
- Condition / age +3.8/5.0
- Livability +3.6/5.0
- Rent growth +2.5/5.0
- Appreciation +0.0/10.0
$99,900
🖨 Deal sheet 📄 Offer letter ✓ Due diligence
Listing remarks
Big, open concept living area. This 14’x70’ Schult has the manufacturer’s 7’x18’ tip-out for approx. 1,100 sq. ft. Spacious living room adjoins the dining area. The kitchen has genuine oak cabinetry, including a wrap-around area near the dining room for extra cabinet/counter space. Plus, there’s a corner cabinet area in the living room next to the kitchen for even more storage. The galley-style kitchen has a disposal, dishwasher, gas range, microwave, and a fridge with ice maker. Popular split bedroom plan. Main bedroom is en Suite. That bath has a walk-in shower, linen closet, and a single-sink vanity. The main bedroom has a walk-in closet (and the bath&
Key facts
- Galley-style kitchen
- Linen closet
- Walk-in shower
Tags
Property features AI
Finance
- Other: Ground rent exists; Annual ground rent referenced in income/expense list
- Financial info: Monthly land lease payment
- HOA & community: Association amenities include exercise room, picnic area, outdoor pool; Association fees cover common area maintenance, lawn maintenance, pool(s), road maintenance, trash, and other services; Private roads (blacktop); park managed by Equity LifeStyle Properties, Inc.
Exterior
- Parking: Concrete driveway; Driveway parking with 3 spaces total
- Security: Double-pane insulated replacement windows
- Utilities: Public water and public sewer; Municipal trash service; Cable and satellite internet available
- Home design: Manufactured single-wide home (Schult); Estimated year built; Land lease community (ground rent exists)
- Construction: Vinyl siding; Shingle roof; Crawl space foundation with pillar/post/pier
- Exterior features: Patio(s) and porch(es); Awning(s); Outside shower; Outbuilding(s) including shed; Vinyl fencing; Property backs to trees; Community in-ground fenced pool
Interior
- Kitchen: Built-in microwave; Dishwasher; Disposal; Gas oven/range; Refrigerator
- Bedrooms: Two bedrooms on the main level
- Flooring: Carpet; Luxury vinyl plank; Vinyl
- Bathrooms: Two full bathrooms (main level)
- Heating & cooling: Heat pump(s); Wall unit heating; Ductless / mini-split cooling; Ceiling fans; Electric heating and hot water; 100 amp service with 220 volts
- Interior features: Open floor plan with combination dining/living area and dining area; Galley kitchen layout; Pantry; Master bathroom; Walk-in closet(s); Tub shower and walk-in shower; Ceiling fan(s); Window treatments; Insulated and storm doors; Drywall and paneled walls; Furnished
- Laundry & utility: Washer (front loading); Dryer (electric, front loading); Washer/dryer stacked; In-unit laundry on main floor; Water heater
Neighborhood map
What this means for you Summary
Snapshot
- This is a 2-bed/2.0-bath single-family listed at $100k. Condition is rated good.
Deal economics
- At list price, monthly cash flow is $1k ($13k/yr) — positive.
- The deal already cash-flows at list — no discount required.
- Meets the 1% rule at list price ($2k rent vs $100k).
- Cap rate 19.6% vs local median 1.1% in Rehoboth Beach — top-decile yield for the area; either an underpriced asset or a hidden risk that comps aren't pricing in. Stress-test before assuming the spread holds.
Location & tenants
- Location reads 71/100 on livability (#20 in DE) — a middle-class / working-renter tenant base. Strengths: schools A+, amenities A+, employment A+; Watch: crime F, commute F, cost of living F.
- Cape Henlopen School District (town): math 42% / reading 55% proficiency, ranked #5 of 26 in DE (top 19%) — families likely to look elsewhere, expect single-tenant / working-renter base with shorter leases.
- Market conditions: 331 active listings in the ZIP; 7 comparable units currently listed for rent nearby; rentals lingering (median 44d on market — plan ~5-8 weeks vacancy on turnover, expect pricing pressure); 57% of comp listings sitting > 30 days — soft ceiling on asking rent; solid renter incomes; 4,354 units permitted in Sussex County in 2024 (344 in 5+ unit buildings).
Forward outlook
- Local home prices are declining (-3.0%/yr); year-one equity from $691 of loan paydown is wiped out by about $3k of value loss. Plan a longer hold.
- Sussex County population projected at +25% by 2050 — long-run rental-demand tailwind backs the buy-and-hold thesis.
- At projected returns (-3.0% appreciation + 3.0% rent growth), your $28k cash investment doubles in ~3 years — after that, you're playing with house money.
Negotiation context
- Only 13 days on market — expect competitive offers; lowballing is unlikely to land.
Risks & watch-outs
- Climate carrying-cost: severe wind risk, 80% chance of damaging wind over 30y; extreme-heat days projected 7→17/yr by 2055 (HVAC capex compounding) — expect insurance premiums to compound above CPI over the hold.
Questions for the listing agent
- Built in 1979 — when were the roof, HVAC, electrical panel, plumbing, and water heater last replaced?
- Is there a deadline driving the sale (1031 exchange, divorce, estate, relocation)? That informs how much negotiation room exists.
- Schools are A-rated — typically a magnet for longer-tenancy family renters. What's the average tenant stay here, and is there a school-zone premium baked into asking?
- Crime grade is F in this area — have there been break-ins, vandalism, or insurance claims at this property in the last 3 years? What carrier currently insures it and at what premium?
- What's the average days-on-market for RENTAL listings here right now (not sales)? A rising rental-DOM trend means longer vacancies and softer asking-rent achievability than the comps imply.
- What's the recent tenant-quality profile in this submarket — average credit score on applications, eviction rate, late-payment / NSF rate, and stable-employment percentage? A property-management company in the area should have these aggregated.
- How much new for-sale + rental construction is in the pipeline within 1–3 miles? Heavy new supply typically softens prices + rents 12–24 months out; constrained supply supports both.
Investment metrics
- 1% rule
- 2.28% ✓
- Cap rate
- 19.62%
- Cash-on-cash
- 47.60%
- DSCR
- 3.12
- GRM
- 3.7
CMA / ARV
- ARV (on-the-fly)
- $120,554
- Comps found
- 12
Show comp detail 12 sales within ~0.75 mi
| Address | Dist | Beds/Ba | Sqft | Sold | Price | $/sf | Match |
|---|---|---|---|---|---|---|---|
| 36239 King St #13141 | 0.18mi | 2/2.0 | 1,075 (-3%) | 7mo | $117,500 | $109 | 81 |
| 36520 E Estate Dr #15859 | 0.15mi | 3/2.0 (+1) | 1,080 (-2%) | 10mo | $30,000 | $28 | 76 |
| 19935 Sea Air Ave #3263 | 0.20mi | 2/1.0 | 1,000 (-10%) | 3mo | $21,587 | $22 | 68 |
| 20054 Delaware Ave Unit K-66 | 0.13mi | 2/2.0 | 980 (-11%) | 8mo | $88,000 | $90 | 68 |
| 118 Whisperwood Ln | 0.37mi | 3/2.0 (+1) | 1,176 (+6%) | 0mo | $355,000 | $302 | 67 |
| 36104 Knight St #146 | 0.34mi | 2/2.0 | 980 (-11%) | 8mo | $68,400 | $70 | 59 |
| 19782 Princess St | 0.08mi | 3/2.0 (+1) | 1,267 (+15%) | 11mo | $183,000 | $144 | 58 |
| 19883 Atlantic Ave #54290 | 0.34mi | 2/2.0 | 960 (-13%) | 10mo | $115,000 | $120 | 54 |
| 36103 Knight St #155 | 0.36mi | 3/2.0 (+1) | 1,220 (+10%) | 10mo | $59,900 | $49 | 53 |
| 29 Baybreeze Rd Unit C-27 | 0.71mi | 3/1.5 (+1) | 980 (-11%) | 5mo | $25,000 | $26 | 37 |
| 112 Strawberry Way | 0.67mi | 3/1.0 (+1) | 960 (-13%) | 3mo | $350,000 | $365 | 35 |
| 113 Chesapeake Dr | 0.73mi | 3/1.0 (+1) | 960 (-13%) | 10mo | $375,000 | $391 | 27 |
Match score weights: distance 35% · size 25% · config 20% · recency 20%. Top-matched comps best support the ARV.
Projected returns pro-forma
-3.0% appreciation · 3.0% rent growth · sell at horizon
- IRR
- 45.0%
- Equity multiple
- 2.95×
- Total profit
- $54,519
- Equity at exit
- $14,895
- IRR
- 50.9%
- Equity multiple
- 5.96×
- Total profit
- $138,617
- Equity at exit
- $8,638
Cash invested: $27,972 (down + closing). Projections, not guarantees.
Landlord ↔ Tenant lean methodology
- Overall (STATE)
- 70 Landlord-Friendly
- State Delaware
- 70 Landlord-Friendly · D+7
- County
- — inherits STATE
- City
- — inherits STATE
ZIP-level market 19971
- Active inventory
- 331
- Price-to-rent
- 3.7×
Monthly cashflow live
- Estimated rent
- $2,278 high interval (Pro) →
- Mortgage (P&I)
- −$524
- Tax est. 1.5%
- −$125 /mo · $1,498/yr
- Insurance
- −$42
- HOA
- −$0
- Vacancy / Maint / Mgmt
- −$478
- Net cashflow
- $1,110
Break-even live
UW: 25.0% down · 7.5% · 30yr · 1.5% tax · 5.0% vac · 8.0% maint · 8.0% mgmt
Financing live
Cash to close
- Down payment
- $24,975
- Closing costs
- $2,997
- Reserves months
- —
- Total cash needed
- —
Loan-product check · same deal, 3 products live
Conventional
25% down · 7.5% · 30yr
- Down + closing
- —
- Monthly P&I
- —
- Monthly cashflow
- —
- DSCR
- —
- Eligible?
- —
Personal DTI + credit; lowest rate.
DSCR
20% down · 8.5% · 30yr
- Down + closing
- —
- Monthly P&I
- —
- Monthly cashflow
- —
- DSCR
- —
- Eligible?
- —
No personal income docs; deal must DSCR.
Hard money
10% down · 12.0% · 12mo
- Down + closing
- —
- Monthly P&I
- —
- Monthly cashflow
- —
- DSCR
- —
- Eligible?
- —
Short-term bridge; refi at stabilization.
Rent comps 7 comps
| Address | Beds | Baths | Sqft | Rent | $/sqft | DOM | Units | Dist |
|---|---|---|---|---|---|---|---|---|
| 107 Strawberry Way Rehoboth Beach, DE | 3.0 | 2.0 | 1025 | $2,750 | $2.68 | 43d | 1 | 0.71mi |
| 35948 Haven Dr #201 Rehoboth Beach, DE | 2.0 | 2.0 | 858 | $1,800 | $2.10 | 20d | 1 | 0.83mi |
| 36400 Warwick Dr Rehoboth Beach, DE | 3.0 | 2.5 | 792 | $3,500 | $4.42 | 43d | 1 | 0.84mi |
| 300 Pebble Dr #318 Rehoboth Beach, DE | 2.0 | 2.0 | 940 | $1,800 | $1.91 | 20d | 1 | 0.89mi |
| 3500 Sanibel Cir #3516 Rehoboth Beach, DE | 2.0 | 2.0 | 1150 | $2,000 | $1.74 | 20d | 1 | 0.98mi |
| 3300 Sanibel Cir #3301 Rehoboth Beach, DE | 3.0 | 2.0 | 1395 | $2,100 | $1.51 | 43d | 1 | 1.06mi |
| 32015 Azure Ave Rehoboth Beach, DE | 1.0–3.0 | 1.0–2.0 | 1054 | $2,095 | $1.99 | 43d | 1 | 1.23mi |
Listing history 6 events
-
2026-06-18days on market $99,900 Active 13 DOM
-
2026-06-17days on market $99,900 Active 12 DOM
-
2026-06-16days on market $99,900 Active 11 DOM
-
2026-06-15days on market $99,900 Active 10 DOM
-
2026-06-14remarks 663-char remark
-
2026-06-14$99,900 Active 8 DOM
ⓘ Source: listings_history table (triggers on properties + properties_extension) + one-shot
backfill from property_details.listing_events for pre-trigger history.
Climate risk First Street
- Flood 1/10 Low FEMA zone X (unshaded) · 0% chance over 30 yrs
- Wildfire 1/10 Low
- Heat 8/10 Severe 7 d/yr ≥101°F today · 17 d/yr by 30 yrs out
- Wind 8/10 Severe 80% chance of damaging wind over 30 yrs
- Air quality 2/10 Low 1 unhealthy d/yr today · 1 by 30 yrs out
Nearby sold comps map
Loading sold comps map…
Walkable amenities ~0.75 mi
Loading nearby amenities…
Taxation est. · year 1
- Rental income
- $27,342
- − Mortgage interest
- −$5,596
- − Property taxes
- −$1,498
- − Insurance
- −$500
- − Repairs & maintenance
- −$2,187
- − Management
- −$2,187
- − Depreciation
- −$2,906
- Taxable income
- $12,467
- Est. tax owed @ 24.0%
- −$2,992
- After-tax cash flow
- $10,323/yr
For passive investors: Depreciation is non-cash, so a rental often shows a tax loss while cash-flowing — sheltering income. Rental losses are passive: they offset passive income freely, and up to $25,000/yr can offset ordinary (W-2) income if you actively participate and your MAGI is under $100k (phasing out to $0 by $150k); unused losses carry forward. On sale, claimed depreciation is recaptured at up to 25%, and gains may owe capital-gains tax (a 1031 exchange can defer both). Figures are a year-1 estimate at your 24.0% rate — not tax advice; consult a CPA.
Condition & rehab AI · 12 photos
This home is in good condition with a good condition score of 75. It has a cosmetic rehab level and requires minor maintenance and updates to enhance its value.
Value-add opportunities
- Both Paint exterior siding — Enhances curb appeal and value.
- Both Replace worn-out flooring — Improves living space and rental appeal.
- Both Update kitchen appliances — Modernizes kitchen and attracts buyers/renters.
- Both Install new windows — Improves energy efficiency and aesthetics.
Renovation cost estimate screening
Value-add ROI direction
- Both Paint exterior siding — Enhances curb appeal and value. ↑
- Both Replace worn-out flooring — Improves living space and rental appeal. ↑
- Both Update kitchen appliances — Modernizes kitchen and attracts buyers/renters. ↑
- Both Install new windows — Improves energy efficiency and aesthetics. ↑
ⓘ Cost ranges are severity-bucket heuristics (US national rule-of-thumb). Get contractor quotes + a written scope before underwriting a rehab budget.
Schools (NCES district)
- District
- Cape Henlopen School District
- NCES district ID
- 1000170
- Math proficiency
- 42% ▼ -14.00%
- Reading proficiency
- 55% ▼ -10.00%
- Median HH income
- $60,196
- Composite
- 42.47/100
- National rank
- #3214
- State rank
- #5 of 26 in DE
Livability — Rehoboth Beach
- Score
- 71/100
- State rank
- #20
- US rank
- #6520
Category grades
Schools grade is shown separately in the Schools card above.
Census & demographics
- County
- Sussex County · 82,708 people
- City population
- 14,886
- Metro
- Salisbury, MD-DE
- Population (ZIP)
- 14,886
- Household income
- $102,146
- Rent vs Own
- Severe rent burden
- 317.0
Population outlook (Sussex County) Hauer SSP2
- Today (2025)
- 248,853 people
- By 2030
- 264,464 · +6.3%
- By 2040
- 290,980 · +16.9%
- By 2050
- 311,259 · +25.1%
- By 2075
- 352,488 · +41.6%
- By 2100
- 367,406 · +47.6%
Race, ethnicity, and origin ACS 2023
- Neighborhood character
- Predominantly White (88%)
- Race & ethnicity
- White 88% Black 4% Two or more races 4% Hispanic / Latino 3% Asian 2%
- Common ancestry
- Romanian 5% Slovak 3% Italian 3%
- Foreign-born
- 6% · Canada, China
- Languages at home
- 95% English-only · Spanish 2% Russian/Polish/Slavic 1% French/Haitian/Cajun 1%
Political lean MEDSL · Sussex
- 2024 margin
- R (+11.0) · D 43.9% · R 54.9% · Other 1.2%
- 2008→2024 swing
- -2.4pp toward R · 2008: -8.6pp · 2024: -11.0pp
- All cycles
- 2024: R+11.0 2020: R+11.2 2016: R+22.0 2012: R+13.0 2008: R+8.6
Not yet ingested
- Civics
- —
Market trends
- HPI YoY
- ▼ -220.39%
- Current HPI
- 353.3977
- Rent YoY
- —
- Metro
- Salisbury, MD-DE
- State GDP YoY
- —
- F500 in state
- 0
Price history
1 event — show timeline
- 2026-06-05 Listed $99,900 BRIGHT MLS
Cash-flow waterfall
monthlySold comps — $/sqft
last 12 mo · ≤1 miLoading sold comps…