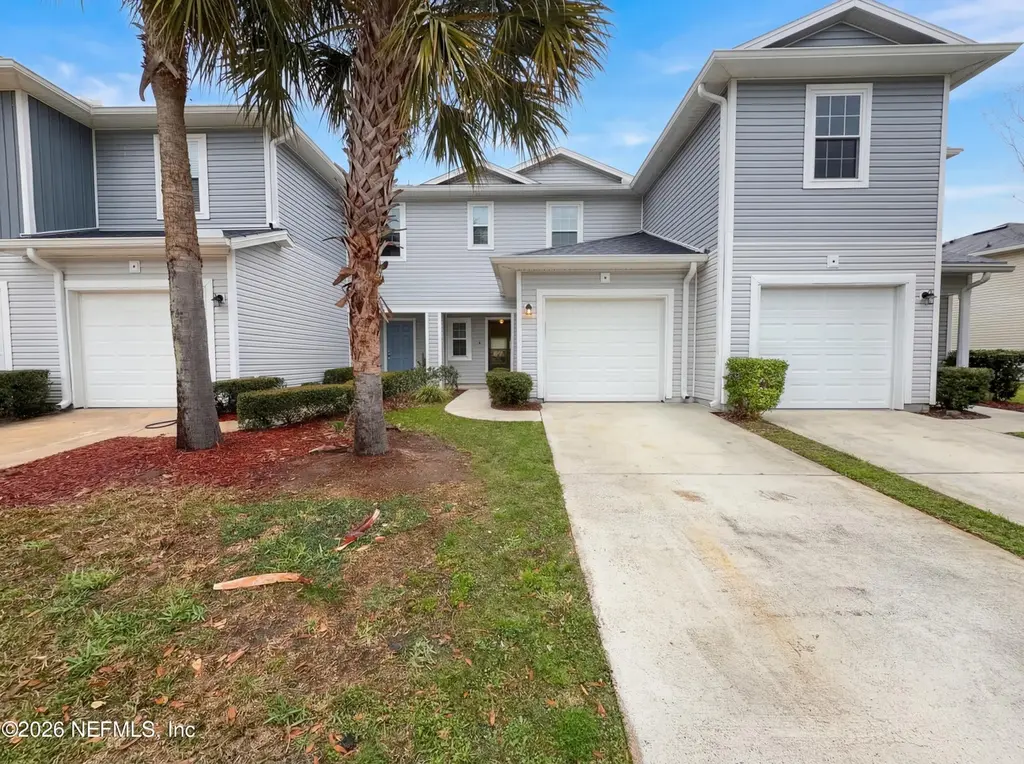
1539 Biscayne Bay Dr · Jacksonville, FL
Flood risk 1/10 · Minimal
- FEMA flood zone
- X (unshaded)
- Chance of flooding over 30 yrs
- 0.0%
- Est. flood insurance / yr
- $507 – $1,088
Fire risk 6/10 · Moderate
- Est. fire insurance / yr
- $947 – $1,759
Heat risk 9/10 · Severe
- Hot days now (above 107°F)
- 7 days/yr
- Hot days in 30 yrs
- 21 days/yr
Wind risk 9/10 · Severe
- Chance of severe wind over 30 yrs
- 99.0%
Air-quality risk 4/10 · Minor
- Unhealthy air days now
- 6 days/yr
- Unhealthy air days in 30 yrs
- 6 days/yr
Risk factors via First Street. Map © Google.
Why this score? — see what drove the D+ grade
The composite is a weighted blend of 9 inputs, each scored 0–100. Each bar is that input's sub-score; the figure is the points it added to the 100-point composite (weight × sub-score).
- ARV discount +15.0/15.0
- Cash flow +13.0/30.0
- 1% rule +5.0/10.0
- Livability +4.2/5.0
- DSCR +3.9/10.0
- Schools +3.9/10.0
- Condition / age +2.5/5.0
- Rent growth +2.4/5.0
- Appreciation +0.0/10.0
$167,000
🖨 Deal sheet (PDF) 📄 Offer letter ✓ Due diligence
Listing remarks
Situated on 1539 Biscayne Bay Dr, the interior layout provides a functional arrangement of square footage. Neutral paint covers the walls while laminate flooring extends throughout the main living areas. The kitchen contains cabinetry with quartz countertops. Lighting fixtures hang from the ceiling in each room. The exterior features concrete siding. Don't miss out on this gem! Included 100-Day Home Warranty with buyer activation
Key facts
- Kitchen cabinetry
- Laminate flooring
- Quartz countertops
Tags
Property features AI
Finance
- HOA & community: Homeowners association (Biscayne Bay Homeowners Association, Inc); Quarterly HOA fee; HOA fee: $485; Community clubhouse; Not a senior community
Exterior
- Parking: Attached garage; 1-car garage
- Utilities: Public sewer; Electricity connected; Sewer connected; Water connected
- Home design: Townhouse; Two levels; Attached property
- Exterior features: Shingle roof; Private pool: No
Interior
- Kitchen: Microwave
- Bedrooms: 2 bedrooms
- Flooring: Carpet
- Bathrooms: 2 full bathrooms; 1 half bathroom
- Heating & cooling: Central heating (electric); Central air conditioning
- Interior features: Microwave; Other built-in appliance(s)
Neighborhood map
What this means for you Summary
Snapshot
- This is a 2-bed/3.0-bath single-family listed at $167k.
Deal economics
- At list price, monthly cash flow is $-10 ($-114/yr) — negative.
- To cash-flow at today's rent, offer at most $165k (1.0% below list).
- Meets the 1% rule at list price ($2k rent vs $167k).
- Recommended offer: $152k (9.0% below list) — sets the bar for market timing.
- Cap rate 6.2% vs local median 3.9% in Jacksonville — top-decile yield for the area; either an underpriced asset or a hidden risk that comps aren't pricing in. Stress-test before assuming the spread holds.
Location & tenants
- Location reads 83/100 on livability (#50 in FL, #911 nationally) — a professional / high-income tenant draw. Strengths: amenities A+, commute A+, housing A+.
- Duval (urban): math 46% / reading 45% proficiency, ranked #48 of 73 in FL (top 66%) — families likely to look elsewhere, expect single-tenant / working-renter base with shorter leases.
- Zoned schools: Biscayne Elementary School (math 58% / reading 39%, grade D, #1,152 of 2,144 statewide, top 55%, 796 students, 62% FRL); Highlands Middle School (math 31% / reading 21%, grade F, #506 of 571 statewide, top 89%, 697 students, 73% FRL); First Coast High School (math 18% / reading 33%, grade F, #499 of 667 statewide, top 75%, 2,117 students, 49% FRL).
- Zoned-school proficiency averages 33% at this address vs 46% district-wide (-12 pts) — the specific schools serving this property underperform the Duval average; the district grade overstates school quality for this exact location.
- Market conditions: Rents soft (-0.4%/yr); 735 active listings in the ZIP; 16 comparable units currently listed for rent nearby; rentals leasing fast (median 13d on market — plan ~1-2 weeks tenant-placement turnaround); 6,503 units permitted in Duval County in 2024 (1,131 in 5+ unit buildings).
Forward outlook
- Local home prices are declining (-3.0%/yr); year-one equity from $1k of loan paydown is wiped out by about $5k of value loss. Plan a longer hold.
- Duval County population projected at +19% by 2050 — long-run rental-demand tailwind backs the buy-and-hold thesis.
Negotiation context
- It's been on market 96 days — a 9% lower offer ($152k) is reasonable based on typical stale-listing flexibility.
- Current owner paid $141k; 18% above their basis — modest negotiation headroom, anchor on the comps not their cost.
Risks & watch-outs
- Climate carrying-cost: severe wind risk, 99% chance of damaging wind over 30y; major wildfire risk; extreme-heat days projected 7→21/yr by 2055 (HVAC capex compounding) — expect insurance premiums to compound above CPI over the hold.
Questions for the listing agent
- What do current leases actually rent for vs. the listed asking? Can we see a recent rent roll and the last 12 months of T-12 income?
- It's been on market 96 days. Have you received any prior offers? Is the seller open to a 9% concession, seller financing, or rate buy-down credit?
- What does the HOA fee cover, when was the last increase, and are there any pending special assessments or reserve-fund shortfalls?
- Why hasn't it sold? Are there any deal-killer items the seller is aware of (foundation, flood, title, zoning, code violations)?
- Is there a deadline driving the sale (1031 exchange, divorce, estate, relocation)? That informs how much negotiation room exists.
- Schools are B-rated — typically a magnet for longer-tenancy family renters. What's the average tenant stay here, and is there a school-zone premium baked into asking?
- The area grade is low — what's the realistic commute time and amenity access for the typical tenant pool here? Any planned neighborhood developments (good or bad) we should know about?
- What's the average days-on-market for RENTAL listings here right now (not sales)? A rising rental-DOM trend means longer vacancies and softer asking-rent achievability than the comps imply.
- What's the recent tenant-quality profile in this submarket — average credit score on applications, eviction rate, late-payment / NSF rate, and stable-employment percentage? A property-management company in the area should have these aggregated.
- How much new for-sale + rental construction is in the pipeline within 1–3 miles? Heavy new supply typically softens prices + rents 12–24 months out; constrained supply supports both.
Investment metrics
- 1% rule
- 1.00% ✓
- Cap rate
- 6.22%
- Cash-on-cash
- -0.24%
- DSCR
- 0.99
- GRM
- 8.3
CMA / ARV
- ARV (on-the-fly)
- $236,680
- Comps found
- 8
Show comp detail 8 sales within ~0.75 mi
| Address | Dist | Beds/Ba | Sqft | Sold | Price | $/sf | Match |
|---|---|---|---|---|---|---|---|
| 11755 Kingfisher Ln E | 0.47mi | 3/2.0 (+1) | 1,248 (+2%) | 2mo | $245,000 | $196 | 64 |
| 1446 Shearwater Dr | 0.37mi | 3/2.0 (+1) | 1,248 (+2%) | 14mo | $200,000 | $160 | 59 |
| 1438 Shearwater Dr | 0.38mi | 3/2.0 (+1) | 1,252 (+3%) | 13mo | $243,000 | $194 | 58 |
| 1589 Shearwater Dr | 0.29mi | 3/2.0 (+1) | 1,274 (+4%) | 20mo | $249,000 | $195 | 53 |
| 11788 Tumbleweed Way | 0.55mi | 3/2.0 (+1) | 1,200 (-2%) | 14mo | $256,000 | $213 | 51 |
| 1379 High Plains Dr W | 0.55mi | 3/2.0 (+1) | 1,270 (+4%) | 18mo | $245,000 | $193 | 44 |
| 11722 Kingfisher Ln E | 0.52mi | 2/1.0 | 1,064 (-13%) | 18mo | $187,000 | $176 | 32 |
| 1431 Raven Dr S | 0.53mi | 3/1.5 (+1) | 1,371 (+12%) | 16mo | $150,000 | $109 | 31 |
Match score weights: distance 35% · size 25% · config 20% · recency 20%. Top-matched comps best support the ARV.
Projected returns pro-forma
-3.0% appreciation · 0.0% rent growth · sell at horizon
- IRR
- -20.6%
- Equity multiple
- 0.31×
- Total profit
- $-32,438
- Equity at exit
- $24,900
- IRR
- -24.4%
- Equity multiple
- -0.01×
- Total profit
- $-47,435
- Equity at exit
- $14,439
Cash invested: $46,760 (down + closing). Projections, not guarantees.
Landlord ↔ Tenant lean methodology
- Overall (STATE)
- 87 Strongly Landlord-Friendly
- State Florida
- 87 Strongly Landlord-Friendly · R+3
- County
- — inherits STATE
- City
- — inherits STATE
ZIP-level market 32218
- Home prices YoY
- -25.7%
- Rents YoY
- -0.4%
- Active inventory
- 735
- Price-to-rent
- 8.3×
Monthly cashflow live
- Estimated rent
- $1,673 high interval (Pro) →
- Mortgage (P&I)
- −$876
- Tax from tax record
- −$224 /mo · $2,691/yr
- Insurance
- −$70
- HOA
- −$162
- Vacancy / Maint / Mgmt
- −$351
- Net cashflow
- $-10
Break-even live
Sensitivity live
| Price | -10% $85 | -5% $38 | +0% $-10 | +5% $-57 | +10% $-104 |
|---|---|---|---|---|---|
| Rent | -10% $-142 | -5% $-76 | +0% $-10 | +5% $57 | +10% $123 |
| Rate | -1.0pp $75 | -0.5pp $33 | base $-10 | +0.5pp $-53 | +1.0pp $-97 |
UW: 25.0% down · 7.5% · 30yr · 1.5% tax · 5.0% vac · 8.0% maint · 8.0% mgmt
Financing live
Cash to close
- Down payment
- $41,750
- Closing costs
- $5,010
- Reserves months
- —
- Total cash needed
- —
Loan-product check · same deal, 3 products live
Conventional
25% down · 7.5% · 30yr
- Down + closing
- —
- Monthly P&I
- —
- Monthly cashflow
- —
- DSCR
- —
- Eligible?
- —
Personal DTI + credit; lowest rate.
DSCR
20% down · 8.5% · 30yr
- Down + closing
- —
- Monthly P&I
- —
- Monthly cashflow
- —
- DSCR
- —
- Eligible?
- —
No personal income docs; deal must DSCR.
Hard money
10% down · 12.0% · 12mo
- Down + closing
- —
- Monthly P&I
- —
- Monthly cashflow
- —
- DSCR
- —
- Eligible?
- —
Short-term bridge; refi at stabilization.
Rent comps 16 comps
| Address | Beds | Baths | Sqft | Rent | $/sqft | DOM | Units | Dist |
|---|---|---|---|---|---|---|---|---|
| 1544 Biscayne Bay Dr Unit 1544 Jacksonville, FL | 3.0 | 2.5 | 1424 | $2,000 | $1.40 | 14d | 1 | 0.01mi |
| 12450 Biscayne Blvd Jacksonville, FL | 1.0–3.0 | 1.0–2.0 | 932 | $1,266 | $1.36 | 25d | 1 | 0.14mi |
| 1660 Biscayne Bay Cir Jacksonville, FL | 2.0 | 2.5 | 1220 | $1,396 | $1.14 | 25d | 1 | 0.17mi |
| 1541 Kingfisher Ln N Jacksonville, FL | 3.0 | 2.0 | 1296 | $1,910 | $1.47 | 19d | 1 | 0.36mi |
| 12525 Tibbets Ln Jacksonville, FL | 1.0–3.0 | 1.0–2.0 | 977 | $1,610 | $1.65 | 3d | 54 | 0.61mi |
| 2346 Blossom Ridge Dr N Jacksonville, FL | 3.0 | 2.0 | 1334 | $1,819 | $1.36 | 12d | 1 | 0.98mi |
| 11332 Island Shore Dr W Jacksonville, FL | 3.0 | 1.5 | 1178 | $1,703 | $1.45 | 6d | 1 | 1.17mi |
| 950 Turtle Creek Dr S Jacksonville, FL | 3.0 | 2.0 | 1460 | $1,824 | $1.25 | 25d | 1 | 1.18mi |
| 11931 Alexandra Dr Jacksonville, FL | 3.0 | 2.0 | 1189 | $1,749 | $1.47 | 9d | 1 | 1.18mi |
| 12154 Alexandra Dr Jacksonville, FL | 3.0 | 2.0 | 1275 | $1,700 | $1.33 | 6d | 1 | 1.24mi |
| 11029 Traci Lynn Dr Jacksonville, FL | 3.0 | 2.0 | 1402 | $1,550 | $1.11 | 5d | 1 | 1.31mi |
| 11386 Margarets Landing Pl Jacksonville, FL | 3.0 | 2.0 | 1280 | $1,821 | $1.42 | 23d | 1 | 1.31mi |
| 2445 Dunn Ave Jacksonville, FL | 1.0–3.0 | 1.0–2.0 | 850 | $1,496 | $1.76 | 3d | 11 | 1.32mi |
| 745 Northpoint Cir N Jacksonville, FL | 2.0 | 2.0 | 897 | $1,600 | $1.78 | 25d | 1 | 1.32mi |
| 11050 Harts Rd Jacksonville, FL | 3.0 | 2.0–2.5 | 1145 | $1,511 | $1.32 | 4d | 10 | 1.41mi |
| 11211 Margarets Landing Pl Jacksonville, FL | 3.0 | 2.0 | 1280 | $1,826 | $1.43 | 9d | 1 | 1.45mi |
HOA detail
- Monthly dues
- $162 · $1,944/yr
Listing history 19 events
-
2026-06-21days on market $167,000 Active 96 DOM
-
2026-06-18days on market $167,000 Active 93 DOM
-
2026-06-17days on market $167,000 Active 92 DOM
-
2026-06-16days on market $167,000 Active 91 DOM
-
2026-06-15days on market $167,000 Active 90 DOM
-
2026-06-13pricedays on market $167,000 Active 87 DOM
-
2026-06-10days on market $170,000 Active 84 DOM
-
2026-06-08days on market $170,000 Active 83 DOM
-
2026-06-07days on market $170,000 Active 82 DOM
-
2026-06-03days on market $170,000 Active 78 DOM
-
2026-06-02days on market $170,000 Active 77 DOM
-
2026-06-01days on market $170,000 Active 76 DOM
-
2026-05-31days on market $170,000 Active 75 DOM
-
2026-05-07price $174,000
-
2026-04-23price $179,000
-
2026-04-02price $184,000
-
2026-03-17$189,000 Active
-
2026-03-09soldstatus $141,200
-
2005-05-21soldstatus $516,000
ⓘ Source: listings_history table (triggers on properties + properties_extension) + one-shot
backfill from property_details.listing_events for pre-trigger history.
Tax reassessment forecast FL · Resets to sale price
- Current annual tax
- $2,691 · $224/mo
- Projected year-2 tax
- $2,691 · $224/mo
- Expected delta
- $0/yr ($0/mo · 0.0%)
ⓘ Screening estimate from a state-policy table — verify with the county assessor before closing.
Climate risk First Street
- Flood 1/10 Low FEMA zone X (unshaded) · 0% chance over 30 yrs
- Wildfire 6/10 Major
- Heat 9/10 Extreme 7 d/yr ≥107°F today · 21 d/yr by 30 yrs out
- Wind 9/10 Extreme 99% chance of damaging wind over 30 yrs
- Air quality 4/10 Moderate 6 unhealthy d/yr today · 6 by 30 yrs out
Nearby sold comps map
Loading sold comps map…
Walkable amenities ~0.75 mi
Loading nearby amenities…
Taxation est. · year 1
- Rental income
- $20,082
- − Mortgage interest
- −$9,355
- − Property taxes
- −$2,691
- − Insurance
- −$835
- − Repairs & maintenance
- −$1,607
- − Management
- −$1,607
- − HOA
- −$1,944
- − Depreciation
- −$4,858
- Taxable loss
- −$2,814
- Est. tax savings @ 24.0%
- +$675
- After-tax cash flow
- $561/yr
For passive investors: Depreciation is non-cash, so a rental often shows a tax loss while cash-flowing — sheltering income. Rental losses are passive: they offset passive income freely, and up to $25,000/yr can offset ordinary (W-2) income if you actively participate and your MAGI is under $100k (phasing out to $0 by $150k); unused losses carry forward. On sale, claimed depreciation is recaptured at up to 25%, and gains may owe capital-gains tax (a 1031 exchange can defer both). Figures are a year-1 estimate at your 24.0% rate — not tax advice; consult a CPA.
Schools (NCES district)
- District
- Duval
- NCES district ID
- 1200480
- Math proficiency
- 46% ▼ -11.00%
- Reading proficiency
- 45% ▼ -4.00%
- Median HH income
- $48,987
- Composite
- 38.97/100
- National rank
- #4076
- State rank
- #48 of 73 in FL
Livability — Jacksonville
- Score
- 83/100
- State rank
- #50
- US rank
- #911
Category grades
Schools grade is shown separately in the Schools card above.
Census & demographics
- Census place
- Jacksonville, FL
- County
- Duval County · 1,015,274 people
- City population
- 979,034
- Metro
- Jacksonville, FL
- Population (ZIP)
- 72,905
- Household income
- $69,638
- Rent vs Own
- Severe rent burden
- 2289.0
Population outlook (Duval County) Hauer SSP2
- Today (2025)
- 1,013,010 people
- By 2030
- 1,059,228 · +4.6%
- By 2040
- 1,141,439 · +12.7%
- By 2050
- 1,205,258 · +19.0%
- By 2075
- 1,324,282 · +30.7%
- By 2100
- 1,319,620 · +30.3%
Race, ethnicity, and origin ACS 2023
- Neighborhood character
- Diverse neighborhood (Simpson 0.64)
- Race & ethnicity
- Black 48% White 35% Hispanic / Latino 9% Two or more races 8% Asian 2%
- Hispanic origin (detail)
- Mexican 2% Puerto Rican 4%
- Common ancestry
- Slovak 1% Lithuanian 1% Italian 1%
- Foreign-born
- 6% · Canada, Jamaica, Vietnam
- Languages at home
- 89% English-only · Spanish 6% French/Haitian/Cajun 1% Tagalog/Filipino 1%
Political lean MEDSL · Duval
- 2024 margin
- Toss-up / Even · D 48.7% · R 50.1% · Other 1.2%
- 2008→2024 swing
- +0.4pp no change · 2008: -1.9pp · 2024: -1.5pp
- All cycles
- 2024: R+1.5 2020: D+3.8 2016: R+1.5 2012: R+3.6 2008: R+1.9
Not yet ingested
- Civics
- —
Market trends
- HPI YoY
- ▼ -90.73%
- Current HPI
- 262.2329
- Rent YoY
- ▼ -0.40%
- Metro
- Jacksonville, FL
- State GDP YoY
- ▲ 3.28%
- F500 in state
- 36
Industry mix (Fortune 500 HQ in FL)
| Industry | F500 HQs | Revenue |
|---|---|---|
| Industrial Technology | 2 | $29B |
|
||
| Insurance | 2 | $17B |
|
||
| Retail | 1 | $60B |
|
||
| Technology Distribution | 1 | $58B |
|
||
| Homebuilding | 1 | $35B |
|
||
| Technology Manufacturing | 1 | $35B |
|
||
Price history
-66.3% since first listed6 events — show timeline
- 2026-05-07 Price Changed $174,000 realMLS
- 2026-04-23 Price Changed $179,000 realMLS
- 2026-04-02 Price Changed $184,000 realMLS
- 2026-03-17 Listed $189,000 realMLS
- 2026-03-09 Sold (Public Records) $141,200 Public Records
- 2005-05-21 Sold (Public Records) $516,000 Public Records
Property tax history
+9.2%/yrLatest (2025): $2,691 · +13.0% YoY. Source: county tax records.
Cash-flow waterfall
monthlySold comps — $/sqft
last 12 mo · ≤1 miLoading sold comps…