4259 Empress St · Palm Beach Gardens, FL
Flood risk 1/10 · Minimal
- FEMA flood zone
- X (unshaded)
- Chance of flooding over 30 yrs
- 0.0%
- Est. flood insurance / yr
- $507 – $1,088
Fire risk 1/10 · Minimal
- Est. fire insurance / yr
- $947 – $1,759
Heat risk 10/10 · Severe
- Hot days now (above 106°F)
- 7 days/yr
- Hot days in 30 yrs
- 24 days/yr
Wind risk 10/10 · Severe
- Chance of severe wind over 30 yrs
- 99.0%
Air-quality risk 2/10 · Minimal
- Unhealthy air days now
- 0 days/yr
- Unhealthy air days in 30 yrs
- 1 days/yr
Risk factors via First Street. Map © Google.
Why this score? — see what drove the D+ grade
The composite is a weighted blend of 9 inputs, each scored 0–100. Each bar is that input's sub-score; the figure is the points it added to the 100-point composite (weight × sub-score).
- Cash flow +16.7/30.0
- ARV discount +7.5/15.0
- DSCR +5.2/10.0
- Schools +4.3/10.0
- Livability +3.5/5.0
- 1% rule +3.3/10.0
- Rent growth +3.1/5.0
- Condition / age +2.5/5.0
- Appreciation +0.0/10.0
$560,000
🖨 Deal sheet (PDF) 📄 Offer letter ✓ Due diligence
Listing remarks
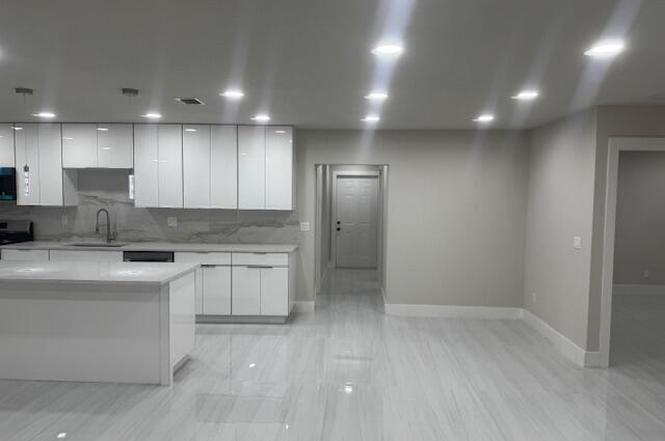
welcome to your new home in the heart of palm beach garden ! This spectacular remodeled house combines modern design , comfort and efficiency . Whit high quality finishes and a spacious distribution , it is the perfect option for those looking to move without the need for additional renovation FEATURED FEATURED Completely remodeled ready to live in moder kitchen with new cabinets and ceramic backsplash new tile floors thoughout the house updated bathrooms with elegant finishes skylights greater safety and naturallight new roof and recent air conditioning for great efficiency large backyard ideal for meetings or future extensions great view of the canal
Key facts
- 8,423 sq ft lot
- Garage
- Built 1967
Property features AI
Finance
- Other: Pets allowed with no restrictions
- HOA & community: No association amenities
Exterior
- Parking: Attached garage (1 covered garage space); Driveway and open parking (about 4 open spaces)
- Utilities: Public water; Public sewer; Three-phase electric; Sewer and water available
- Home design: Single-family residence; One story; Resale property; Faces south
- Construction: Stucco and CBS construction; Composition/shingle roof; Built on a foundation (standard)
- Exterior features: Open patio
Interior
- Kitchen: Dishwasher; Electric range; Microwave; Refrigerator
- Bedrooms: 4 bedrooms on the main level
- Bathrooms: 3 full bathrooms (all on the main level)
- Heating & cooling: Central heating; Central air conditioning
- Interior features: Kitchen island; Split bedroom layout; Unfurnished
Neighborhood map
What this means for you Summary
Snapshot
- This is a 5-bed/2.0-bath single-family listed at $560k.
Deal economics
- At list price, monthly cash flow is $352 ($4k/yr) — positive.
- The deal already cash-flows at list — no discount required.
- To meet the 1% rule (rent ≥ 1% of price), the offer needs to be $465k (17.0% below list).
- Recommended offer: $465k (17.0% below list) — sets the bar for 1% rule.
Location & tenants
- Location reads 69/100 on livability (#464 in FL) — a middle-class / working-renter tenant base. Strengths: crime A+, employment A+, housing A+; Watch: amenities F, commute F, cost of living F.
- Palm Beach (suburban): math 46% / reading 53% proficiency, ranked #34 of 73 in FL (top 47%) — families likely to look elsewhere, expect single-tenant / working-renter base with shorter leases.
- Zoned schools: Franklin Academy- Palm Beach Gardens (math 45% / reading 56%, grade D+, #1,055 of 2,144 statewide, top 50%, 1,046 students, 53% FRL, charter); Watson B. Duncan Middle School (math 54% / reading 59%, grade B, #171 of 571 statewide, top 30%, 1,157 students, 41% FRL); Palm Beach Gardens High School (math 19% / reading 40%, grade F, #447 of 667 statewide, top 68%, 2,570 students, 61% FRL) — zoned schools at 52% FRL track the district average.
- Market conditions: Rents rising (+2.5%/yr); 309 active listings in the ZIP; 12 comparable units currently listed for rent nearby; rentals at typical pace (median 26d on market — plan ~3-4 weeks tenant-placement turnaround); solid renter incomes; 3,974 units permitted in Palm Beach County in 2024 (1,012 in 5+ unit buildings).
- At $4,648/mo this rent would consume 59% of the median local household income ($95k/yr) (locally 1429% of renters already pay >50% of income on rent) — very limited rent-growth headroom before tenants either downsize or default.
Forward outlook
- Local home prices are declining (-3.0%/yr); year-one equity from $4k of loan paydown is wiped out by about $17k of value loss. Plan a longer hold.
- Palm Beach County population projected at +30% by 2050 — long-run rental-demand tailwind backs the buy-and-hold thesis.
Negotiation context
- It's been on market 125 days — a 12% lower offer ($493k) is reasonable based on typical stale-listing flexibility.
- 3 sale attempts; this cycle's ask has dropped $90k (14%) from the opening price — seller is motivated, your offer sets the floor, not the list.
- Current owner paid $31k; list at $560k implies a 1712% gain — meaningful room to come down on a strong offer.
Risks & watch-outs
- Climate carrying-cost: severe wind risk, 99% chance of damaging wind over 30y; extreme-heat days projected 7→24/yr by 2055 (HVAC capex compounding) — expect insurance premiums to compound above CPI over the hold.
Questions for the listing agent
- It's been on market 125 days. Have you received any prior offers? Is the seller open to a 17% concession, seller financing, or rate buy-down credit?
- Built in 1967 — when were the roof, HVAC, electrical panel, plumbing, and water heater last replaced?
- Why hasn't it sold? Are there any deal-killer items the seller is aware of (foundation, flood, title, zoning, code violations)?
- Is there a deadline driving the sale (1031 exchange, divorce, estate, relocation)? That informs how much negotiation room exists.
- Schools are B-rated — typically a magnet for longer-tenancy family renters. What's the average tenant stay here, and is there a school-zone premium baked into asking?
- The area grade is low — what's the realistic commute time and amenity access for the typical tenant pool here? Any planned neighborhood developments (good or bad) we should know about?
- What's the average days-on-market for RENTAL listings here right now (not sales)? A rising rental-DOM trend means longer vacancies and softer asking-rent achievability than the comps imply.
- What's the recent tenant-quality profile in this submarket — average credit score on applications, eviction rate, late-payment / NSF rate, and stable-employment percentage? A property-management company in the area should have these aggregated.
- How much new for-sale + rental construction is in the pipeline within 1–3 miles? Heavy new supply typically softens prices + rents 12–24 months out; constrained supply supports both.
Investment metrics
- 1% rule
- 0.83% ✗
- Cap rate
- 7.05%
- Cash-on-cash
- 2.70%
- DSCR
- 1.12
- GRM
- 10.0
CMA / ARV
No comps found within radius.
Projected returns pro-forma
-3.0% appreciation · 2.49% rent growth · sell at horizon
- IRR
- -12.6%
- Equity multiple
- 0.55×
- Total profit
- $-70,947
- Equity at exit
- $83,498
- IRR
- -4.3%
- Equity multiple
- 0.72×
- Total profit
- $-43,615
- Equity at exit
- $48,419
Cash invested: $156,800 (down + closing). Projections, not guarantees.
Landlord ↔ Tenant lean methodology
- Overall (STATE)
- 87 Strongly Landlord-Friendly
- State Florida
- 87 Strongly Landlord-Friendly · R+3
- County
- — inherits STATE
- City
- — inherits STATE
ZIP-level market 33410
- Rents YoY
- 2.5%
- Active inventory
- 309
- Price-to-rent
- 10.0×
Monthly cashflow live
- Estimated rent
- $4,648 high interval (Pro) →
- Mortgage (P&I)
- −$2,937
- Tax from tax record
- −$150 /mo · $1,798/yr
- Insurance
- −$233
- HOA
- −$0
- Vacancy / Maint / Mgmt
- −$976
- Net cashflow
- $352
Break-even live
Sensitivity live
| Price | -10% $669 | -5% $511 | +0% $352 | +5% $194 | +10% $35 |
|---|---|---|---|---|---|
| Rent | -10% $-15 | -5% $169 | +0% $352 | +5% $536 | +10% $720 |
| Rate | -1.0pp $634 | -0.5pp $495 | base $352 | +0.5pp $207 | +1.0pp $60 |
UW: 25.0% down · 7.5% · 30yr · 1.5% tax · 5.0% vac · 8.0% maint · 8.0% mgmt
Financing live
Cash to close
- Down payment
- $140,000
- Closing costs
- $16,800
- Reserves months
- —
- Total cash needed
- —
Loan-product check · same deal, 3 products live
Conventional
25% down · 7.5% · 30yr
- Down + closing
- —
- Monthly P&I
- —
- Monthly cashflow
- —
- DSCR
- —
- Eligible?
- —
Personal DTI + credit; lowest rate.
DSCR
20% down · 8.5% · 30yr
- Down + closing
- —
- Monthly P&I
- —
- Monthly cashflow
- —
- DSCR
- —
- Eligible?
- —
No personal income docs; deal must DSCR.
Hard money
10% down · 12.0% · 12mo
- Down + closing
- —
- Monthly P&I
- —
- Monthly cashflow
- —
- DSCR
- —
- Eligible?
- —
Short-term bridge; refi at stabilization.
Rent comps 12 comps
| Address | Beds | Baths | Sqft | Rent | $/sqft | DOM | Units | Dist |
|---|---|---|---|---|---|---|---|---|
| 9519 Birmingham Dr Palm Beach Gardens, FL | 4.0 | 2.0 | 1355 | $3,195 | $2.36 | 7d | 1 | 0.19mi |
| 4193 Hyacinth Cir N Palm Beach Gardens, FL | 4.0 | 2.0 | 1640 | $7,500 | $4.57 | 26d | 1 | 0.35mi |
| 4416 Fuschia Cir S Unit 1326855P Palm Beach Gardens, FL | 3.0–4.0 | 2.0–3.0 | 2066 | $7,108 | $3.44 | 0d | 2 | 0.35mi |
| 4317 Honeysuckle Ave Palm Beach Gardens, FL | 4.0 | 2.0 | 1885 | $3,291 | $1.75 | 15d | 1 | 0.40mi |
| 3836 Dove Landing Rd West Palm Beach, FL | 4.0 | 2.0 | 1790 | $3,400 | $1.90 | 26d | 1 | 0.43mi |
| 3836 Dove Landing Rd West Palm Beach, FL | 4.0 | 2.0 | 1790 | $3,400 | $1.90 | 9d | 1 | 0.43mi |
| 10044 Dasheen Ave Palm Beach Gardens, FL | 4.0 | 2.0 | 1642 | $4,500 | $2.74 | 26d | 1 | 0.62mi |
| 9130 E Highland Pines Blvd Unit 1326852P Palm Beach Gardens, FL | 2.0–4.0 | 2.0–4.0 | 1721 | $7,397 | $4.30 | 1d | 2 | 0.66mi |
| 337 Balsam St Palm Beach Gardens, FL | 4.0 | 2.0 | 1426 | $5,500 | $3.86 | 20d | 1 | 0.96mi |
| 343 Balsam St Palm Beach Gardens, FL | 4.0 | 2.0 | 1414 | $4,000 | $2.83 | 26d | 1 | 0.97mi |
| 379 Garden Blvd Palm Beach Gardens, FL | 4.0 | 2.0 | 1642 | $4,500 | $2.74 | 26d | 1 | 1.01mi |
| 810 Sandtree Dr Palm Beach Gardens, FL | 4.0 | 2.5 | 1800 | $3,400 | $1.89 | 26d | 1 | 1.16mi |
Listing history 24 events
-
2026-06-21days on market $560,000 Active 125 DOM
-
2026-06-18days on market $560,000 Active 122 DOM
-
2026-06-17pricedays on market $560,000 Active 121 DOM
-
2026-06-16days on market $582,000 Active 120 DOM
-
2026-06-15days on market $582,000 Active 119 DOM
-
2026-06-13days on market $582,000 Active 117 DOM
-
2026-06-09days on market $582,000 Active 113 DOM
-
2026-06-07days on market $582,000 Active 111 DOM
-
2026-06-04pricedays on market $582,000 Active 108 DOM
-
2026-06-03days on market $589,900 Active 107 DOM
-
2026-06-01days on market $589,900 Active 105 DOM
-
2026-05-31days on market $589,900 Active 104 DOM
-
2026-05-23status Active
-
2026-05-20status Pending
-
2026-05-08price $589,900
-
2026-04-27price $599,999
-
2026-04-20status Active
-
2026-04-17status Pending
-
2026-04-10price $605,555
-
2026-03-30price $619,000
-
2026-02-26price $629,999
-
2026-02-09$650,000 Active
-
2026-02-04historical $650,000
-
1970-01-01soldstatus $30,900
ⓘ Source: listings_history table (triggers on properties + properties_extension) + one-shot
backfill from property_details.listing_events for pre-trigger history.
Tax reassessment forecast FL · Resets to sale price
- Current annual tax
- $1,798 · $150/mo
- Projected year-2 tax
- $4,648 · $387/mo
- Expected delta
- +$2,850/yr (+$237/mo · 158.5%)
ⓘ Screening estimate from a state-policy table — verify with the county assessor before closing.
Climate risk First Street
- Flood 1/10 Low FEMA zone X (unshaded) · 0% chance over 30 yrs
- Wildfire 1/10 Low
- Heat 10/10 Extreme 7 d/yr ≥106°F today · 24 d/yr by 30 yrs out
- Wind 10/10 Extreme 99% chance of damaging wind over 30 yrs
- Air quality 2/10 Low 0 unhealthy d/yr today · 1 by 30 yrs out
Nearby sold comps map
Loading sold comps map…
Walkable amenities ~0.75 mi
Loading nearby amenities…
Taxation est. · year 1
- Rental income
- $55,780
- − Mortgage interest
- −$31,369
- − Property taxes
- −$1,798
- − Insurance
- −$2,800
- − Repairs & maintenance
- −$4,462
- − Management
- −$4,462
- − Depreciation
- −$16,291
- Taxable loss
- −$5,403
- Est. tax savings @ 24.0%
- +$1,297
- After-tax cash flow
- $5,524/yr
For passive investors: Depreciation is non-cash, so a rental often shows a tax loss while cash-flowing — sheltering income. Rental losses are passive: they offset passive income freely, and up to $25,000/yr can offset ordinary (W-2) income if you actively participate and your MAGI is under $100k (phasing out to $0 by $150k); unused losses carry forward. On sale, claimed depreciation is recaptured at up to 25%, and gains may owe capital-gains tax (a 1031 exchange can defer both). Figures are a year-1 estimate at your 24.0% rate — not tax advice; consult a CPA.
Schools (NCES district)
- District
- Palm Beach
- NCES district ID
- 1201500
- Math proficiency
- 46% ▼ -16.00%
- Reading proficiency
- 53% ▼ -4.00%
- Median HH income
- $53,943
- Composite
- 42.72/100
- National rank
- #3160
- State rank
- #34 of 73 in FL
Livability — Palm Beach Gardens
- Score
- 69/100
- State rank
- #464
- US rank
- #8366
Category grades
Schools grade is shown separately in the Schools card above.
Census & demographics
- Census place
- Palm Beach Gardens, FL
- County
- Palm Beach County · 1,438,312 people
- City population
- 96,294
- Metro
- Miami-Fort Lauderdale-Pompano Beach, FL
- Population (ZIP)
- 36,759
- Household income
- $94,530
- Rent vs Own
- Severe rent burden
- 1429.0
Population outlook (Palm Beach County) Hauer SSP2
- Today (2025)
- 1,637,487 people
- By 2030
- 1,743,255 · +6.5%
- By 2040
- 1,948,712 · +19.0%
- By 2050
- 2,132,979 · +30.3%
- By 2075
- 2,530,027 · +54.5%
- By 2100
- 2,706,979 · +65.3%
Race, ethnicity, and origin ACS 2023
- Neighborhood character
- Predominantly White (70%)
- Race & ethnicity
- White 70% Hispanic / Latino 15% Two or more races 13% Black 5% Asian 4%
- Hispanic origin (detail)
- Mexican 2% Puerto Rican 2% Cuban 3%
- Common ancestry
- Romanian 4% Lithuanian 3% Slovak 2%
- Foreign-born
- 17% · Canada, Jamaica, Vietnam
- Languages at home
- 78% English-only · Spanish 13% French/Haitian/Cajun 3% Other Indo-European 2%
Political lean MEDSL · Palm Beach
- 2024 margin
- Toss-up / Even · D 50.0% · R 49.2%
- 2008→2024 swing
- -22.1pp toward R · 2008: 22.9pp · 2024: 0.8pp
- All cycles
- 2024: D+0.8 2020: D+12.8 2016: D+15.3 2012: D+17.0 2008: D+22.9
Not yet ingested
- Civics
- —
Market trends
- HPI YoY
- ▼ -346.12%
- Current HPI
- 375.5381
- Rent YoY
- ▲ 2.49%
- Metro
- Miami-Fort Lauderdale-Pompano Beach, FL
- State GDP YoY
- ▲ 3.28%
- F500 in state
- 36
Industry mix (Fortune 500 HQ in FL)
| Industry | F500 HQs | Revenue |
|---|---|---|
| Industrial Technology | 2 | $29B |
|
||
| Insurance | 2 | $17B |
|
||
| Retail | 1 | $60B |
|
||
| Technology Distribution | 1 | $58B |
|
||
| Homebuilding | 1 | $35B |
|
||
| Technology Manufacturing | 1 | $35B |
|
||
Price history
+1809.1% since first listed12 events — show timeline
- 2026-05-23 Relisted — Beaches MLS
- 2026-05-20 Pending — Beaches MLS
- 2026-05-08 Price Changed $589,900 Beaches MLS
- 2026-04-27 Price Changed $599,999 Beaches MLS
- 2026-04-20 Relisted — Beaches MLS
- 2026-04-17 Pending — Beaches MLS
- 2026-04-10 Price Changed $605,555 Beaches MLS
- 2026-03-30 Price Changed $619,000 Beaches MLS
- 2026-02-26 Price Changed $629,999 Beaches MLS
- 2026-02-09 Listed $650,000 Beaches MLS
- 2026-02-04 Coming Soon $650,000 Beaches MLS
- 1970-01-01 Sold (Public Records) $30,900 Public Records
Property tax history
+1.0%/yrLatest (2025): $1,798 · +3.9% YoY. Source: county tax records.
Cash-flow waterfall
monthlySold comps — $/sqft
last 12 mo · ≤1 miLoading sold comps…