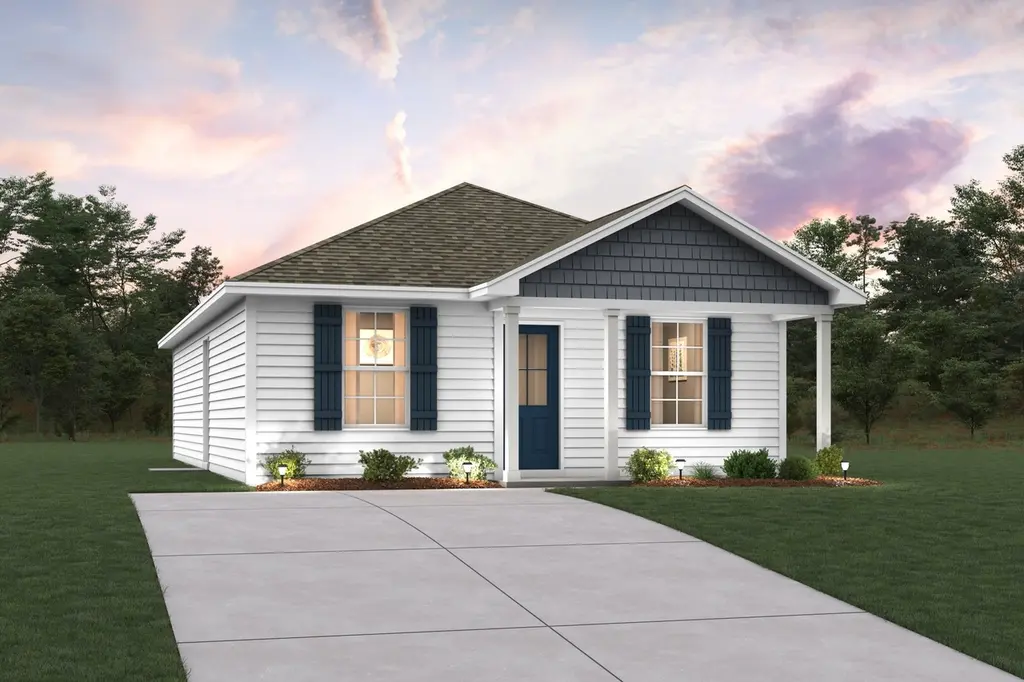
175 Mcarthur St · Crestview, FL
Flood risk No data
- FEMA flood zone
- —
- Chance of flooding over 30 yrs
- —
- Est. flood insurance / yr
- —
Fire risk No data
- Est. fire insurance / yr
- —
Heat risk No data
- Hot days now (above threshold)
- —
- Hot days in 30 yrs
- —
Wind risk No data
- Chance of severe wind over 30 yrs
- —
Air-quality risk No data
- Unhealthy air days now
- —
- Unhealthy air days in 30 yrs
- —
Risk factors via First Street. Map © Google.
Why this score? — see what drove the D grade
The composite is a weighted blend of 9 inputs, each scored 0–100. Each bar is that input's sub-score; the figure is the points it added to the 100-point composite (weight × sub-score).
- ARV discount +12.0/15.0
- Cash flow +11.1/30.0
- Schools +5.2/10.0
- Livability +3.8/5.0
- 1% rule +3.2/10.0
- DSCR +3.2/10.0
- Rent growth +2.5/5.0
- Condition / age +2.5/5.0
- Appreciation +0.0/10.0
$213,888
🖨 Deal sheet 📄 Offer letter ✓ Due diligence
Listing remarks MLS
3 bed | 2 bath | 1114 sqft
Key facts
- 6,969 sq ft lot
- Built 2026
- Listed 14 days
Property features AI
Finance
- Other: Zoned for single-family residential
- Financial info: Financial details not provided
- HOA & community: Subdivision: Cottages at Crestview
Exterior
- Parking: Parking details not provided
- Security: Security details not provided
- Utilities: Public water; Public sewer; Electric water heater
- Home design: Single-story ranch; Facing information not provided
- Construction: Vinyl siding; Built in 2026
- Exterior features: Front porch; Paved road access
Interior
- Kitchen: Dishwasher; Microwave; Range hood; Electric water heater
- Bedrooms: 3 bedrooms; Master bedroom on the first floor; Other bedrooms on the first floor
- Flooring: Vinyl; Carpet
- Bathrooms: 2 full bathrooms
- Heating & cooling: Central heating; Electric heat controls
- Interior features: Washer/Dryer hookup; Double pane windows
- Laundry & utility: Washer/Dryer hookup
Neighborhood map
What this means for you Summary
Snapshot
- This is a 3-bed/1.0-bath single-family listed at $214k.
Deal economics
- At list price, monthly cash flow is $-86 ($-1k/yr) — negative.
- To cash-flow at today's rent, offer at most $201k (5.8% below list).
- To meet the 1% rule (rent ≥ 1% of price), the offer needs to be $176k (17.6% below list).
- Recommended offer: $176k (17.6% below list) — sets the bar for 1% rule.
- Cap rate 5.8% vs local median 4.4% in Crestview — top-decile yield for the area; either an underpriced asset or a hidden risk that comps aren't pricing in. Stress-test before assuming the spread holds.
Location & tenants
- Location reads 75/100 on livability (#252 in FL, #3,858 nationally) — a middle-class / working-renter tenant base. Strengths: cost of living A+, housing A+, health & safety A+; Watch: employment D, amenities F, commute F.
- Okaloosa (other): math 60% / reading 60% proficiency, ranked #12 of 73 in FL (top 16%) — acceptable for families but not a draw, mixed tenant base, ~2y average lease.
- Zoned schools: Northwood Elementary School (math 63% / reading 56%, grade B-, #690 of 2,144 statewide, top 34%, 828 students, 63% FRL); Crestview High School (math 49% / reading 54%, grade D+, #167 of 667 statewide, top 25%, 2,315 students, 42% FRL) — zoned schools average 53% FRL vs 36% district-wide (17 pts higher); higher-poverty schools than district average — tighter screening recommended.
- Market conditions: Rents flat; 521 active listings in the ZIP; 29 comparable units currently listed for rent nearby; rentals lingering (median 44d on market — plan ~5-8 weeks vacancy on turnover, expect pricing pressure); 55% of comp listings sitting > 30 days — soft ceiling on asking rent; 1,268 units permitted in Okaloosa County in 2024 (175 in 5+ unit buildings).
Forward outlook
- Local home prices are declining (-3.0%/yr); year-one equity from $1k of loan paydown is wiped out by about $6k of value loss. Plan a longer hold.
- Okaloosa County population projected at +37% by 2050 — long-run rental-demand tailwind backs the buy-and-hold thesis.
Negotiation context
- Only 14 days on market — expect competitive offers; lowballing is unlikely to land.
- 11 sale attempts since 3y ago; this cycle's ask has dropped $20k (9%) from the opening price — seller is motivated, your offer sets the floor, not the list.
- Current owner paid $135k; list at $214k implies a 58% gain — meaningful room to come down on a strong offer.
Questions for the listing agent
- What do current leases actually rent for vs. the listed asking? Can we see a recent rent roll and the last 12 months of T-12 income?
- Is there a deadline driving the sale (1031 exchange, divorce, estate, relocation)? That informs how much negotiation room exists.
- Schools are B-rated — typically a magnet for longer-tenancy family renters. What's the average tenant stay here, and is there a school-zone premium baked into asking?
- The area grade is low — what's the realistic commute time and amenity access for the typical tenant pool here? Any planned neighborhood developments (good or bad) we should know about?
- What's the average days-on-market for RENTAL listings here right now (not sales)? A rising rental-DOM trend means longer vacancies and softer asking-rent achievability than the comps imply.
- What's the recent tenant-quality profile in this submarket — average credit score on applications, eviction rate, late-payment / NSF rate, and stable-employment percentage? A property-management company in the area should have these aggregated.
- How much new for-sale + rental construction is in the pipeline within 1–3 miles? Heavy new supply typically softens prices + rents 12–24 months out; constrained supply supports both.
Investment metrics
- 1% rule
- 0.82% ✗
- Cap rate
- 5.81%
- Cash-on-cash
- -1.72%
- DSCR
- 0.92
- GRM
- 10.1
CMA / ARV
- ARV (on-the-fly)
- $237,864
- Comps found
- 12
Show comp detail 12 sales within ~0.75 mi
| Address | Dist | Beds/Ba | Sqft | Sold | Price | $/sf | Match |
|---|---|---|---|---|---|---|---|
| 202 Mc Arthur St | 0.03mi | 3/2.0 | 1,291 (+2%) | 6mo | $215,000 | $167 | 87 |
| 196 Mcarthur St | 0.05mi | 2/2.0 (-1) | 1,154 (-9%) | 0mo | $227,000 | $197 | 73 |
| 548 Hyde Park Dr | 0.53mi | 3/2.0 | 1,276 (+0%) | 2mo | $266,000 | $208 | 69 |
| 302 Dixie St | 0.56mi | 3/1.0 | 1,212 (-5%) | 1mo | $183,000 | $151 | 65 |
| 516 Hyde Park Dr | 0.63mi | 3/2.0 | 1,290 (+1%) | 4mo | $162,000 | $126 | 60 |
| 502 E North Ave | 0.73mi | 3/2.0 | 1,267 (-0%) | 2mo | $248,050 | $196 | 59 |
| 472 Stillwell Blvd | 0.55mi | 3/2.0 | 1,322 (+4%) | 9mo | $200,000 | $151 | 56 |
| 296 Park Ln | 0.72mi | 3/2.0 | 1,328 (+4%) | 2mo | $293,000 | $221 | 54 |
| 212 Aza Pl | 0.67mi | 3/1.5 | 1,100 (-14%) | 4mo | $206,000 | $187 | 41 |
| 117 Jeff Dr | 0.75mi | 3/2.0 | 1,107 (-13%) | 2mo | $225,000 | $203 | 38 |
| 2893 Pansy Ave | 0.73mi | 2/2.0 (-1) | 1,376 (+8%) | 8mo | $187,500 | $136 | 37 |
| 2895 Pansy Ave | 0.74mi | 3/2.0 | 1,093 (-14%) | 5mo | $168,800 | $154 | 34 |
Match score weights: distance 35% · size 25% · config 20% · recency 20%. Top-matched comps best support the ARV.
Projected returns pro-forma
-3.0% appreciation · 0.12% rent growth · sell at horizon
- IRR
- -22.4%
- Equity multiple
- 0.25×
- Total profit
- $-45,066
- Equity at exit
- $31,891
- IRR
- -26.1%
- Equity multiple
- -0.09×
- Total profit
- $-65,408
- Equity at exit
- $18,493
Cash invested: $59,889 (down + closing). Projections, not guarantees.
Landlord ↔ Tenant lean methodology
- Overall (STATE)
- 87 Strongly Landlord-Friendly
- State Florida
- 87 Strongly Landlord-Friendly · R+3
- County
- — inherits STATE
- City
- — inherits STATE
ZIP-level market 32539
- Home prices YoY
- -17.8%
- Rents YoY
- 0.1%
- Active inventory
- 521
- Price-to-rent
- 10.1×
Monthly cashflow live
- Estimated rent
- $1,762 high interval (Pro) →
- Mortgage (P&I)
- −$1,122
- Tax est. 1.5%
- −$267 /mo · $3,208/yr
- Insurance
- −$89
- HOA
- −$0
- Vacancy / Maint / Mgmt
- −$370
- Net cashflow
- $-86
Break-even live
UW: 25.0% down · 7.5% · 30yr · 1.5% tax · 5.0% vac · 8.0% maint · 8.0% mgmt
Financing live
Cash to close
- Down payment
- $53,472
- Closing costs
- $6,417
- Reserves months
- —
- Total cash needed
- —
Loan-product check · same deal, 3 products live
Conventional
25% down · 7.5% · 30yr
- Down + closing
- —
- Monthly P&I
- —
- Monthly cashflow
- —
- DSCR
- —
- Eligible?
- —
Personal DTI + credit; lowest rate.
DSCR
20% down · 8.5% · 30yr
- Down + closing
- —
- Monthly P&I
- —
- Monthly cashflow
- —
- DSCR
- —
- Eligible?
- —
No personal income docs; deal must DSCR.
Hard money
10% down · 12.0% · 12mo
- Down + closing
- —
- Monthly P&I
- —
- Monthly cashflow
- —
- DSCR
- —
- Eligible?
- —
Short-term bridge; refi at stabilization.
Rent comps 29 comps
| Address | Beds | Baths | Sqft | Rent | $/sqft | DOM | Units | Dist |
|---|---|---|---|---|---|---|---|---|
| 311 Dahlquist Dr Crestview, FL | 4.0 | 2.5 | 1770 | $2,050 | $1.16 | 21d | 1 | 0.32mi |
| 507 Eisenhower Dr Crestview, FL | 3.0 | 2.0 | 1809 | $2,200 | $1.22 | 43d | 1 | 0.35mi |
| 304 Strawbridge Dr Crestview, FL | 4.0 | 2.0 | 1650 | $1,850 | $1.12 | 13d | 1 | 0.46mi |
| 812 Carlton St Crestview, FL | 3.0 | 2.5 | 1393 | $1,495 | $1.07 | 21d | 1 | 0.57mi |
| 326 Dixie St Crestview, FL | 3.0 | 1.0 | 1386 | $1,400 | $1.01 | 43d | 1 | 0.57mi |
| 502 Hyde Park Dr Crestview, FL | 3.0 | 2.0 | 1302 | $1,795 | $1.38 | 13d | 1 | 0.62mi |
| 498 North Ave E Unit A Crestview, FL | 2.0 | 2.0 | 1081 | $1,450 | $1.34 | 43d | 1 | 0.70mi |
| 815 Valley Rd Crestview, FL | 3.0 | 2.5 | 1373 | $1,550 | $1.13 | 43d | 1 | 0.75mi |
| 408 Arbor Lake Dr Crestview, FL | 3.0 | 2.5 | 1755 | $1,900 | $1.08 | 13d | 1 | 0.81mi |
| 149 Shady Ln Crestview, FL | 3.0 | 2.0 | 1680 | $2,000 | $1.19 | 43d | 1 | 0.83mi |
| 720 Arbor Lake Dr Crestview, FL | 2.0 | 2.5 | 1100 | $1,375 | $1.25 | 21d | 1 | 0.86mi |
| 720 Arbor Lake Dr Crestview, FL | 2.0 | 2.5 | 1100 | $1,400 | $1.27 | 43d | 1 | 0.86mi |
| 830 Arbor Lake Dr Crestview, FL | 2.0 | 2.5 | 1200 | $1,400 | $1.17 | 13d | 1 | 0.87mi |
| 205 Powell Dr Crestview, FL | 3.0 | 1.5 | 1008 | $1,400 | $1.39 | 43d | 1 | 0.89mi |
| 2942 Sholtz Ave Crestview, FL | 3.0 | 2.0 | 1266 | $1,600 | $1.26 | 43d | 1 | 0.92mi |
| 107 Hampton Dr Crestview, FL | 2.0 | 1.5 | 972 | $1,300 | $1.34 | 21d | 1 | 0.96mi |
| 122 Hampton Dr Unit 1 Crestview, FL | 2.0 | 2.0 | 1080 | $1,195 | $1.11 | 43d | 1 | 1.01mi |
| 122 Hampton Dr Crestview, FL | 2.0 | 1.5 | 1080 | $1,195 | $1.11 | 43d | 1 | 1.01mi |
| 124 Hampton Dr Crestview, FL | 2.0 | 1.5 | 952 | $1,195 | $1.26 | 21d | 1 | 1.01mi |
| 124 Hampton Dr Unit 1 Crestview, FL | 2.0 | 1.5 | 952 | $1,195 | $1.26 | 43d | 1 | 1.01mi |
| 398 N Spring St Crestview, FL | 2.0 | 1.0 | 1200 | $1,300 | $1.08 | 43d | 1 | 1.09mi |
| 197 W 1st Ave Crestview, FL | 3.0 | 2.0 | 1547 | $2,395 | $1.55 | 21d | 1 | 1.10mi |
| 131 Adkinson Dr Crestview, FL | 4.0 | 1.0 | 1332 | $1,750 | $1.31 | 13d | 1 | 1.11mi |
| 401 S Booker St Crestview, FL | 3.0 | 1.5 | 1040 | $1,225 | $1.18 | 43d | 1 | 1.35mi |
| 503 W Griffith Ave Crestview, FL | 3.0 | 1.0 | 962 | $1,395 | $1.45 | 43d | 1 | 1.38mi |
| 816 W Walnut Ave Crestview, FL | 3.0 | 2.0 | 1297 | $1,595 | $1.23 | 43d | 1 | 1.45mi |
| 812 E Edney Ave Crestview, FL | 2.0 | 2.0 | 1024 | $1,400 | $1.37 | 21d | 1 | 1.47mi |
| 812 E Edney Ave Crestview, FL | 2.0 | 2.0 | 1024 | $1,400 | $1.37 | 44d | 1 | 1.47mi |
| 132 Cabana Way Crestview, FL | 3.0 | 2.0 | 1408 | $1,750 | $1.24 | 13d | 1 | 1.49mi |
Listing history 13 events
-
2026-06-18days on market $213,888 Active 14 DOM
-
2026-06-17days on market $213,888 Active 13 DOM
-
2026-06-16price $213,888 Active 12 DOM
-
2026-06-16days on market $218,888 Active 12 DOM
-
2026-06-15days on market $218,888 Active 11 DOM
-
2026-06-14days on market $218,888 Active 9 DOM
-
2026-06-13days on market $218,888 Active 8 DOM
-
2026-06-10pricedays on market $218,888 Active 6 DOM
-
2026-06-09days on market $233,990 Active 5 DOM
-
2026-06-08days on market $233,990 Active 4 DOM
-
2026-06-07days on market $233,990 Active 3 DOM
-
2026-06-05remarks 569-char remark
Show marketing remark (26 chars)
3 bed | 2 bath | 1114 sqft
-
2026-06-05$233,990 Active 1 DOM
Show marketing remark (26 chars)
3 bed | 2 bath | 1114 sqft
ⓘ Source: listings_history table (triggers on properties + properties_extension) + one-shot
backfill from property_details.listing_events for pre-trigger history.
Nearby sold comps map
Loading sold comps map…
Walkable amenities ~0.75 mi
Loading nearby amenities…
Taxation est. · year 1
- Rental income
- $21,148
- − Mortgage interest
- −$11,981
- − Property taxes
- −$3,208
- − Insurance
- −$1,069
- − Repairs & maintenance
- −$1,692
- − Management
- −$1,692
- − Depreciation
- −$6,222
- Taxable loss
- −$4,717
- Est. tax savings @ 24.0%
- +$1,132
- After-tax cash flow
- $101/yr
For passive investors: Depreciation is non-cash, so a rental often shows a tax loss while cash-flowing — sheltering income. Rental losses are passive: they offset passive income freely, and up to $25,000/yr can offset ordinary (W-2) income if you actively participate and your MAGI is under $100k (phasing out to $0 by $150k); unused losses carry forward. On sale, claimed depreciation is recaptured at up to 25%, and gains may owe capital-gains tax (a 1031 exchange can defer both). Figures are a year-1 estimate at your 24.0% rate — not tax advice; consult a CPA.
Schools (NCES district)
- District
- Okaloosa
- NCES district ID
- 1201380
- Math proficiency
- 60% ▼ -12.00%
- Reading proficiency
- 60% ▼ -4.00%
- Median HH income
- $55,601
- Composite
- 51.62/100
- National rank
- #1705
- State rank
- #12 of 73 in FL
Livability — Crestview
- Score
- 75/100
- State rank
- #252
- US rank
- #3858
Category grades
Schools grade is shown separately in the Schools card above.
Census & demographics
- Census place
- Crestview, FL
- County
- Okaloosa County · 194,352 people
- City population
- 58,889
- Metro
- Crestview-Fort Walton Beach-Destin, FL
- Population (ZIP)
- 33,290
- Household income
- $74,369
- Rent vs Own
- Severe rent burden
- 371.0
Population outlook (Okaloosa County) Hauer SSP2
- Today (2025)
- 235,133 people
- By 2030
- 253,483 · +7.8%
- By 2040
- 289,537 · +23.1%
- By 2050
- 322,954 · +37.3%
- By 2075
- 399,624 · +70.0%
- By 2100
- 425,311 · +80.9%
Race, ethnicity, and origin ACS 2023
- Neighborhood character
- Predominantly White (73%)
- Race & ethnicity
- White 73% Black 12% Two or more races 8% Hispanic / Latino 7% Asian 1%
- Hispanic origin (detail)
- Mexican 3% Puerto Rican 2%
- Common ancestry
- Lithuanian 4% Iranian 2% Romanian 2%
- Foreign-born
- 3% · Canada
- Languages at home
- 94% English-only · Spanish 3% Russian/Polish/Slavic 1% Other Asian/Pacific 1%
Political lean MEDSL · Okaloosa
- 2024 margin
- Solid R (+42.4) · D 28.2% · R 70.7% · Other 1.1%
- 2008→2024 swing
- +2.5pp toward D · 2008: -44.9pp · 2024: -42.4pp
- All cycles
- 2024: R+42.4 2020: R+39.1 2016: R+47.8 2012: R+49.4 2008: R+44.9
Not yet ingested
- Civics
- —
Market trends
- HPI YoY
- ▼ -56.52%
- Current HPI
- 261.1557
- Rent YoY
- ▲ 0.12%
- Metro
- Crestview-Fort Walton Beach-Destin, FL
- State GDP YoY
- ▲ 3.28%
- F500 in state
- 36
Industry mix (Fortune 500 HQ in FL)
| Industry | F500 HQs | Revenue |
|---|---|---|
| Industrial Technology | 2 | $29B |
|
||
| Insurance | 2 | $17B |
|
||
| Retail | 1 | $60B |
|
||
| Technology Distribution | 1 | $58B |
|
||
| Homebuilding | 1 | $35B |
|
||
| Technology Manufacturing | 1 | $35B |
|
||
Price history
+1903.9% since first listed42 events — show timeline
- 2026-06-05 Listed $233,990 Zillow
- 2026-06-04 Relisted — ECAR
- 2026-06-04 Price Changed $233,990 ECAR
- 2025-12-16 Sold (Public Records) $135,000 Public Records
- 2024-07-12 Sold (MLS) $31,000 ECAR
- 2024-06-05 Relisted — ECAR
- 2024-05-26 Price Changed $98,900 ECAR
- 2024-05-01 Price Changed $99,900 ECAR
- 2024-04-29 Price Changed $100,000 ECAR
- 2024-04-16 Price Changed $102,700 ECAR
- 2024-02-19 Price Changed $104,900 ECAR
- 2024-02-09 Listed $105,900 ECAR
- 2024-01-19 Price Changed $85,000 ECAR
- 2024-01-11 Price Changed $92,000 ECAR
- 2024-01-06 Price Changed $92,500 ECAR
- 2024-01-02 Listed $95,900 ECAR
- 2023-12-28 Price Changed $95,900 ECAR
- 2023-12-17 Price Changed $105,900 ECAR
- 2023-10-16 Price Changed $108,900 ECAR
- 2023-10-12 Listed $110,900 ECAR
- 2023-09-24 Price Changed $95,000 ECAR
- 2023-09-22 Price Changed $96,000 ECAR
- 2023-08-24 Price Changed $99,900 ECAR
- 2023-08-23 Price Changed $114,900 ECAR
- 2023-08-11 Price Changed $119,000 ECAR
- 2023-08-06 Price Changed $121,800 ECAR
- 2023-08-02 Listed $122,500 ECAR
- 2023-06-04 Delisted — ECAR
- 2023-05-25 Price Changed $98,000 ECAR
- 2023-05-14 Price Changed $99,900 ECAR
- 2023-05-10 Price Changed $109,990 ECAR
- 2023-04-26 Delisted — ECAR
- 2023-04-26 Listed $115,900 ECAR
- 2023-04-15 Price Changed $115,900 ECAR
- 2023-04-15 Relisted — ECAR
- 2023-02-08 Delisted — ECAR
- 2023-01-30 Pending — ECAR
- 2023-01-30 Pending — NAMLS
- 2023-01-30 Listing Removed — NAMLS
- 2023-01-17 Listed $105,000 ECAR
- 2023-01-17 Listed $105,000 NAMLS
- 1977-01-01 Sold (Public Records) $11,677 Public Records
Property tax history
-7.4%/yrLatest (2025): $410 · +61.3% YoY. Source: county tax records.
Cash-flow waterfall
monthlySold comps — $/sqft
last 12 mo · ≤1 miLoading sold comps…