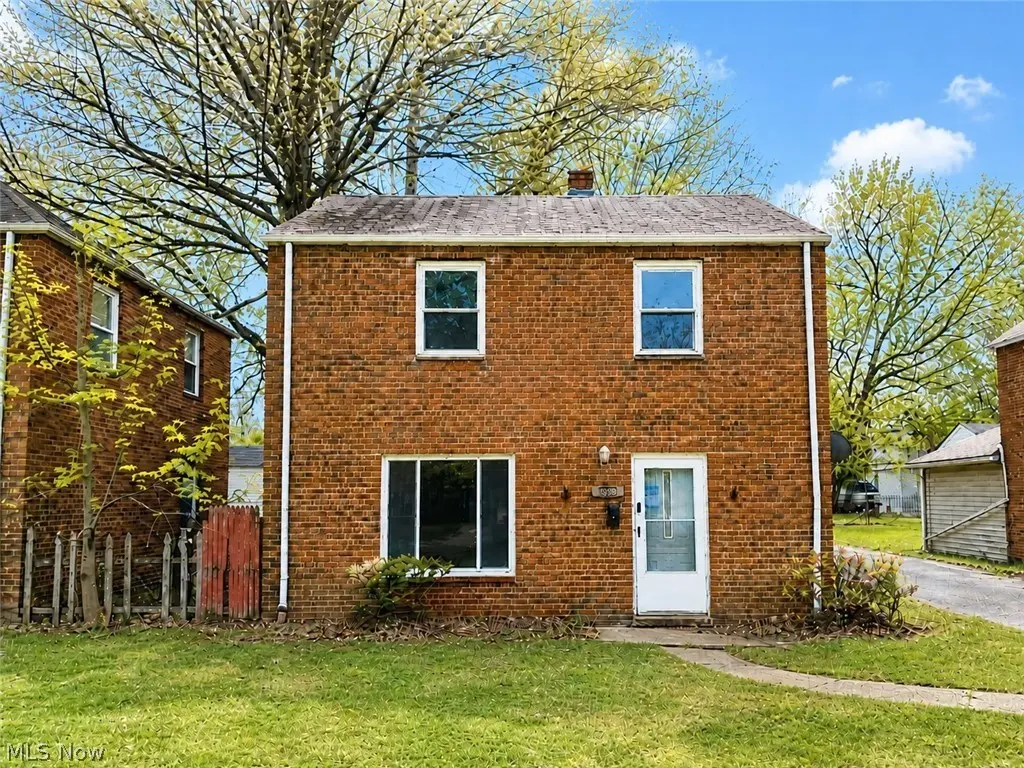
20980 Priday Ave · Euclid, OH
Flood risk 1/10 · Minimal
- FEMA flood zone
- X (unshaded)
- Chance of flooding over 30 yrs
- 0.0%
- Est. flood insurance / yr
- $507 – $1,088
Fire risk 1/10 · Minimal
- Est. fire insurance / yr
- $713 – $1,323
Heat risk 3/10 · Minor
- Hot days now (above 94°F)
- 7 days/yr
- Hot days in 30 yrs
- 17 days/yr
Wind risk 1/10 · Minimal
- Chance of severe wind over 30 yrs
- —
Air-quality risk 3/10 · Minor
- Unhealthy air days now
- 3 days/yr
- Unhealthy air days in 30 yrs
- 4 days/yr
Risk factors via First Street. Map © Google.
Why this score? — see what drove the B+ grade
The composite is a weighted blend of 9 inputs, each scored 0–100. Each bar is that input's sub-score; the figure is the points it added to the 100-point composite (weight × sub-score).
- Cash flow +30.0/30.0
- ARV discount +15.0/15.0
- 1% rule +10.0/10.0
- DSCR +10.0/10.0
- Livability +3.9/5.0
- Rent growth +3.8/5.0
- Condition / age +2.5/5.0
- Schools +1.7/10.0
- Appreciation +0.0/10.0
$89,900
🖨 Deal sheet (PDF) 📄 Offer letter ✓ Due diligence
Listing remarks MLS
Possible Short Sale * Buyer to assume City of Euclid violations *
Key facts
- Large picture window
- Bright living room
- Brick colonial
Tags
Property features AI
Exterior
- Parking: Detached paved parking; Off-street parking; Detached 2-car garage
- Utilities: Public water; Public sewer
- Home design: 2 stories; Built (year per public records); Asphalt shingle roof; Slab foundation
- Construction: Brick construction
- Exterior features: City lot; Garage(s) on property
Interior
- Kitchen: Eat-in kitchen (appliances not specified)
- Bedrooms: Total rooms: 6
- Bathrooms: 1 full bathroom
- Heating & cooling: Forced air gas heating
- Interior features: Crown molding; Eat-in kitchen; Natural woodwork; Double-pane, insulated, and storm windows
- Laundry & utility: Common area laundry
Neighborhood map
What this means for you Summary
Snapshot
- This is a 3-bed/1.0-bath single-family listed at $90k.
Deal economics
- At list price, monthly cash flow is $343 ($4k/yr) — positive.
- The deal already cash-flows at list — no discount required.
- Meets the 1% rule at list price ($1k rent vs $90k).
- Recommended offer: $89k (1.5% below list) — sets the bar for market timing.
- Cap rate 10.9% vs local median 6.7% in Euclid — top-decile yield for the area; either an underpriced asset or a hidden risk that comps aren't pricing in. Stress-test before assuming the spread holds.
Location & tenants
- Location reads 77/100 on livability (#204 in OH, #3,149 nationally) — a middle-class / working-renter tenant base. Strengths: cost of living A+, housing A+, crime B+; Watch: commute F, employment D-.
- Euclid City (suburban): math 14% / reading 28% proficiency, ranked #625 of 656 in OH (top 95%) — low school quality limits family demand, transient renter base, plan for 1-2y turnover; 70% free/reduced lunch — lower-income household profile, screen leases tightly.
- Zoned schools: Arbor Elementary School (math 17% / reading 28%, grade F, #1,239 of 1,584 statewide, top 78%, 370 students, 0% FRL); Euclid Middle School (math 10% / reading 22%, grade F, #624 of 654 statewide, top 96%, 934 students, 0% FRL); Euclid High School (math 7% / reading 33%, grade F, #675 of 781 statewide, top 87%, 1,618 students, 0% FRL) — zoned schools average 0% FRL vs 70% district-wide (70 pts lower); this property's tenant base skews higher-income than the district average.
- Market conditions: Rents rising fast (+5.3%/yr); 96 active listings in the ZIP; 38 comparable units currently listed for rent nearby; rentals at typical pace (median 23d on market — plan ~3-4 weeks tenant-placement turnaround); 1,441 units permitted in Cuyahoga County in 2024 (700 in 5+ unit buildings).
Forward outlook
- Local home prices are declining (-3.0%/yr); year-one equity from $622 of loan paydown is wiped out by about $3k of value loss. Plan a longer hold.
- Cuyahoga County population projected to shrink 8% by 2050 — rents likely to lag national; underwrite the cash flow, not the appreciation.
- At projected returns (-3.0% appreciation + 5.3% rent growth), your $25k cash investment doubles in ~7 years — after that, you're playing with house money.
Negotiation context
- It's been on market 17 days — a 2% lower offer ($89k) is reasonable based on typical stale-listing flexibility.
- 8 sale attempts since 34y ago with the ask held roughly flat each time — persistent listings suggest the price (not the market) is what's stuck; bring a comps-based counter.
- Current owner paid $13k; list at $90k implies a 592% gain — meaningful room to come down on a strong offer.
Risks & watch-outs
- Watch-outs: property tax is 3.0% of price; built in 1947 — expect roof / HVAC / electrical / plumbing capex.
Questions for the listing agent
- Built in 1947 — when were the roof, HVAC, electrical panel, plumbing, and water heater last replaced?
- Property tax is high relative to price — has the assessment been appealed recently, and will the sale trigger a re-assessment?
- Is there a deadline driving the sale (1031 exchange, divorce, estate, relocation)? That informs how much negotiation room exists.
- What's the average days-on-market for RENTAL listings here right now (not sales)? A rising rental-DOM trend means longer vacancies and softer asking-rent achievability than the comps imply.
- What's the recent tenant-quality profile in this submarket — average credit score on applications, eviction rate, late-payment / NSF rate, and stable-employment percentage? A property-management company in the area should have these aggregated.
- How much new for-sale + rental construction is in the pipeline within 1–3 miles? Heavy new supply typically softens prices + rents 12–24 months out; constrained supply supports both.
Investment metrics
- 1% rule
- 1.52% ✓
- Cap rate
- 10.87%
- Cash-on-cash
- 16.34%
- DSCR
- 1.73
- GRM
- 5.5
CMA / ARV
- ARV (median comp)
- $132,515
- List price
- $89,900
- Delta
- -32.16%
- Verdict
- UNDERPRICED
- Comps
- 20 within 1.0 mi
Show comp detail 12 sales within ~0.75 mi
| Address | Dist | Beds/Ba | Sqft | Sold | Price | $/sf | Match |
|---|---|---|---|---|---|---|---|
| 20931 Priday | 0.03mi | 3/1.0 | 1,200 (0%) | 2mo | $109,600 | $91 | 97 |
| 21001 Wilmore Ave | 0.18mi | 3/1.5 | 1,202 (+0%) | 1mo | $208,000 | $173 | 88 |
| 273 E 208th St | 0.26mi | 3/1.0 | 1,174 (-2%) | 1mo | $150,000 | $128 | 83 |
| 20330 S Lake Shore Blvd | 0.25mi | 4/1.0 (+1) | 1,184 (-1%) | 0mo | $164,000 | $139 | 81 |
| 20700 Crystal Ave | 0.12mi | 4/1.5 (+1) | 1,287 (+7%) | 2mo | $109,600 | $85 | 74 |
| 21771 Ball Ave | 0.26mi | 3/1.0 | 1,093 (-9%) | 0mo | $140,000 | $128 | 73 |
| 20770 Morris Ave | 0.27mi | 3/1.0 | 1,081 (-10%) | 1mo | $155,000 | $143 | 70 |
| 115 E 211th St | 0.59mi | 3/2.0 | 1,197 (-0%) | 1mo | $188,000 | $157 | 67 |
| 22000 Kennison Ave | 0.48mi | 3/1.5 | 1,100 (-8%) | 1mo | $180,000 | $164 | 61 |
| 860 E 232nd St | 0.75mi | 3/1.5 | 1,288 (+7%) | 1mo | $109,000 | $85 | 50 |
| 19070 Meredith Ave | 0.72mi | 2/1.5 (-1) | 1,062 (-12%) | 1mo | $145,000 | $137 | 40 |
| 161 E 216th St | 0.70mi | 3/2.5 | 1,053 (-12%) | 2mo | $215,000 | $204 | 39 |
Match score weights: distance 35% · size 25% · config 20% · recency 20%. Top-matched comps best support the ARV.
Projected returns pro-forma
-3.0% appreciation · 5.28% rent growth · sell at horizon
- IRR
- 10.3%
- Equity multiple
- 1.42×
- Total profit
- $10,548
- Equity at exit
- $13,404
- IRR
- 21.4%
- Equity multiple
- 3.04×
- Total profit
- $51,416
- Equity at exit
- $7,773
Cash invested: $25,172 (down + closing). Projections, not guarantees.
Landlord ↔ Tenant lean methodology
- Overall (STATE)
- 73 Landlord-Friendly
- State Ohio
- 73 Landlord-Friendly · R+6
- County
- — inherits STATE
- City
- — inherits STATE
ZIP-level market 44123
- Home prices YoY
- -25.0%
- Rents YoY
- 5.3%
- Active inventory
- 96
- Price-to-rent
- 5.5×
Monthly cashflow live
- Estimated rent
- $1,364 high interval (Pro) →
- Mortgage (P&I)
- −$471
- Tax from tax record
- −$226 /mo · $2,713/yr
- Insurance
- −$37
- HOA
- −$0
- Vacancy / Maint / Mgmt
- −$286
- Net cashflow
- $343
Break-even live
Sensitivity live
| Price | -10% $394 | -5% $368 | +0% $343 | +5% $317 | +10% $292 |
|---|---|---|---|---|---|
| Rent | -10% $235 | -5% $289 | +0% $343 | +5% $397 | +10% $450 |
| Rate | -1.0pp $388 | -0.5pp $366 | base $343 | +0.5pp $319 | +1.0pp $296 |
UW: 25.0% down · 7.5% · 30yr · 1.5% tax · 5.0% vac · 8.0% maint · 8.0% mgmt
Financing live
Cash to close
- Down payment
- $22,475
- Closing costs
- $2,697
- Reserves months
- —
- Total cash needed
- —
Loan-product check · same deal, 3 products live
Conventional
25% down · 7.5% · 30yr
- Down + closing
- —
- Monthly P&I
- —
- Monthly cashflow
- —
- DSCR
- —
- Eligible?
- —
Personal DTI + credit; lowest rate.
DSCR
20% down · 8.5% · 30yr
- Down + closing
- —
- Monthly P&I
- —
- Monthly cashflow
- —
- DSCR
- —
- Eligible?
- —
No personal income docs; deal must DSCR.
Hard money
10% down · 12.0% · 12mo
- Down + closing
- —
- Monthly P&I
- —
- Monthly cashflow
- —
- DSCR
- —
- Eligible?
- —
Short-term bridge; refi at stabilization.
Rent comps 38 comps
| Address | Beds | Baths | Sqft | Rent | $/sqft | DOM | Units | Dist |
|---|---|---|---|---|---|---|---|---|
| 21000 Priday Ave Euclid, OH | 3.0 | 1.0 | 1200 | $1,300 | $1.08 | 45d | 1 | 0.04mi |
| 21251 S Lake Shore Blvd Euclid, OH | 3.0 | 2.0 | 1246 | $1,595 | $1.28 | 45d | 1 | 0.19mi |
| 20990 Morris Ave Euclid, OH | 3.0 | 1.0 | 778 | $1,355 | $1.74 | 45d | 1 | 0.23mi |
| 21751 Priday Ave Euclid, OH | 3.0 | 1.0 | 1174 | $1,545 | $1.32 | 23d | 1 | 0.25mi |
| 20231 Crystal Ave Euclid, OH | 2.0 | 1.0 | 833 | $799 | $0.96 | 18d | 1 | 0.27mi |
| 20500 Morris Ave Euclid, OH | 3.0 | 1.0 | 1104 | $1,399 | $1.27 | 45d | 1 | 0.28mi |
| 21271 Nicholas Ave Euclid, OH | 3.0 | 2.0 | 1300 | $1,689 | $1.30 | 45d | 1 | 0.32mi |
| 299 E 197th St Cleveland, OH | 4.0 | 2.0 | 1328 | $1,400 | $1.05 | 18d | 1 | 0.37mi |
| 404 E 200th St Cleveland, OH | 2.0 | 1.0 | 884 | $1,095 | $1.24 | 45d | 1 | 0.40mi |
| 26200 S Lake Shr Euclid, OH | 3.0 | 1.5 | 1305 | $1,225 | $0.94 | 9d | 1 | 0.41mi |
| 488 E 222nd St Unit Up Euclid, OH | 2.0 | 1.0 | 900 | $1,100 | $1.22 | 23d | 1 | 0.41mi |
| 21301 Arbor Ave Euclid, OH | 3.0 | 1.0 | 1050 | $1,450 | $1.38 | 21d | 1 | 0.42mi |
| 521 E 222nd St Euclid, OH | 2.0 | 1.0 | 800 | $1,500 | $1.88 | 25d | 1 | 0.43mi |
| 455 E 200th St Cleveland, OH | 2.0 | 1.0 | 950 | $1,150 | $1.21 | 25d | 1 | 0.44mi |
| 21860 Roberts Ave Euclid, OH | 3.0 | 1.0 | 1253 | $1,450 | $1.16 | 9d | 1 | 0.44mi |
| 540 E 208th St Cleveland, OH | 2.0 | 1.0 | 1189 | $1,025 | $0.86 | 45d | 1 | 0.48mi |
| 21980 Ivan Ave Euclid, OH | 4.0 | 2.0 | 1348 | $1,350 | $1.00 | 45d | 1 | 0.50mi |
| 22370 Tracy Ave Euclid, OH | 3.0 | 1.0 | 1202 | $1,575 | $1.31 | 18d | 1 | 0.52mi |
| 415 E 222nd St Unit 461-23 Euclid, OH | 2.0 | 1.0 | 700 | $875 | $1.25 | 45d | 1 | 0.56mi |
| 21252 Goller Ave Euclid, OH | 3.0 | 1.0 | 1161 | $1,275 | $1.10 | 22d | 1 | 0.59mi |
| 21250 Goller Ave Cleveland, OH | 3.0 | 1.0 | 1161 | $1,275 | $1.10 | 14d | 1 | 0.60mi |
| 22501 Arms Ave Euclid, OH | 3.0 | 1.0 | 1044 | $1,350 | $1.29 | 25d | 1 | 0.65mi |
| 20664 Miller Ave Unit Down Unit Euclid, OH | 3.0 | 2.0 | 1100 | $1,200 | $1.09 | 45d | 1 | 0.67mi |
| 19430 Monterey Ave Cleveland, OH | 3.0 | 1.5 | 898 | $1,236 | $1.38 | 23d | 1 | 0.72mi |
| 19330 Monterey Ave Cleveland, OH | 4.0 | 1.5 | 1200 | $1,450 | $1.21 | 5d | 1 | 0.74mi |
| 927 E 216th St Unit 1 Euclid, OH | 2.0 | 1.0 | 850 | $1,147 | $1.35 | 6d | 1 | 0.76mi |
| 824 E 236th St Euclid, OH | 3.0 | 2.0 | 1100 | $1,720 | $1.56 | 3d | 1 | 0.78mi |
| 961 E 224th St Euclid, OH | 3.0 | 1.0 | 1034 | $1,300 | $1.26 | 18d | 1 | 0.78mi |
| 18800 Pasnow Ave Cleveland, OH | 3.0 | 1.0 | 1348 | $1,350 | $1.00 | 18d | 1 | 0.80mi |
| 871 E 212th St Cleveland, OH | 3.0 | 1.5 | 1092 | $1,399 | $1.28 | 45d | 1 | 0.81mi |
| 645 Babbitt Rd Euclid, OH | 3.0 | 1.0 | 1200 | $1,400 | $1.17 | 14d | 1 | 0.81mi |
| 797 Babbitt Rd #22 Euclid, OH | 3.0 | 1.5 | 1360 | $1,600 | $1.18 | 45d | 1 | 0.95mi |
| 374 E 232nd St Euclid, OH | 3.0 | 1.0 | 1222 | $1,995 | $1.63 | 45d | 1 | 1.00mi |
| 23901 Puritan Rd Euclid, OH | 3.0 | 1.0 | 1326 | $1,595 | $1.20 | 16d | 1 | 1.03mi |
| 655 E 240th St Euclid, OH | 3.0 | 1.0 | 1341 | $1,550 | $1.16 | 45d | 1 | 1.05mi |
| 23307 Williams Ave Euclid, OH | 4.0 | 1.0 | 1220 | $1,700 | $1.39 | 25d | 1 | 1.08mi |
| 24200 Puritan Rd Euclid, OH | 3.0 | 1.0 | 1100 | $1,199 | $1.09 | 14d | 1 | 1.14mi |
| 884 E 248th St Euclid, OH | 3.0 | 2.0 | 1440 | $1,699 | $1.18 | 3d | 1 | 1.17mi |
Listing history 19 events
-
2026-05-18status Pending 1951-char remark
-
2026-05-01$89,900 Active 1951-char remark
-
2024-03-08historical $1,095
-
2024-03-06price $1,095
-
2024-02-09$1,145
-
2024-02-02historical $1,200
-
2024-01-19$1,200
-
2012-07-03soldstatus $13,000 68-char remark
Show marketing remark (68 chars)
Possible Short Sale * Buyer to assume City of Euclid violations *
-
2011-10-15$19,900 68-char remark
Show marketing remark (68 chars)
Possible Short Sale * Buyer to assume City of Euclid violations *
-
2011-05-20historical
-
2010-12-20$34,000
-
1993-05-28soldstatus $63,900
-
1993-05-26soldstatus $62,500
-
1993-04-02$63,900
-
1993-03-31historical
-
1993-02-03historical
-
1993-01-29$63,900
-
1992-08-03$63,900
-
1977-03-01soldstatus $32,000
ⓘ Source: listings_history table (triggers on properties + properties_extension) + one-shot
backfill from property_details.listing_events for pre-trigger history.
Tax reassessment forecast OH · Partial reset (capped growth)
- Current annual tax
- $2,713 · $226/mo
- Projected year-2 tax
- $2,713 · $226/mo
- Expected delta
- $0/yr ($0/mo · 0.0%)
ⓘ Screening estimate from a state-policy table — verify with the county assessor before closing.
Climate risk First Street
- Flood 1/10 Low FEMA zone X (unshaded) · 0% chance over 30 yrs
- Wildfire 1/10 Low
- Heat 3/10 Moderate 7 d/yr ≥94°F today · 17 d/yr by 30 yrs out
- Wind 1/10 Low
- Air quality 3/10 Moderate 3 unhealthy d/yr today · 4 by 30 yrs out
Nearby sold comps map
Loading sold comps map…
Walkable amenities ~0.75 mi
Loading nearby amenities…
Taxation est. · year 1
- Rental income
- $16,369
- − Mortgage interest
- −$5,036
- − Property taxes
- −$2,713
- − Insurance
- −$450
- − Repairs & maintenance
- −$1,310
- − Management
- −$1,310
- − Depreciation
- −$2,615
- Taxable income
- $2,937
- Est. tax owed @ 24.0%
- −$705
- After-tax cash flow
- $3,407/yr
For passive investors: Depreciation is non-cash, so a rental often shows a tax loss while cash-flowing — sheltering income. Rental losses are passive: they offset passive income freely, and up to $25,000/yr can offset ordinary (W-2) income if you actively participate and your MAGI is under $100k (phasing out to $0 by $150k); unused losses carry forward. On sale, claimed depreciation is recaptured at up to 25%, and gains may owe capital-gains tax (a 1031 exchange can defer both). Figures are a year-1 estimate at your 24.0% rate — not tax advice; consult a CPA.
Schools (NCES district)
- District
- Euclid City
- NCES district ID
- 3904395
- Math proficiency
- 14% ▼ -19.00%
- Reading proficiency
- 28% ▼ -14.00%
- Median HH income
- $36,385
- Composite
- 17.39/100
- National rank
- #9067
- State rank
- #625 of 656 in OH
Livability — Euclid
- Score
- 77/100
- State rank
- #204
- US rank
- #3149
Category grades
Schools grade is shown separately in the Schools card above.
Census & demographics
- Census place
- Euclid, OH
- County
- Cuyahoga County · 1,090,369 people
- City population
- 41,855
- Metro
- Cleveland-Elyria, OH
- Population (ZIP)
- 18,050
- Household income
- $55,676
- Rent vs Own
- Severe rent burden
- 1085.0
Population outlook (Cuyahoga County) Hauer SSP2
- Today (2025)
- 1,244,621 people
- By 2030
- 1,230,093 · -1.2%
- By 2040
- 1,189,108 · -4.5%
- By 2050
- 1,145,706 · -7.9%
- By 2075
- 1,076,557 · -13.5%
- By 2100
- 978,987 · -21.3%
Race, ethnicity, and origin ACS 2023
- Neighborhood character
- Majority Black (65%)
- Race & ethnicity
- Black 65% White 28% Two or more races 6% Hispanic / Latino 1%
- Common ancestry
- Romanian 5%
- Foreign-born
- 2% · Canada
- Languages at home
- 96% English-only · Spanish 2% Chinese 1%
Political lean MEDSL · Cuyahoga
- 2024 margin
- Solid D (+31.5) · D 65.4% · R 33.9%
- 2008→2024 swing
- -7.4pp toward R · 2008: 38.9pp · 2024: 31.5pp
- All cycles
- 2024: D+31.5 2020: D+34.1 2016: D+35.0 2012: D+38.7 2008: D+38.9
Not yet ingested
- Civics
- —
Market trends
- HPI YoY
- ▼ -62.82%
- Current HPI
- 188.4932
- Rent YoY
- ▲ 5.28%
- Metro
- Cleveland-Elyria, OH
- State GDP YoY
- ▲ 1.98%
- F500 in state
- 48
Industry mix (Fortune 500 HQ in OH)
| Industry | F500 HQs | Revenue |
|---|---|---|
| Insurance | 3 | $145B |
|
||
| Industrial Machinery | 3 | $49B |
|
||
| Financial Services | 3 | $24B |
|
||
| Consumer Goods | 2 | $93B |
|
||
| Aerospace / Defense | 2 | $47B |
|
||
| Utilities | 2 | $33B |
|
||
Price history
+180.9% since first listed19 events — show timeline
- 2026-05-18 Pending — MLSNOW
- 2026-05-01 Listed $89,900 MLSNOW
- 2024-03-08 Rental Removed $1,095 YESMLS
- 2024-03-06 Price Changed $1,095 YESMLS
- 2024-02-09 Listed for Rent $1,145 YESMLS
- 2024-02-02 Rental Removed $1,200 YESMLS
- 2024-01-19 Listed for Rent $1,200 YESMLS
- 2012-07-03 Sold (MLS) $13,000 MLSNOW
- 2011-10-15 Listed $19,900 MLSNOW
- 2011-05-20 Listing Removed — MLSNOW
- 2010-12-20 Listed $34,000 MLSNOW
- 1993-05-28 Sold (MLS) $63,900 MLSNOW
- 1993-05-26 Sold (Public Records) $62,500 Public Records
- 1993-04-02 Listed $63,900 MLSNOW
- 1993-03-31 Listing Removed — MLSNOW
- 1993-02-03 Listing Removed — MLSNOW
- 1993-01-29 Listed $63,900 MLSNOW
- 1992-08-03 Listed $63,900 MLSNOW
- 1977-03-01 Sold (Public Records) $32,000 Public Records
Property tax history
+5.9%/yrLatest (2025): $2,713 · -0.0% YoY. Source: county tax records.
Cash-flow waterfall
monthlySold comps — $/sqft
last 12 mo · ≤1 miLoading sold comps…