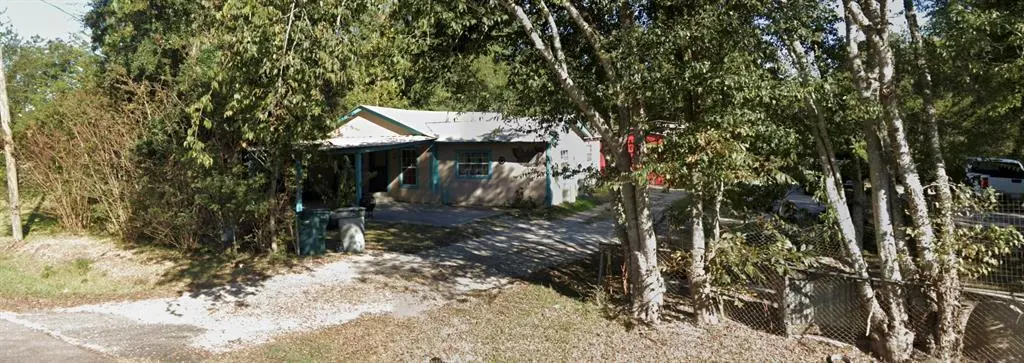
3370 Saint James Blvd · Beaumont, TX
Flood risk 8/10 · Major
- FEMA flood zone
- X
- Chance of flooding over 30 yrs
- 0.99%
- Est. flood insurance / yr
- $507 – $1,088
Fire risk 1/10 · Minimal
- Est. fire insurance / yr
- $1,222 – $2,270
Heat risk 9/10 · Severe
- Hot days now (above 109°F)
- 7 days/yr
- Hot days in 30 yrs
- 22 days/yr
Wind risk 9/10 · Severe
- Chance of severe wind over 30 yrs
- 99.0%
Air-quality risk 2/10 · Minimal
- Unhealthy air days now
- 1 days/yr
- Unhealthy air days in 30 yrs
- 1 days/yr
Risk factors via First Street. Map © Google.
Why this score? — see what drove the B grade
The composite is a weighted blend of 9 inputs, each scored 0–100. Each bar is that input's sub-score; the figure is the points it added to the 100-point composite (weight × sub-score).
- Cash flow +30.0/30.0
- ARV discount +15.0/15.0
- 1% rule +10.0/10.0
- DSCR +10.0/10.0
- Livability +3.2/5.0
- Rent growth +2.5/5.0
- Condition / age +2.5/5.0
- Schools +1.5/10.0
- Appreciation +0.0/10.0
$84,999
🖨 Deal sheet 📄 Offer letter ✓ Due diligence
Listing remarks MLS
Welcome to this charming 4-bedroom, 2-bath home located in Beaumont, offering both comfort and opportunity at an attractive price point. This property features a functional layout with a spacious living area, a well-sized kitchen with ample cabinetry, and generously sized bedrooms perfect for families or tenants. Whether you’re a first-time homebuyer looking for a great starter home or an investor seeking to expand your real estate portfolio, this property checks all the boxes. With solid potential for value-add improvements, it presents an excellent opportunity for long-term appreciation or rental income. The large yard provides room for outdoor enjoyment, future additions, or customization to fit your needs. Conveniently located near schools, shopping, and major roadways, this home is ideal for both FHA buyers and cash investors looking for a smart, affordable acquisition.
Key facts
- 7,013 sq ft lot
- Built 1962
- Listed 61 days
Neighborhood map
What this means for you Summary
Snapshot
- This is a 4-bed/2.0-bath single-family listed at $85k.
Deal economics
- At list price, monthly cash flow is $568 ($7k/yr) — positive.
- The deal already cash-flows at list — no discount required.
- Meets the 1% rule at list price ($2k rent vs $85k).
- Recommended offer: $80k (6.0% below list) — sets the bar for market timing.
- Cap rate 15.2% vs local median 5.3% in Beaumont — top-decile yield for the area; either an underpriced asset or a hidden risk that comps aren't pricing in. Stress-test before assuming the spread holds.
Location & tenants
- Location reads 64/100 on livability (#739 in TX) — a middle-class / working-renter tenant base. Strengths: cost of living A+, housing A+, health & safety A+; Watch: employment D, schools D-, crime F.
- Beaumont ISD (urban): math 14% / reading 22% proficiency, ranked #789 of 826 in TX (top 96%) — low school quality limits family demand, transient renter base, plan for 1-2y turnover; 69% free/reduced lunch — lower-income household profile, screen leases tightly.
- Market conditions: 207 active listings in the ZIP; 4 comparable units currently listed for rent nearby; rentals at typical pace (median 24d on market — plan ~3-4 weeks tenant-placement turnaround); 343 units permitted in Jefferson County in 2024 (0 in 5+ unit buildings).
- This rent runs 35% of the median local income ($55k/yr) — at the standard rent-burdened threshold; future hikes will face affordability resistance.
Forward outlook
- Local home prices are declining (-3.0%/yr); year-one equity from $587 of loan paydown is wiped out by about $3k of value loss. Plan a longer hold.
- At projected returns (-3.0% appreciation + 3.0% rent growth), your $24k cash investment doubles in ~5 years — after that, you're playing with house money.
Negotiation context
- It's been on market 62 days — a 6% lower offer ($80k) is reasonable based on typical stale-listing flexibility.
Risks & watch-outs
- Watch-outs: flood insurance adds $66/mo.
- Climate carrying-cost: severe flood risk; severe wind risk, 99% chance of damaging wind over 30y; extreme-heat days projected 7→22/yr by 2055 (HVAC capex compounding) — expect insurance premiums to compound above CPI over the hold.
Questions for the listing agent
- It's been on market 62 days. Have you received any prior offers? Is the seller open to a 6% concession, seller financing, or rate buy-down credit?
- Built in 1962 — when were the roof, HVAC, electrical panel, plumbing, and water heater last replaced?
- What's the actual annual flood-insurance premium (NFIP or private), and is the property in a SFHA with mandatory coverage?
- Why hasn't it sold? Are there any deal-killer items the seller is aware of (foundation, flood, title, zoning, code violations)?
- Is there a deadline driving the sale (1031 exchange, divorce, estate, relocation)? That informs how much negotiation room exists.
- Schools are D-rated, which usually means shorter tenancies and higher turnover. Who's the typical renter profile here, and what's been the actual vacancy rate?
- Crime grade is F in this area — have there been break-ins, vandalism, or insurance claims at this property in the last 3 years? What carrier currently insures it and at what premium?
- What's the average days-on-market for RENTAL listings here right now (not sales)? A rising rental-DOM trend means longer vacancies and softer asking-rent achievability than the comps imply.
- What's the recent tenant-quality profile in this submarket — average credit score on applications, eviction rate, late-payment / NSF rate, and stable-employment percentage? A property-management company in the area should have these aggregated.
- How much new for-sale + rental construction is in the pipeline within 1–3 miles? Heavy new supply typically softens prices + rents 12–24 months out; constrained supply supports both.
Investment metrics
- 1% rule
- 1.89% ✓
- Cap rate
- 15.24%
- Cash-on-cash
- 31.97%
- DSCR
- 2.42
- GRM
- 4.4
CMA / ARV
- ARV (median comp)
- $120,569
- List price
- $84,999
- Delta
- -29.50%
- Verdict
- UNDERPRICED
- Comps
- 19 within 1.0 mi
Show comp detail 1 sale within ~0.75 mi
| Address | Dist | Beds/Ba | Sqft | Sold | Price | $/sf | Match |
|---|---|---|---|---|---|---|---|
| 4490 E Irene St | 0.68mi | 3/1.0 (-1) | 1,128 (+8%) | 4mo | $39,999 | $35 | 44 |
Match score weights: distance 35% · size 25% · config 20% · recency 20%. Top-matched comps best support the ARV.
Projected returns pro-forma
-3.0% appreciation · 3.0% rent growth · sell at horizon
- IRR
- 23.0%
- Equity multiple
- 1.94×
- Total profit
- $22,472
- Equity at exit
- $12,674
- IRR
- 31.0%
- Equity multiple
- 3.79×
- Total profit
- $66,499
- Equity at exit
- $7,349
Cash invested: $23,800 (down + closing). Projections, not guarantees.
Landlord ↔ Tenant lean methodology
- Overall (STATE)
- 87 Strongly Landlord-Friendly
- State Texas
- 87 Strongly Landlord-Friendly · R+5
- County
- — inherits STATE
- City
- — inherits STATE
ZIP-level market 77705
- Home prices YoY
- -29.7%
- Active inventory
- 207
- Price-to-rent
- 4.4×
Monthly cashflow live
- Estimated rent
- $1,605 medium interval (Pro) →
- Mortgage (P&I)
- −$446
- Tax from tax record
- −$152 /mo · $1,829/yr
- Insurance
- −$35
- Flood insurance flood zone
- −$66 /mo · $798/yr
- HOA
- −$0
- Vacancy / Maint / Mgmt
- −$337
- Net cashflow
- $568
Break-even live
UW: 25.0% down · 7.5% · 30yr · 1.5% tax · 5.0% vac · 8.0% maint · 8.0% mgmt
Financing live
Cash to close
- Down payment
- $21,250
- Closing costs
- $2,550
- Reserves months
- —
- Total cash needed
- —
Loan-product check · same deal, 3 products live
Conventional
25% down · 7.5% · 30yr
- Down + closing
- —
- Monthly P&I
- —
- Monthly cashflow
- —
- DSCR
- —
- Eligible?
- —
Personal DTI + credit; lowest rate.
DSCR
20% down · 8.5% · 30yr
- Down + closing
- —
- Monthly P&I
- —
- Monthly cashflow
- —
- DSCR
- —
- Eligible?
- —
No personal income docs; deal must DSCR.
Hard money
10% down · 12.0% · 12mo
- Down + closing
- —
- Monthly P&I
- —
- Monthly cashflow
- —
- DSCR
- —
- Eligible?
- —
Short-term bridge; refi at stabilization.
Rent comps 4 comps
| Address | Beds | Baths | Sqft | Rent | $/sqft | DOM | Units | Dist |
|---|---|---|---|---|---|---|---|---|
| 3255 Waverly St Beaumont, TX | 3.0 | 2.0 | 1152 | $1,600 | $1.39 | 23d | 1 | 0.18mi |
| 4455 S 5th St Beaumont, TX | 3.0 | 2.0 | 1437 | $1,500 | $1.04 | 13d | 1 | 0.75mi |
| 2450 S 8th St Beaumont, TX | 3.0 | 1.0 | 940 | $1,450 | $1.54 | 13d | 1 | 0.78mi |
| 4090 Lou St Beaumont, TX | 3.0 | 2.0 | 1281 | $1,675 | $1.31 | 43d | 1 | 1.03mi |
Listing history 9 events
-
2026-06-02days on market $84,999 Active 62 DOM
-
2026-06-01days on market $84,999 Active 61 DOM
-
2026-05-31days on market $84,999 Active 60 DOM
-
2026-05-30days on market $84,999 Active 59 DOM
-
2026-04-28price $84,999 893-char remark
Show marketing remark (893 chars)
Welcome to this charming 4-bedroom, 2-bath home located in Beaumont, offering both comfort and opportunity at an attractive price point. This property features a functional layout with a spacious living area, a well-sized kitchen with ample cabinetry, and generously sized bedrooms perfect for families or tenants. Whether you’re a first-time homebuyer looking for a great starter home or an investor seeking to expand your real estate portfolio, this property checks all the boxes. With solid potential for value-add improvements, it presents an excellent opportunity for long-term appreciation or rental income. The large yard provides room for outdoor enjoyment, future additions, or customization to fit your needs. Conveniently located near schools, shopping, and major roadways, this home is ideal for both FHA buyers and cash investors looking for a smart, affordable acquisition.
-
2026-04-28price $87,999 893-char remark
Show marketing remark (893 chars)
Welcome to this charming 4-bedroom, 2-bath home located in Beaumont, offering both comfort and opportunity at an attractive price point. This property features a functional layout with a spacious living area, a well-sized kitchen with ample cabinetry, and generously sized bedrooms perfect for families or tenants. Whether you’re a first-time homebuyer looking for a great starter home or an investor seeking to expand your real estate portfolio, this property checks all the boxes. With solid potential for value-add improvements, it presents an excellent opportunity for long-term appreciation or rental income. The large yard provides room for outdoor enjoyment, future additions, or customization to fit your needs. Conveniently located near schools, shopping, and major roadways, this home is ideal for both FHA buyers and cash investors looking for a smart, affordable acquisition.
-
2026-04-02$89,999 Active 893-char remark
Show marketing remark (893 chars)
Welcome to this charming 4-bedroom, 2-bath home located in Beaumont, offering both comfort and opportunity at an attractive price point. This property features a functional layout with a spacious living area, a well-sized kitchen with ample cabinetry, and generously sized bedrooms perfect for families or tenants. Whether you’re a first-time homebuyer looking for a great starter home or an investor seeking to expand your real estate portfolio, this property checks all the boxes. With solid potential for value-add improvements, it presents an excellent opportunity for long-term appreciation or rental income. The large yard provides room for outdoor enjoyment, future additions, or customization to fit your needs. Conveniently located near schools, shopping, and major roadways, this home is ideal for both FHA buyers and cash investors looking for a smart, affordable acquisition.
-
2022-06-23soldstatus
-
2007-06-14soldstatus
ⓘ Source: listings_history table (triggers on properties + properties_extension) + one-shot
backfill from property_details.listing_events for pre-trigger history.
Tax reassessment forecast TX · Resets to sale price
- Current annual tax
- $1,829 · $152/mo
- Projected year-2 tax
- $1,829 · $152/mo
- Expected delta
- $0/yr ($0/mo · 0.0%)
ⓘ Screening estimate from a state-policy table — verify with the county assessor before closing.
Climate risk First Street
- Flood 8/10 Severe FEMA zone X · 99% chance over 30 yrs
- Wildfire 1/10 Low
- Heat 9/10 Extreme 7 d/yr ≥109°F today · 22 d/yr by 30 yrs out
- Wind 9/10 Extreme 99% chance of damaging wind over 30 yrs
- Air quality 2/10 Low 1 unhealthy d/yr today · 1 by 30 yrs out
Nearby sold comps map
Loading sold comps map…
Walkable amenities ~0.75 mi
Loading nearby amenities…
Taxation est. · year 1
- Rental income
- $19,255
- − Mortgage interest
- −$4,761
- − Property taxes
- −$1,829
- − Insurance
- −$1,222
- − Repairs & maintenance
- −$1,540
- − Management
- −$1,540
- − Depreciation
- −$2,473
- Taxable income
- $5,889
- Est. tax owed @ 24.0%
- −$1,413
- After-tax cash flow
- $5,398/yr
For passive investors: Depreciation is non-cash, so a rental often shows a tax loss while cash-flowing — sheltering income. Rental losses are passive: they offset passive income freely, and up to $25,000/yr can offset ordinary (W-2) income if you actively participate and your MAGI is under $100k (phasing out to $0 by $150k); unused losses carry forward. On sale, claimed depreciation is recaptured at up to 25%, and gains may owe capital-gains tax (a 1031 exchange can defer both). Figures are a year-1 estimate at your 24.0% rate — not tax advice; consult a CPA.
Schools (NCES district)
- District
- Beaumont ISD
- NCES district ID
- 4809670
- Math proficiency
- 14% ▼ -13.00%
- Reading proficiency
- 22% ▼ -7.00%
- Median HH income
- $41,683
- Composite
- 15.43/100
- National rank
- #9316
- State rank
- #789 of 826 in TX
Livability — Beaumont
- Score
- 64/100
- State rank
- #739
- US rank
- #13710
Category grades
Schools grade is shown separately in the Schools card above.
Census & demographics
- Census place
- Beaumont, TX
- County
- Jefferson County · 203,592 people
- City population
- 125,901
- Metro
- Beaumont-Port Arthur, TX
- Population (ZIP)
- 38,259
- Household income
- $54,633
- Rent vs Own
- Severe rent burden
- 776.0
Population outlook (Jefferson County) Hauer SSP2
- Today (2025)
- 259,015 people
- By 2030
- 260,685 · +0.6%
- By 2040
- 263,309 · +1.7%
- By 2050
- 265,237 · +2.4%
- By 2075
- 270,193 · +4.3%
- By 2100
- 255,628 · -1.3%
Race, ethnicity, and origin ACS 2023
- Neighborhood character
- Diverse neighborhood (Simpson 0.66)
- Race & ethnicity
- Black 46% White 29% Hispanic / Latino 21% Two or more races 6% Asian 2%
- Hispanic origin (detail)
- Mexican 13%
- Common ancestry
- Lithuanian 5% Italian 1%
- Foreign-born
- 8% · Canada, Vietnam
- Languages at home
- 80% English-only · Spanish 18% Other Indo-European 1%
Political lean MEDSL · Jefferson
- 2024 margin
- Lean R (+8.9) · D 45.1% · R 54.0%
- 2008→2024 swing
- -11.1pp toward R · 2008: 2.2pp · 2024: -8.9pp
- All cycles
- 2024: R+8.9 2020: R+1.6 2016: R+0.5 2012: D+1.6 2008: D+2.2
Not yet ingested
- Civics
- —
Market trends
- HPI YoY
- ▼ -54.76%
- Current HPI
- 129.3696
- Rent YoY
- —
- Metro
- Beaumont-Port Arthur, TX
- State GDP YoY
- ▲ 3.95%
- F500 in state
- 110
Industry mix (Fortune 500 HQ in TX)
| Industry | F500 HQs | Revenue |
|---|---|---|
| Energy | 16 | $1,198B |
|
||
| Technology | 5 | $198B |
|
||
| Engineering / Construction | 4 | $72B |
|
||
| Energy Services | 3 | $60B |
|
||
| Utilities | 3 | $41B |
|
||
| Healthcare | 2 | $330B |
|
||
Price history
-5.6% since first listed5 events — show timeline
- 2026-04-28 Price Changed $84,999 NTREIS
- 2026-04-28 Price Changed $87,999 NTREIS
- 2026-04-02 Listed $89,999 NTREIS
- 2022-06-23 Sold (Public Records) — Public Records
- 2007-06-14 Sold (Public Records) — Public Records
Property tax history
+7.4%/yrLatest (2025): $1,829 · +9.1% YoY. Source: county tax records.
Cash-flow waterfall
monthlySold comps — $/sqft
last 12 mo · ≤1 miLoading sold comps…