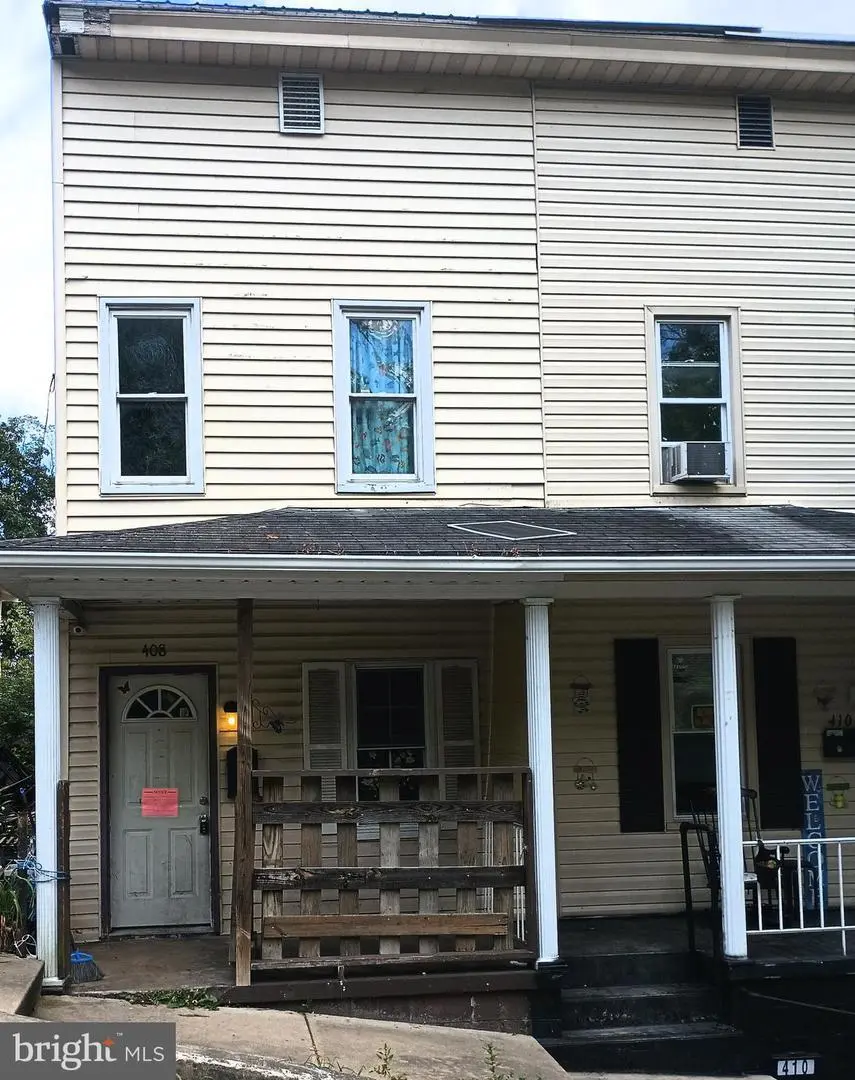
408 Chestnut St · Cumberland, MD
Flood risk 1/10 · Minimal
- FEMA flood zone
- X (unshaded)
- Chance of flooding over 30 yrs
- 0.0%
- Est. flood insurance / yr
- $473 – $860
Fire risk 3/10 · Minor
- Est. fire insurance / yr
- $755 – $1,403
Heat risk 5/10 · Moderate
- Hot days now (above 101°F)
- 7 days/yr
- Hot days in 30 yrs
- 18 days/yr
Wind risk 2/10 · Minimal
- Chance of severe wind over 30 yrs
- —
Air-quality risk 2/10 · Minimal
- Unhealthy air days now
- 0 days/yr
- Unhealthy air days in 30 yrs
- 1 days/yr
Risk factors via First Street. Map © Google.
Why this score? — see what drove the C+ grade
The composite is a weighted blend of 9 inputs, each scored 0–100. Each bar is that input's sub-score; the figure is the points it added to the 100-point composite (weight × sub-score).
- Cash flow +30.0/30.0
- 1% rule +10.0/10.0
- DSCR +10.0/10.0
- Rent growth +5.0/5.0
- Livability +3.9/5.0
- Condition / age +2.5/5.0
- Schools +1.9/10.0
- ARV discount +0.0/15.0
- Appreciation +0.0/10.0
$54,900
🖨 Deal sheet 📄 Offer letter ✓ Due diligence
Listing remarks MLS
3BR/1B home convenient to all amenities. Front and back porch. Perfect for investment.
Key facts
- Front and back porch
- 2,515 sq ft lot
- Built 1900
Tags
Neighborhood map
What this means for you Summary
Snapshot
- This is a 3-bed/1.0-bath townhouse listed at $55k.
Deal economics
- At list price, monthly cash flow is $637 ($8k/yr) — positive.
- The deal already cash-flows at list — no discount required.
- Meets the 1% rule at list price ($1k rent vs $55k).
- Recommended offer: $48k (12.0% below list) — sets the bar for market timing.
- Cap rate 20.2% vs local median 6.7% in Cumberland — top-decile yield for the area; either an underpriced asset or a hidden risk that comps aren't pricing in. Stress-test before assuming the spread holds.
Location & tenants
- Location reads 78/100 on livability (#64 in MD, #2,385 nationally) — a middle-class / working-renter tenant base. Strengths: amenities A+, commute A+, cost of living A+; Watch: schools D+, crime F, employment F.
- Allegany County Public Schools (other): math 15% / reading 30% proficiency, ranked #18 of 24 in MD (top 75%) — low school quality limits family demand, transient renter base, plan for 1-2y turnover.
- Market conditions: Rents rising fast (+10.9%/yr); 235 active listings in the ZIP; 7 comparable units currently listed for rent nearby; rentals lingering (median 44d on market — plan ~5-8 weeks vacancy on turnover, expect pricing pressure); 100% of comp listings sitting > 30 days — soft ceiling on asking rent; 24 units permitted in Allegany County in 2024 (0 in 5+ unit buildings).
Forward outlook
- Local home prices are declining (-3.0%/yr); year-one equity from $380 of loan paydown is wiped out by about $2k of value loss. Plan a longer hold.
- Allegany County population projected at -14% by 2050 — secular population decline; favor cash flow + early exit over multi-decade hold.
- At projected returns (-3.0% appreciation + 8.0% rent growth), your $15k cash investment doubles in ~3 years — after that, you're playing with house money.
Negotiation context
- It's been on market 266 days — a 12% lower offer ($48k) is reasonable based on typical stale-listing flexibility.
- 3 sale attempts since 28y ago; this cycle's ask has dropped $5k (8%) from the opening price — seller is motivated, your offer sets the floor, not the list.
- Current owner paid $33k; list at $55k implies a 66% gain — meaningful room to come down on a strong offer.
Risks & watch-outs
- Watch-outs: built in 1900 — expect roof / HVAC / electrical / plumbing capex.
- Climate carrying-cost: extreme-heat days projected 7→18/yr by 2055 (HVAC capex compounding) — expect insurance premiums to compound above CPI over the hold.
Questions for the listing agent
- It's been on market 266 days. Have you received any prior offers? Is the seller open to a 12% concession, seller financing, or rate buy-down credit?
- Built in 1900 — when were the roof, HVAC, electrical panel, plumbing, and water heater last replaced?
- Why hasn't it sold? Are there any deal-killer items the seller is aware of (foundation, flood, title, zoning, code violations)?
- Is there a deadline driving the sale (1031 exchange, divorce, estate, relocation)? That informs how much negotiation room exists.
- Schools are D-rated, which usually means shorter tenancies and higher turnover. Who's the typical renter profile here, and what's been the actual vacancy rate?
- Crime grade is F in this area — have there been break-ins, vandalism, or insurance claims at this property in the last 3 years? What carrier currently insures it and at what premium?
- What's the average days-on-market for RENTAL listings here right now (not sales)? A rising rental-DOM trend means longer vacancies and softer asking-rent achievability than the comps imply.
- What's the recent tenant-quality profile in this submarket — average credit score on applications, eviction rate, late-payment / NSF rate, and stable-employment percentage? A property-management company in the area should have these aggregated.
- How much new for-sale + rental construction is in the pipeline within 1–3 miles? Heavy new supply typically softens prices + rents 12–24 months out; constrained supply supports both.
Investment metrics
- 1% rule
- 2.25% ✓
- Cap rate
- 20.21%
- Cash-on-cash
- 49.71%
- DSCR
- 3.21
- GRM
- 3.7
CMA / ARV
- ARV (median comp)
- $44,417
- List price
- $54,900
- Delta
- 23.60%
- Verdict
- OVERPRICED
- Comps
- 20 within 1.0 mi
Show comp detail 3 sales within ~0.75 mi
| Address | Dist | Beds/Ba | Sqft | Sold | Price | $/sf | Match |
|---|---|---|---|---|---|---|---|
| 727 Shawnee Ave | 0.45mi | 2/1.0 (-1) | 1,008 (-8%) | 3mo | $65,000 | $64 | 59 |
| 217 Pear St | 0.28mi | 2/1.0 (-1) | 1,140 (+4%) | 24mo | $60,000 | $53 | 55 |
| 219 Pear St | 0.28mi | 2/1.0 (-1) | 1,205 (+10%) | 12mo | $47,000 | $39 | 55 |
Match score weights: distance 35% · size 25% · config 20% · recency 20%. Top-matched comps best support the ARV.
Projected returns pro-forma
-3.0% appreciation · 8.0% rent growth · sell at horizon
- IRR
- 52.8%
- Equity multiple
- 3.48×
- Total profit
- $38,191
- Equity at exit
- $8,186
- IRR
- 59.9%
- Equity multiple
- 8.49×
- Total profit
- $115,196
- Equity at exit
- $4,747
Cash invested: $15,372 (down + closing). Projections, not guarantees.
Landlord ↔ Tenant lean methodology
- Overall (STATE)
- 27 Tenant-Leaning
- State Maryland
- 27 Tenant-Leaning · D+14
- County
- — inherits STATE
- City
- — inherits STATE
ZIP-level market 21502
- Home prices YoY
- -17.4%
- Rents YoY
- 10.9%
- Active inventory
- 235
- Price-to-rent
- 3.7×
Monthly cashflow live
- Estimated rent
- $1,236 high interval (Pro) →
- Mortgage (P&I)
- −$288
- Tax from tax record
- −$29 /mo · $348/yr
- Insurance
- −$23
- HOA
- −$0
- Vacancy / Maint / Mgmt
- −$260
- Net cashflow
- $637
Break-even live
UW: 25.0% down · 7.5% · 30yr · 1.5% tax · 5.0% vac · 8.0% maint · 8.0% mgmt
Financing live
Cash to close
- Down payment
- $13,725
- Closing costs
- $1,647
- Reserves months
- —
- Total cash needed
- —
Loan-product check · same deal, 3 products live
Conventional
25% down · 7.5% · 30yr
- Down + closing
- —
- Monthly P&I
- —
- Monthly cashflow
- —
- DSCR
- —
- Eligible?
- —
Personal DTI + credit; lowest rate.
DSCR
20% down · 8.5% · 30yr
- Down + closing
- —
- Monthly P&I
- —
- Monthly cashflow
- —
- DSCR
- —
- Eligible?
- —
No personal income docs; deal must DSCR.
Hard money
10% down · 12.0% · 12mo
- Down + closing
- —
- Monthly P&I
- —
- Monthly cashflow
- —
- DSCR
- —
- Eligible?
- —
Short-term bridge; refi at stabilization.
Rent comps 7 comps
| Address | Beds | Baths | Sqft | Rent | $/sqft | DOM | Units | Dist |
|---|---|---|---|---|---|---|---|---|
| 423 Furnace St Cumberland, MD | 3.0 | 1.5 | 1440 | $1,250 | $0.87 | 44d | 1 | 0.13mi |
| 118 Independence St Cumberland, MD | 3.0 | 1.5 | 1260 | $1,250 | $0.99 | 44d | 1 | 0.27mi |
| 516 Bedford St Cumberland, MD | 3.0 | 1.5 | 1500 | $1,195 | $0.80 | 44d | 1 | 0.31mi |
| 529 N Centre St Unit Rear Cumberland, MD | 2.0 | 1.0 | 982 | $850 | $0.87 | 44d | 1 | 0.31mi |
| 418 N Mechanic St Unit 1B Cumberland, MD | 2.0 | 1.0 | 1000 | $1,195 | $1.20 | 44d | 1 | 0.34mi |
| 418 N Mechanic St Unit 1C Cumberland, MD | 3.0 | 1.0 | 1500 | $1,295 | $0.86 | 44d | 1 | 0.34mi |
| 201 Spring St Cumberland, MD | 3.0 | 1.0 | 1332 | $950 | $0.71 | 44d | 1 | 1.04mi |
Listing history 22 events
-
2026-06-19days on market $54,900 Active 266 DOM
-
2026-06-18days on market $54,900 Active 265 DOM
-
2026-06-17days on market $54,900 Active 264 DOM
-
2026-06-16days on market $54,900 Active 263 DOM
-
2026-06-15days on market $54,900 Active 262 DOM
-
2026-06-14days on market $54,900 Active 260 DOM
-
2026-06-12days on market $54,900 Active 259 DOM
-
2026-06-09days on market $54,900 Active 256 DOM
-
2026-06-08days on market $54,900 Active 255 DOM
-
2026-06-07days on market $54,900 Active 254 DOM
-
2026-06-02days on market $54,900 Active 249 DOM
-
2026-06-01days on market $54,900 Active 248 DOM
-
2026-05-31days on market $54,900 Active 247 DOM
-
2026-05-30days on market $54,900 Active 246 DOM
-
2026-02-25price $54,900 86-char remark
Show marketing remark (86 chars)
3BR/1B home convenient to all amenities. Front and back porch. Perfect for investment.
-
2025-11-03price $57,900 86-char remark
Show marketing remark (86 chars)
3BR/1B home convenient to all amenities. Front and back porch. Perfect for investment.
-
2025-09-26$59,700 Active 86-char remark
Show marketing remark (86 chars)
3BR/1B home convenient to all amenities. Front and back porch. Perfect for investment.
-
2004-11-24soldstatus $33,000 373-char remark
Show marketing remark (373 chars)
NEW EVERYTHING W/ W CARPET WITH WARRANTY TRANSFERALBE TO BUYER. This is a completely remodeled half of double 2 bedrooms 1 full bath. Owner will consider a bulk purchase with properties 404 and 406 Chestnut. BRING ALL OFFERS!!! AGENTS TAKE NOTICE NOW OFFERING $1000.00 SELLING BONUS WITH ACCEPTABLE OFFER. Home comes with all appliances and they convey in as is condition.
-
2004-10-18historical 373-char remark
Show marketing remark (373 chars)
NEW EVERYTHING W/ W CARPET WITH WARRANTY TRANSFERALBE TO BUYER. This is a completely remodeled half of double 2 bedrooms 1 full bath. Owner will consider a bulk purchase with properties 404 and 406 Chestnut. BRING ALL OFFERS!!! AGENTS TAKE NOTICE NOW OFFERING $1000.00 SELLING BONUS WITH ACCEPTABLE OFFER. Home comes with all appliances and they convey in as is condition.
-
2004-04-22$38,000 373-char remark
Show marketing remark (373 chars)
NEW EVERYTHING W/ W CARPET WITH WARRANTY TRANSFERALBE TO BUYER. This is a completely remodeled half of double 2 bedrooms 1 full bath. Owner will consider a bulk purchase with properties 404 and 406 Chestnut. BRING ALL OFFERS!!! AGENTS TAKE NOTICE NOW OFFERING $1000.00 SELLING BONUS WITH ACCEPTABLE OFFER. Home comes with all appliances and they convey in as is condition.
-
1998-11-30historical
-
1998-03-01
ⓘ Source: listings_history table (triggers on properties + properties_extension) + one-shot
backfill from property_details.listing_events for pre-trigger history.
Tax reassessment forecast MD · Partial reset (capped growth)
- Current annual tax
- $348 · $29/mo
- Projected year-2 tax
- $473 · $39/mo
- Expected delta
- +$125/yr (+$10/mo · 35.9%)
ⓘ Screening estimate from a state-policy table — verify with the county assessor before closing.
Climate risk First Street
- Flood 1/10 Low FEMA zone X (unshaded) · 0% chance over 30 yrs
- Wildfire 3/10 Moderate
- Heat 5/10 Major 7 d/yr ≥101°F today · 18 d/yr by 30 yrs out
- Wind 2/10 Low
- Air quality 2/10 Low 0 unhealthy d/yr today · 1 by 30 yrs out
Nearby sold comps map
Loading sold comps map…
Walkable amenities ~0.75 mi
Loading nearby amenities…
Taxation est. · year 1
- Rental income
- $14,835
- − Mortgage interest
- −$3,075
- − Property taxes
- −$348
- − Insurance
- −$274
- − Repairs & maintenance
- −$1,187
- − Management
- −$1,187
- − Depreciation
- −$1,597
- Taxable income
- $7,166
- Est. tax owed @ 24.0%
- −$1,720
- After-tax cash flow
- $5,922/yr
For passive investors: Depreciation is non-cash, so a rental often shows a tax loss while cash-flowing — sheltering income. Rental losses are passive: they offset passive income freely, and up to $25,000/yr can offset ordinary (W-2) income if you actively participate and your MAGI is under $100k (phasing out to $0 by $150k); unused losses carry forward. On sale, claimed depreciation is recaptured at up to 25%, and gains may owe capital-gains tax (a 1031 exchange can defer both). Figures are a year-1 estimate at your 24.0% rate — not tax advice; consult a CPA.
Schools (NCES district)
- District
- Allegany County Public Schools
- NCES district ID
- 2400030
- Math proficiency
- 15% ▼ -26.00%
- Reading proficiency
- 30% ▼ -20.00%
- Median HH income
- $39,760
- Composite
- 18.95/100
- National rank
- #8854
- State rank
- #18 of 24 in MD
Livability — Cumberland
- Score
- 78/100
- State rank
- #64
- US rank
- #2385
Category grades
Schools grade is shown separately in the Schools card above.
Census & demographics
- Census place
- Cumberland, MD
- County
- Allegany County · 41,015 people
- City population
- 41,015
- Metro
- Cumberland, MD-WV
- Population (ZIP)
- 41,015
- Household income
- $60,725
- Rent vs Own
- Severe rent burden
- 824.0
Population outlook (Allegany County) Hauer SSP2
- Today (2025)
- 68,778 people
- By 2030
- 66,766 · -2.9%
- By 2040
- 62,784 · -8.7%
- By 2050
- 59,179 · -14.0%
- By 2075
- 50,732 · -26.2%
- By 2100
- 40,837 · -40.6%
Race, ethnicity, and origin ACS 2023
- Neighborhood character
- Predominantly White (83%)
- Race & ethnicity
- White 83% Black 9% Two or more races 5% Hispanic / Latino 2%
- Common ancestry
- Slovak 3% Romanian 2% Italian 1%
- Foreign-born
- 2% · Canada
- Languages at home
- 96% English-only · Spanish 2%
Political lean MEDSL · Allegany
- 2024 margin
- Solid R (+40.3) · D 28.9% · R 69.2% · Other 2.0%
- 2008→2024 swing
- -14.4pp toward R · 2008: -25.9pp · 2024: -40.3pp
- All cycles
- 2024: R+40.3 2020: R+38.3 2016: R+48.0 2012: R+32.9 2008: R+25.9
Not yet ingested
- Civics
- —
Market trends
- HPI YoY
- ▼ -54.33%
- Current HPI
- 258.6676
- Rent YoY
- ▲ 10.88%
- Metro
- Cumberland, MD-WV
- State GDP YoY
- ▲ 2.97%
- F500 in state
- 12
Industry mix (Fortune 500 HQ in MD)
| Industry | F500 HQs | Revenue |
|---|---|---|
| Aerospace / Defense | 1 | $71B |
|
||
| Utilities | 1 | $25B |
|
||
| Hotels | 1 | $24B |
|
||
| Consumer Goods | 1 | $7B |
|
||
| Real Estate | 1 | $6B |
|
||
| Chemicals | 1 | $2B |
|
||
Price history
+44.5% since first listed8 events — show timeline
- 2026-02-25 Price Changed $54,900 BRIGHT MLS
- 2025-11-03 Price Changed $57,900 BRIGHT MLS
- 2025-09-26 Listed $59,700 BRIGHT MLS
- 2004-11-24 Sold (MLS) $33,000 MRIS
- 2004-10-18 Delisted — MRIS
- 2004-04-22 Listed $38,000 MRIS
- 1998-11-30 Delisted — MRIS
- 1998-03-01 Listed — MRIS
Property tax history
+0.6%/yrLatest (2025): $348 · +22.4% YoY. Source: county tax records.
Cash-flow waterfall
monthlySold comps — $/sqft
last 12 mo · ≤1 miLoading sold comps…