0 Riptide Ct · Gulf Shores, AL
Flood risk No data
- FEMA flood zone
- —
- Chance of flooding over 30 yrs
- —
- Est. flood insurance / yr
- —
Fire risk No data
- Est. fire insurance / yr
- —
Heat risk No data
- Hot days now (above threshold)
- —
- Hot days in 30 yrs
- —
Wind risk No data
- Chance of severe wind over 30 yrs
- —
Air-quality risk No data
- Unhealthy air days now
- —
- Unhealthy air days in 30 yrs
- —
Risk factors via First Street. Map © Google.
Why this score? — see what drove the C- grade
The composite is a weighted blend of 9 inputs, each scored 0–100. Each bar is that input's sub-score; the figure is the points it added to the 100-point composite (weight × sub-score).
- Cash flow +18.5/30.0
- ARV discount +7.5/15.0
- DSCR +5.8/10.0
- 1% rule +5.1/10.0
- Schools +5.0/10.0
- Condition / age +4.0/5.0
- Livability +3.5/5.0
- Rent growth +3.4/5.0
- Appreciation +0.0/10.0
$179,000
🖨 Deal sheet 📄 Offer letter ✓ Due diligence
Listing remarks
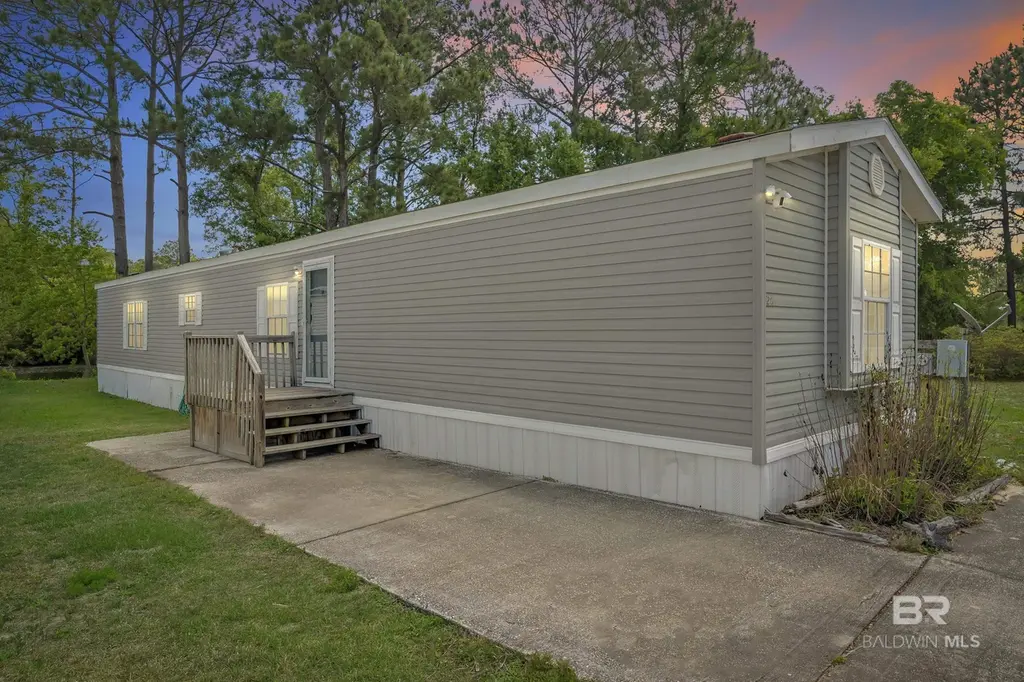
Conveniently located just minutes from the white-sand beaches, dining, and local attractions. Enjoy coastal living at an unbeatable value with easy access to everything the area has to offer. Buyer to verify all information during due diligence.
Key facts
- 4,007 sq ft lot
- Built 2005
- Listed 59 days
Property features AI
Finance
- Other: Building area reported as 1,216 square feet (assessor)
- HOA & community: Annual association fee of $300 (includes: other — see remarks); No community amenities listed; No transfer fee
Exterior
- Parking: Side entrance
- Utilities: Gulf Shores Utilities; Cable connected; Electric provided by Baldwin EMC; Has heating
- Home design: One story; Resale property
- Construction: Vinyl siding; Other siding/materials; Composition roof
- Exterior features: Less than 1 acre lot; No waterfront; Whole/full ownership
Interior
- Kitchen: Dishwasher; Convection oven; Electric range; Cooktop
- Flooring: Carpet; Other flooring (see remarks)
- Bathrooms: 2 full bathrooms
- Heating & cooling: Electric heating
- Interior features: Internet access available; No fireplace; Unfurnished
Neighborhood map
What this means for you Summary
Snapshot
- This is a 3-bed/2.0-bath single-family listed at $179k. Condition is rated good.
Deal economics
- At list price, monthly cash flow is $171 ($2k/yr) — positive.
- The deal already cash-flows at list — no discount required.
- Meets the 1% rule at list price ($2k rent vs $179k).
- Recommended offer: $174k (3.0% below list) — sets the bar for market timing.
- Cap rate 7.4% vs local median 0.2% in Gulf Shores — top-decile yield for the area; either an underpriced asset or a hidden risk that comps aren't pricing in. Stress-test before assuming the spread holds.
Location & tenants
- Location reads 69/100 on livability (#61 in AL) — a middle-class / working-renter tenant base. Strengths: health & safety A+, housing B+; Watch: amenities F, commute F.
- Zoned schools: Gulf Shores Elementary School (math 47% / reading 72%, grade B-, #63 of 627 statewide, top 10%, 1,062 students, 44% FRL); Gulf Shores Middle School (math 34% / reading 62%, grade C-, #29 of 257 statewide, top 12%, 589 students, 48% FRL); Gulf Shores High School (math 42% / reading 47%, grade F, #22 of 305 statewide, top 8%, 799 students, 37% FRL).
- Market conditions: Rents rising (+3.7%/yr); 1191 active listings in the ZIP; solid renter incomes; 3,883 units permitted in Baldwin County in 2024 (481 in 5+ unit buildings).
Forward outlook
- Local home prices are declining (-3.0%/yr); year-one equity from $1k of loan paydown is wiped out by about $5k of value loss. Plan a longer hold.
- Baldwin County population projected at +42% by 2050 — long-run rental-demand tailwind backs the buy-and-hold thesis.
Negotiation context
- It's been on market 60 days — a 3% lower offer ($174k) is reasonable based on typical stale-listing flexibility.
Questions for the listing agent
- It's been on market 60 days. Have you received any prior offers? Is the seller open to a 3% concession, seller financing, or rate buy-down credit?
- What does the HOA fee cover, when was the last increase, and are there any pending special assessments or reserve-fund shortfalls?
- Is there a deadline driving the sale (1031 exchange, divorce, estate, relocation)? That informs how much negotiation room exists.
- Schools are B-rated — typically a magnet for longer-tenancy family renters. What's the average tenant stay here, and is there a school-zone premium baked into asking?
- What's the average days-on-market for RENTAL listings here right now (not sales)? A rising rental-DOM trend means longer vacancies and softer asking-rent achievability than the comps imply.
- What's the recent tenant-quality profile in this submarket — average credit score on applications, eviction rate, late-payment / NSF rate, and stable-employment percentage? A property-management company in the area should have these aggregated.
- How much new for-sale + rental construction is in the pipeline within 1–3 miles? Heavy new supply typically softens prices + rents 12–24 months out; constrained supply supports both.
Investment metrics
- 1% rule
- 1.01% ✓
- Cap rate
- 7.44%
- Cash-on-cash
- 4.10%
- DSCR
- 1.18
- GRM
- 8.2
CMA / ARV
- ARV (on-the-fly)
- $494,912
- Comps found
- 2
Show comp detail 2 sales within ~0.75 mi
| Address | Dist | Beds/Ba | Sqft | Sold | Price | $/sf | Match |
|---|---|---|---|---|---|---|---|
| 16605 Brigadoon Trl | 0.41mi | 3/2.0 | 1,350 (+11%) | 8mo | $549,750 | $407 | 56 |
| 2417 Twin Pines Cir | 0.74mi | 3/2.0 | 1,342 (+10%) | 21mo | $289,000 | $215 | 30 |
Match score weights: distance 35% · size 25% · config 20% · recency 20%. Top-matched comps best support the ARV.
Projected returns pro-forma
-3.0% appreciation · 3.71% rent growth · sell at horizon
- IRR
- -9.1%
- Equity multiple
- 0.67×
- Total profit
- $-16,763
- Equity at exit
- $26,689
- IRR
- 1.4%
- Equity multiple
- 1.10×
- Total profit
- $5,038
- Equity at exit
- $15,477
Cash invested: $50,120 (down + closing). Projections, not guarantees.
Landlord ↔ Tenant lean methodology
- Overall (STATE)
- 90 Strongly Landlord-Friendly
- State Alabama
- 90 Strongly Landlord-Friendly · R+15
- County
- — inherits STATE
- City
- — inherits STATE
ZIP-level market 36542
- Rents YoY
- 3.7%
- Active inventory
- 1191
- Price-to-rent
- 8.2×
Monthly cashflow live
- Estimated rent
- $1,814 medium interval (Pro) →
- Mortgage (P&I)
- −$939
- Tax est. 1.5%
- −$224 /mo · $2,685/yr
- Insurance
- −$75
- HOA
- −$25
- Vacancy / Maint / Mgmt
- −$381
- Net cashflow
- $171
Break-even live
UW: 25.0% down · 7.5% · 30yr · 1.5% tax · 5.0% vac · 8.0% maint · 8.0% mgmt
Financing live
Cash to close
- Down payment
- $44,750
- Closing costs
- $5,370
- Reserves months
- —
- Total cash needed
- —
Loan-product check · same deal, 3 products live
Conventional
25% down · 7.5% · 30yr
- Down + closing
- —
- Monthly P&I
- —
- Monthly cashflow
- —
- DSCR
- —
- Eligible?
- —
Personal DTI + credit; lowest rate.
DSCR
20% down · 8.5% · 30yr
- Down + closing
- —
- Monthly P&I
- —
- Monthly cashflow
- —
- DSCR
- —
- Eligible?
- —
No personal income docs; deal must DSCR.
Hard money
10% down · 12.0% · 12mo
- Down + closing
- —
- Monthly P&I
- —
- Monthly cashflow
- —
- DSCR
- —
- Eligible?
- —
Short-term bridge; refi at stabilization.
HOA detail
- Monthly dues
- $25 · $300/yr
Listing history 16 events
-
2026-06-19days on market $179,000 Active 60 DOM
-
2026-06-18days on market $179,000 Active 59 DOM
-
2026-06-17days on market $179,000 Active 58 DOM
-
2026-06-16days on market $179,000 Active 57 DOM
-
2026-06-15days on market $179,000 Active 56 DOM
-
2026-06-14days on market $179,000 Active 54 DOM
-
2026-06-13days on market $179,000 Active 53 DOM
-
2026-06-10days on market $179,000 Active 51 DOM
-
2026-06-09days on market $179,000 Active 50 DOM
-
2026-06-08days on market $179,000 Active 49 DOM
-
2026-06-07days on market $179,000 Active 48 DOM
-
2026-06-02days on market $179,000 Active 43 DOM
-
2026-06-01days on market $179,000 Active 42 DOM
-
2026-05-31days on market $179,000 Active 41 DOM
-
2026-05-30remarks 245-char remark
-
2026-05-30$179,000 Active 40 DOM
ⓘ Source: listings_history table (triggers on properties + properties_extension) + one-shot
backfill from property_details.listing_events for pre-trigger history.
Nearby sold comps map
Loading sold comps map…
Walkable amenities ~0.75 mi
Loading nearby amenities…
Taxation est. · year 1
- Rental income
- $21,768
- − Mortgage interest
- −$10,027
- − Property taxes
- −$2,685
- − Insurance
- −$895
- − Repairs & maintenance
- −$1,741
- − Management
- −$1,741
- − HOA
- −$300
- − Depreciation
- −$5,207
- Taxable loss
- −$829
- Est. tax savings @ 24.0%
- +$199
- After-tax cash flow
- $2,252/yr
For passive investors: Depreciation is non-cash, so a rental often shows a tax loss while cash-flowing — sheltering income. Rental losses are passive: they offset passive income freely, and up to $25,000/yr can offset ordinary (W-2) income if you actively participate and your MAGI is under $100k (phasing out to $0 by $150k); unused losses carry forward. On sale, claimed depreciation is recaptured at up to 25%, and gains may owe capital-gains tax (a 1031 exchange can defer both). Figures are a year-1 estimate at your 24.0% rate — not tax advice; consult a CPA.
Condition & rehab AI · 12 photos
This home is in good condition with a cosmetic rehab level, featuring a well-maintained exterior and interior. It has potential for value increase through minor repairs and updates, such as painting and replacing countertops.
Repairs flagged
- Minor Kitchen countertops — Wear on countertops indicates need for replacement or resurfacing.
Value-add opportunities
- Both Paint and touch-up the interior walls — Fresh paint can enhance the home's appearance and appeal to potential buyers.
- Both Replace kitchen countertops — New countertops can improve functionality and aesthetics, making the home more appealing to both buyers and renters.
Renovation cost estimate screening
| Repair item | Severity | Est. cost |
|---|---|---|
| Kitchen countertops · Wear on countertops indicates need for replacement or resurfacing. | Minor | $500–3,000 |
| Total estimated repair cost · 1 items | $500–3,000 |
Value-add ROI direction
- Both Paint and touch-up the interior walls — Fresh paint can enhance the home's appearance and appeal to potential buyers. ↑
- Both Replace kitchen countertops — New countertops can improve functionality and aesthetics, making the home more appealing to both buyers and renters. ↑
ⓘ Cost ranges are severity-bucket heuristics (US national rule-of-thumb). Get contractor quotes + a written scope before underwriting a rehab budget.
Schools (NCES district)
No district data.
Livability — Gulf Shores
- Score
- 69/100
- State rank
- #61
- US rank
- #8945
Category grades
Schools grade is shown separately in the Schools card above.
Census & demographics
- Census place
- Gulf Shores, AL
- County
- Baldwin County · 181,514 people
- City population
- 18,906
- Metro
- Daphne-Fairhope-Foley, AL
- Population (ZIP)
- 18,906
- Household income
- $79,639
- Rent vs Own
- Severe rent burden
- 522.0
Population outlook (Baldwin County) Hauer SSP2
- Today (2025)
- 248,264 people
- By 2030
- 270,315 · +8.9%
- By 2040
- 312,967 · +26.1%
- By 2050
- 352,262 · +41.9%
- By 2075
- 438,841 · +76.8%
- By 2100
- 487,736 · +96.5%
Race, ethnicity, and origin ACS 2023
- Neighborhood character
- Predominantly White (87%)
- Race & ethnicity
- White 87% Hispanic / Latino 5% Two or more races 3% Black 2% Asian 1%
- Hispanic origin (detail)
- Mexican 2%
- Common ancestry
- Slovak 3% Lithuanian 3% Italian 1%
- Foreign-born
- 8% · Canada, Jamaica
- Languages at home
- 91% English-only · Spanish 5% Other Indo-European 1% Other Asian/Pacific 1%
Political lean MEDSL · Baldwin
- 2024 margin
- Solid R (+58.2) · D 20.5% · R 78.7%
- 2008→2024 swing
- -6.7pp toward R · 2008: -51.5pp · 2024: -58.2pp
- All cycles
- 2024: R+58.2 2020: R+53.8 2016: R+57.8 2012: R+55.8 2008: R+51.5
Not yet ingested
- Civics
- —
Market trends
- HPI YoY
- ▼ -153.95%
- Current HPI
- 257.6494
- Rent YoY
- ▲ 3.71%
- Metro
- Daphne-Fairhope-Foley, AL
- State GDP YoY
- ▲ 2.94%
- F500 in state
- 4
Industry mix (Fortune 500 HQ in AL)
| Industry | F500 HQs | Revenue |
|---|---|---|
| Financial Services | 1 | $8B |
|
||
| Healthcare | 1 | $5B |
|
||
Price history
-5.8% since first listed2 events — show timeline
- 2026-05-04 Price Changed $179,000 BCAR
- 2026-04-20 Listed $190,000 BCAR
Cash-flow waterfall
monthlySold comps — $/sqft
last 12 mo · ≤1 miLoading sold comps…