365 Mather St #198 · Hamden, CT
Flood risk 9/10 · Severe
- FEMA flood zone
- X (unshaded)
- Chance of flooding over 30 yrs
- 0.99%
- Est. flood insurance / yr
- $507 – $1,088
Fire risk 1/10 · Minimal
- Est. fire insurance / yr
- $829 – $1,539
Heat risk 6/10 · Moderate
- Hot days now (above 98°F)
- 7 days/yr
- Hot days in 30 yrs
- 17 days/yr
Wind risk 6/10 · Moderate
- Chance of severe wind over 30 yrs
- 63.0%
Air-quality risk 4/10 · Minor
- Unhealthy air days now
- 4 days/yr
- Unhealthy air days in 30 yrs
- 6 days/yr
Risk factors via First Street. Map © Google.
Why this score? — see what drove the D grade
The composite is a weighted blend of 9 inputs, each scored 0–100. Each bar is that input's sub-score; the figure is the points it added to the 100-point composite (weight × sub-score).
- Cash flow +12.0/30.0
- ARV discount +7.5/15.0
- 1% rule +6.3/10.0
- Rent growth +3.7/5.0
- DSCR +3.6/10.0
- Schools +3.3/10.0
- Livability +2.5/5.0
- Condition / age +2.5/5.0
- Appreciation +0.0/10.0
$179,500
🖨 Deal sheet 📄 Offer letter ✓ Due diligence
Listing remarks
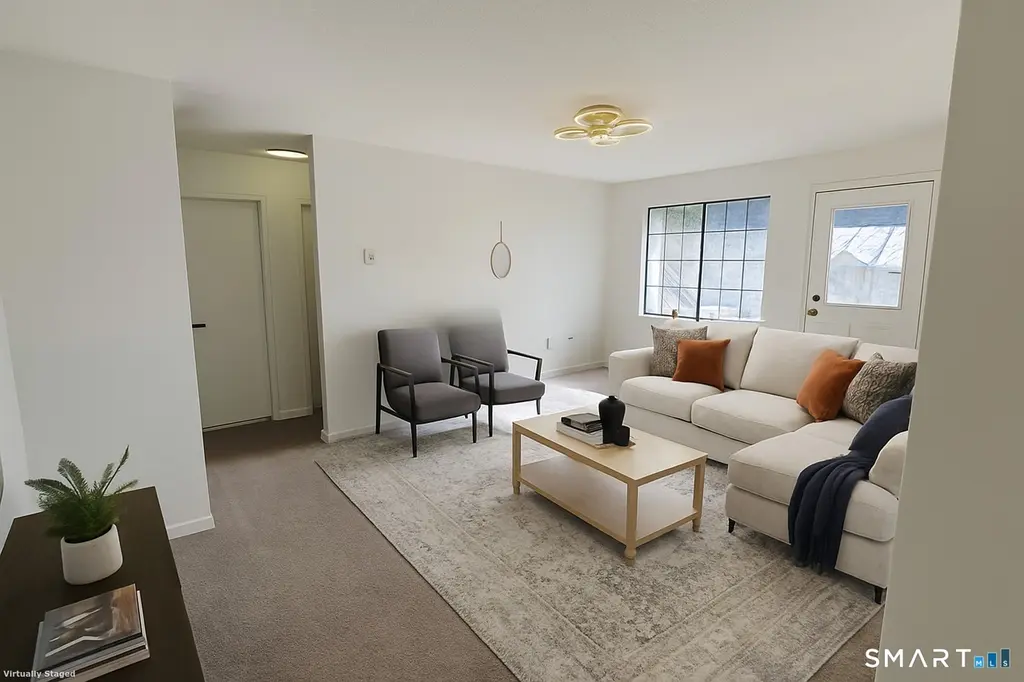
Move fast-this beautifully updated second-floor end-unit condo in the sought-after Lake Whitney Glen community is priced to sell and won't last. Offering the perfect blend of affordability, convenience, and low-maintenance living, this move-in-ready one-bedroom home features fresh paint, an updated bathroom, new lighting, abundant natural light, and in-unit laundry. Enjoy your own private balcony overlooking the community-perfect for morning coffee or unwinding after a long day. The desirable end-unit location provides added privacy and extra sunlight throughout the home. Located just steps from the Farmington Canal Trail and minutes from Quinnipiac University, Yale University, shopping, re
Key facts
- Private balcony
- In-unit laundry
- Updated bathroom
Tags
Neighborhood map
What this means for you Summary
Snapshot
- This is a 1-bed/1.0-bath condo listed at $180k.
Deal economics
- At list price, monthly cash flow is $-108 ($-1k/yr) — negative.
- To cash-flow at today's rent, offer at most $160k (10.6% below list).
- Meets the 1% rule at list price ($2k rent vs $180k).
- Recommended offer: $160k (10.6% below list) — sets the bar for cash-flow.
Location & tenants
- Location reads: area grade D — affects rentability + tenant quality, not the cash-flow math above.
- Hamden School District (suburban): math 30% / reading 43% proficiency, ranked #106 of 153 in CT (top 69%) — families likely to look elsewhere, expect single-tenant / working-renter base with shorter leases.
- Market conditions: Rents rising fast (+4.6%/yr); 107 active listings in the ZIP; 32 comparable units currently listed for rent nearby; rentals leasing fast (median 3d on market — plan ~1-2 weeks tenant-placement turnaround); solid renter incomes; 1,059 units permitted in South Central Connecticut Planning Region in 2024 (779 in 5+ unit buildings).
Forward outlook
- Local home prices are declining (-3.0%/yr); year-one equity from $1k of loan paydown is wiped out by about $5k of value loss. Plan a longer hold.
Negotiation context
- Only 9 days on market — expect competitive offers; lowballing is unlikely to land.
- 4 sale attempts since 17y ago; this cycle's ask has dropped $10k (5%) from the opening price — seller is motivated, your offer sets the floor, not the list.
Risks & watch-outs
- Watch-outs: flood insurance adds $66/mo.
- Climate carrying-cost: severe flood risk; major wind risk, 63% chance of damaging wind over 30y; extreme-heat days projected 7→17/yr by 2055 (HVAC capex compounding) — expect insurance premiums to compound above CPI over the hold.
Questions for the listing agent
- What do current leases actually rent for vs. the listed asking? Can we see a recent rent roll and the last 12 months of T-12 income?
- What's the actual annual flood-insurance premium (NFIP or private), and is the property in a SFHA with mandatory coverage?
- What does the HOA fee cover, when was the last increase, and are there any pending special assessments or reserve-fund shortfalls?
- Any open or pending special assessments — roof, HVAC, plumbing, elevator, façade? What's the per-unit balance and payoff schedule, and is the seller paying it off at close or rolling it to the buyer?
- Is there a deadline driving the sale (1031 exchange, divorce, estate, relocation)? That informs how much negotiation room exists.
- The area grade is low — what's the realistic commute time and amenity access for the typical tenant pool here? Any planned neighborhood developments (good or bad) we should know about?
- What's the average days-on-market for RENTAL listings here right now (not sales)? A rising rental-DOM trend means longer vacancies and softer asking-rent achievability than the comps imply.
- What's the recent tenant-quality profile in this submarket — average credit score on applications, eviction rate, late-payment / NSF rate, and stable-employment percentage? A property-management company in the area should have these aggregated.
- How much new apartment / multifamily construction is in the pipeline within 1–3 miles? Heavy new supply (>2% of stock underway) typically softens rents 12–24 months out; light construction supports rent growth.
Investment metrics
- 1% rule
- 1.13% ✓
- Cap rate
- 6.02%
- Cash-on-cash
- -0.99%
- DSCR
- 0.96
- GRM
- 7.4
CMA / ARV
- ARV (median comp)
- $179,645
- List price
- $179,500
- Delta
- 1.87%
- Verdict
- FAIR
- Comps
- 20 within 1.0 mi
Projected returns pro-forma
-3.0% appreciation · 4.61% rent growth · sell at horizon
- IRR
- -17.9%
- Equity multiple
- 0.36×
- Total profit
- $-32,308
- Equity at exit
- $26,764
- IRR
- -6.0%
- Equity multiple
- 0.57×
- Total profit
- $-21,578
- Equity at exit
- $15,520
Cash invested: $50,260 (down + closing). Projections, not guarantees.
Landlord ↔ Tenant lean methodology
- Overall (STATE)
- 27 Tenant-Leaning
- State Connecticut
- 27 Tenant-Leaning · D+7
- County
- — inherits STATE
- City
- — inherits STATE
ZIP-level market 06514
- Rents YoY
- 4.6%
- Active inventory
- 107
- Price-to-rent
- 7.4×
Monthly cashflow live
- Estimated rent
- $2,022 high interval (Pro) →
- Mortgage (P&I)
- −$941
- Tax from tax record
- −$267 /mo · $3,209/yr
- Insurance
- −$75
- Flood insurance flood zone
- −$66 /mo · $798/yr
- HOA
- −$355
- Vacancy / Maint / Mgmt
- −$425
- Net cashflow
- $-108
Break-even live
UW: 25.0% down · 7.5% · 30yr · 1.5% tax · 5.0% vac · 8.0% maint · 8.0% mgmt
Financing live
Cash to close
- Down payment
- $44,875
- Closing costs
- $5,385
- Reserves months
- —
- Total cash needed
- —
Loan-product check · same deal, 3 products live
Conventional
25% down · 7.5% · 30yr
- Down + closing
- —
- Monthly P&I
- —
- Monthly cashflow
- —
- DSCR
- —
- Eligible?
- —
Personal DTI + credit; lowest rate.
DSCR
20% down · 8.5% · 30yr
- Down + closing
- —
- Monthly P&I
- —
- Monthly cashflow
- —
- DSCR
- —
- Eligible?
- —
No personal income docs; deal must DSCR.
Hard money
10% down · 12.0% · 12mo
- Down + closing
- —
- Monthly P&I
- —
- Monthly cashflow
- —
- DSCR
- —
- Eligible?
- —
Short-term bridge; refi at stabilization.
Rent comps 32 comps
| Address | Beds | Baths | Sqft | Rent | $/sqft | DOM | Units | Dist |
|---|---|---|---|---|---|---|---|---|
| 365 Mather St #43 Hamden, CT | 2.0 | 2.0 | 1100 | $2,250 | $2.05 | 3d | 1 | 0.03mi |
| 380 Mather St Hamden, CT | 2.0 | 1.0–2.0 | 867 | $2,635 | $3.04 | 44d | 16 | 0.09mi |
| 414 Mather St Unit 2D Hamden, CT | 1.0 | 1.0 | 830 | $2,000 | $2.41 | 3d | 1 | 0.11mi |
| 414 Mather St Unit 2D Hamden, CT | 1.0 | 1.0 | 830 | $2,000 | $2.41 | 11d | 1 | 0.11mi |
| 1901 Dixwell Ave Hamden, CT | 2.0 | 1.0 | 660 | $1,550 | $2.35 | 3d | 1 | 0.32mi |
| 5 Manila Ave Apt 6 Hamden, CT | 1.0 | 1.0 | 620 | $1,600 | $2.58 | 44d | 1 | 0.60mi |
| 98 Kaye Vue Dr Hamden, CT | 2.0 | 1.0 | 930 | $1,995 | $2.15 | 21d | 1 | 0.61mi |
| 1572 Whitney Ave Hamden, CT | 1.0 | 1.0 | 725 | $2,000 | $2.76 | 23d | 1 | 0.64mi |
| 97 Beacon St Unit 3rd fl Hamden, CT | 2.0 | 1.0 | 1100 | $1,850 | $1.68 | 3d | 1 | 0.76mi |
| 1 Kaye Plz Hamden, CT | 1.0 | 1.0 | 660 | $1,750 | $2.65 | 3d | 1 | 0.76mi |
| 676 Mix Ave Hamden, CT | 2.0 | 1.0–2.0 | 810 | $1,838 | $2.27 | 3d | 1 | 0.86mi |
| 720 Mix Ave #303 Hamden, CT | 2.0 | 2.0 | 956 | $2,200 | $2.30 | 3d | 1 | 0.96mi |
| 11 Gorham Ave Hamden, CT | 2.0 | 1.0 | 900 | $1,700 | $1.89 | 3d | 1 | 0.98mi |
| 835 E Mix Ave Unit 6413 Hamden, CT | 1.0 | 1.0 | 850 | $1,900 | $2.24 | 44d | 1 | 1.10mi |
| 1204 Whitney Ave #208 Hamden, CT | 1.0 | 1.0 | 637 | $1,775 | $2.79 | 3d | 1 | 1.11mi |
| 1204 Whitney Ave Hamden, CT | 1.0 | 1.0 | 641 | $1,900 | $2.96 | 44d | 2 | 1.11mi |
| 1199 Whitney Ave Hamden, CT | 1.0 | 1.0 | 586 | $1,945 | $3.32 | 3d | 5 | 1.13mi |
| 1166 Dixwell Ave Unit 6 Hamden, CT | 2.0 | 1.0 | 900 | $1,450 | $1.61 | 3d | 1 | 1.15mi |
| 865 Mix Ave Hamden, CT | 1.0–2.0 | 1.0–2.0 | 1028 | $1,975 | $1.92 | 3d | 5 | 1.15mi |
| 1164 Whitney Ave Unit H Hamden, CT | 2.0 | 1.0 | 850 | $2,100 | $2.47 | 3d | 1 | 1.19mi |
| 1160 Whitney Ave Hamden, CT | 2.0 | 1.0 | 900 | $2,200 | $2.44 | 3d | 1 | 1.20mi |
| 1160 Whitney Ave Unit E Hamden, CT | 2.0 | 1.0 | 850 | $2,200 | $2.59 | 19d | 1 | 1.20mi |
| 1160 Whitney Ave Unit E Hamden, CT | 2.0 | 1.0 | 900 | $2,250 | $2.50 | 44d | 1 | 1.20mi |
| 1160 Whitney Ave Apt A Hamden, CT | 2.0 | 1.0 | 900 | $2,100 | $2.33 | 3d | 1 | 1.20mi |
| 663 Newhall St Unit 10 Hamden, CT | 2.0 | 1.5 | 860 | $1,900 | $2.21 | 3d | 1 | 1.21mi |
| 905 Mix Ave Hamden, CT | 1.0 | 1.0 | 836 | $1,850 | $2.21 | 44d | 4 | 1.22mi |
| 165 Towne House Rd Unit 165 Hamden, CT | 1.0 | 1.0 | 631 | $1,650 | $2.61 | 44d | 1 | 1.25mi |
| 925 Mix Ave Hamden, CT | 2.0 | 1.0–1.5 | 830 | $2,460 | $2.96 | 3d | 3 | 1.28mi |
| 2 Skiff St Hamden, CT | 1.0–2.0 | 1.0 | 928 | $1,905 | $2.05 | 3d | 3 | 1.29mi |
| 1047 Whitney Ave Hamden, CT | 2.0 | 1.0 | 1000 | $2,000 | $2.00 | 14d | 1 | 1.39mi |
| 1047 Whitney Ave Unit East Hamden, CT | 2.0 | 1.0 | 1000 | $2,000 | $2.00 | 3d | 1 | 1.39mi |
| 43 Whiting St Unit 1 Hamden, CT | 2.0 | 1.0 | 850 | $1,800 | $2.12 | 3d | 1 | 1.42mi |
HOA detail condo
- Monthly dues
- $355 · $4,260/yr
- Assessments
- None detected in remarks — confirm with the listing agent.
Listing history 17 events
-
2026-06-18days on market $179,500 Active 9 DOM
-
2026-06-17days on market $179,500 Active 8 DOM
-
2026-06-16days on market $179,500 Active 7 DOM
-
2026-06-15days on market $179,500 Active 6 DOM
-
2026-06-14days on market $179,500 Active 4 DOM
-
2026-06-13days on market $179,500 Active 3 DOM
-
2026-06-10pricestatusdays on market $179,500 Active 1 DOM
-
2026-05-19historical
-
2026-04-27price $183,000
-
2026-02-25status Active
-
2026-02-14historical Under Contract - Continue to Show
-
2026-02-02price $186,000
-
2025-12-14$189,000 Active
-
2014-01-01historical
-
2013-01-01$86,900
-
2010-11-10historical
-
2009-11-09$127,500
ⓘ Source: listings_history table (triggers on properties + properties_extension) + one-shot
backfill from property_details.listing_events for pre-trigger history.
Tax reassessment forecast CT · Partial reset (capped growth)
- Current annual tax
- $3,209 · $267/mo
- Projected year-2 tax
- $3,525 · $294/mo
- Expected delta
- +$316/yr (+$26/mo · 9.9%)
ⓘ Screening estimate from a state-policy table — verify with the county assessor before closing.
Climate risk First Street
- Flood 9/10 Extreme FEMA zone X (unshaded) · 99% chance over 30 yrs
- Wildfire 1/10 Low
- Heat 6/10 Major 7 d/yr ≥98°F today · 17 d/yr by 30 yrs out
- Wind 6/10 Major 63% chance of damaging wind over 30 yrs
- Air quality 4/10 Moderate 4 unhealthy d/yr today · 6 by 30 yrs out
Nearby sold comps map
Loading sold comps map…
Walkable amenities ~0.75 mi
Loading nearby amenities…
Taxation est. · year 1
- Rental income
- $24,261
- − Mortgage interest
- −$10,055
- − Property taxes
- −$3,209
- − Insurance
- −$1,695
- − Repairs & maintenance
- −$1,941
- − Management
- −$1,941
- − HOA
- −$4,260
- − Depreciation
- −$5,222
- Taxable loss
- −$4,061
- Est. tax savings @ 24.0%
- +$975
- After-tax cash flow
- $-319/yr
For passive investors: Depreciation is non-cash, so a rental often shows a tax loss while cash-flowing — sheltering income. Rental losses are passive: they offset passive income freely, and up to $25,000/yr can offset ordinary (W-2) income if you actively participate and your MAGI is under $100k (phasing out to $0 by $150k); unused losses carry forward. On sale, claimed depreciation is recaptured at up to 25%, and gains may owe capital-gains tax (a 1031 exchange can defer both). Figures are a year-1 estimate at your 24.0% rate — not tax advice; consult a CPA.
Schools (NCES district)
- District
- Hamden School District
- NCES district ID
- 0901860
- Math proficiency
- 30% ▼ -13.00%
- Reading proficiency
- 43% ▼ -7.00%
- Median HH income
- $68,821
- Composite
- 33.34/100
- National rank
- #5490
- State rank
- #106 of 153 in CT
Livability — Hamden
No livability data for this city. (Only ~50 U.S. cities are tracked.)
Census & demographics
- County
- New Haven County · 688,236 people
- City population
- 61,150
- Metro
- New Haven-Milford, CT
- Population (ZIP)
- 26,803
- Household income
- $88,900
- Rent vs Own
- Severe rent burden
- 1228.0
Population outlook (South Central Connecticut County) Hauer SSP2
- By 2040
- 608,362
Race, ethnicity, and origin ACS 2023
- Neighborhood character
- Diverse neighborhood (Simpson 0.68)
- Race & ethnicity
- White 43% Black 33% Hispanic / Latino 16% Two or more races 10% Asian 3%
- Hispanic origin (detail)
- Mexican 2% Puerto Rican 7% Dominican 2%
- Common ancestry
- Romanian 5% German 2% Lithuanian 2%
- Foreign-born
- 15% · Canada, Jamaica, China
- Languages at home
- 80% English-only · Spanish 10% Arabic 2% Other Indo-European 1%
Political lean MEDSL · South Central Connecticut
- 2024 margin
- Strong D (+20.1) · D 59.0% · R 38.9% · Other 2.1%
- All cycles
- 2024: D+20.1
Not yet ingested
- Civics
- —
Market trends
- HPI YoY
- ▼ -222.59%
- Current HPI
- 251.556
- Rent YoY
- ▲ 4.61%
- Metro
- New Haven-Milford, CT
- State GDP YoY
- ▲ 1.06%
- F500 in state
- 38
Industry mix (Fortune 500 HQ in CT)
| Industry | F500 HQs | Revenue |
|---|---|---|
| Industrial Machinery | 4 | $38B |
|
||
| Insurance | 3 | $71B |
|
||
| Financial Services | 2 | $25B |
|
||
| Transportation / Logistics | 2 | $18B |
|
||
| Healthcare | 1 | $247B |
|
||
| Telecommunications | 1 | $55B |
|
||
Price history
+43.5% since first listed10 events — show timeline
- 2026-05-19 Listing Removed — Smart MLS
- 2026-04-27 Price Changed $183,000 Smart MLS
- 2026-02-25 Relisted — Smart MLS
- 2026-02-14 Contingent — Smart MLS
- 2026-02-02 Price Changed $186,000 Smart MLS
- 2025-12-14 Listed $189,000 Smart MLS
- 2014-01-01 Listing Removed — Smart MLS
- 2013-01-01 Listed $86,900 Smart MLS
- 2010-11-10 Listing Removed — Smart MLS
- 2009-11-09 Listed $127,500 Smart MLS
Property tax history
-0.0%/yrLatest (2023): $3,209 · +1.6% YoY. Source: county tax records.
Cash-flow waterfall
monthlySold comps — $/sqft
last 12 mo · ≤1 miLoading sold comps…