 🌊 Lakefront
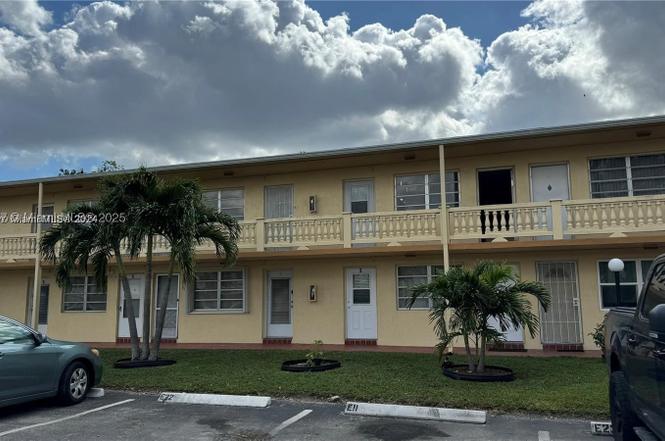
160 NE 203rd Ter #18 · Miami Gardens, FL
Flood risk 4/10 · Minor
- FEMA flood zone
- AE
- Chance of flooding over 30 yrs
- 0.22%
- Est. flood insurance / yr
- $1,737 – $8,500
Fire risk 1/10 · Minimal
- Est. fire insurance / yr
- $947 – $1,759
Heat risk 10/10 · Severe
- Hot days now (above 105°F)
- 4 days/yr
- Hot days in 30 yrs
- 14 days/yr
Wind risk 10/10 · Severe
- Chance of severe wind over 30 yrs
- 99.0%
Air-quality risk 2/10 · Minimal
- Unhealthy air days now
- 2 days/yr
- Unhealthy air days in 30 yrs
- 2 days/yr
Risk factors via First Street. Map © Google.
Why this score? — see what drove the C+ grade
The composite is a weighted blend of 9 inputs, each scored 0–100. Each bar is that input's sub-score; the figure is the points it added to the 100-point composite (weight × sub-score).
- Cash flow +24.8/30.0
- 1% rule +9.4/10.0
- DSCR +8.0/10.0
- ARV discount +7.5/15.0
- Schools +4.2/10.0
- Livability +3.6/5.0
- Rent growth +2.6/5.0
- Condition / age +2.5/5.0
- Appreciation +0.0/10.0
$150,000
🖨 Deal sheet 📄 Offer letter ✓ Due diligence
Listing remarks
LARGE CORNER UNIT 2/2 APARTMENT FOR SALE, OWNER OCCUPIED. DO NOT DISTURB OWNER, THIS UNIT HOPA VERIFIED. THIS CONDOMINIUM HAS "NO RESERVES"
Key facts
- $355 HOA
- Garage
- Community pool
Property features AI
Finance
- Other: Association-managed pool
- Financial info: Pets allowed with restrictions
- HOA & community: Monthly association fee; Association amenities include clubhouse, community kitchen, fitness center, hobby room, laundry, and pool; Association fee covers amenities, structure maintenance, and pool(s)
Exterior
- Parking: Detached garage with 1 assigned covered space
- Utilities: Cable available
- Home design: Attached property; 2 stories; Entry on level 2; Faces north; Has a view
- Construction: Block construction; Effective year built
- Exterior features: Balcony; Open balcony/porch
Interior
- Kitchen: Gas range; Refrigerator; Some gas appliances
- Flooring: Ceramic tile
- Bathrooms: 2 full bathrooms
- Heating & cooling: Central heating; Central air conditioning
- Interior features: Second-floor entry; Combined living and dining area; Unfurnished
- Laundry & utility: Common area laundry
Neighborhood map
What this means for you Summary
Snapshot
- This is a 2-bed/2.0-bath condo listed at $150k.
Deal economics
- At list price, monthly cash flow is $-111 ($-1k/yr) — negative.
- To cash-flow at today's rent, offer at most $134k (10.7% below list).
- Meets the 1% rule at list price ($2k rent vs $150k).
- Recommended offer: $132k (12.0% below list) — sets the bar for market timing.
- Cap rate 8.8% vs local median 3.1% in Miami Gardens — top-decile yield for the area; either an underpriced asset or a hidden risk that comps aren't pricing in. Stress-test before assuming the spread holds.
Location & tenants
- Location reads 72/100 on livability (#338 in FL) — a middle-class / working-renter tenant base. Strengths: commute A+, housing A+, health & safety A+; Watch: employment D+, crime D-, amenities F.
- Miami-Dade (suburban): math 45% / reading 54% proficiency, ranked #40 of 73 in FL (top 55%) — families likely to look elsewhere, expect single-tenant / working-renter base with shorter leases; 64% free/reduced lunch — lower-income household profile, screen leases tightly.
- Market conditions: Rents flat; 572 active listings in the ZIP; 27 comparable units currently listed for rent nearby; rentals at typical pace (median 20d on market — plan ~3-4 weeks tenant-placement turnaround); 10,051 units permitted in Miami-Dade County in 2024 (7,758 in 5+ unit buildings).
- This rent runs 40% of the median local income ($65k/yr) — at the standard rent-burdened threshold; future hikes will face affordability resistance.
Forward outlook
- Local home prices are declining (-3.0%/yr); year-one equity from $1k of loan paydown is wiped out by about $4k of value loss. Plan a longer hold.
- Miami-Dade County population projected at +28% by 2050 — long-run rental-demand tailwind backs the buy-and-hold thesis.
Negotiation context
- It's been on market 515 days — a 12% lower offer ($132k) is reasonable based on typical stale-listing flexibility.
- 9 sale attempts since 2y ago with the ask held roughly flat each time — persistent listings suggest the price (not the market) is what's stuck; bring a comps-based counter.
- Current owner paid $41k; list at $150k implies a 267% gain — meaningful room to come down on a strong offer.
Risks & watch-outs
- Watch-outs: flood insurance adds $427/mo.
- Climate carrying-cost: in FEMA flood zone AE (mandatory federal flood insurance); severe wind risk, 99% chance of damaging wind over 30y; extreme-heat days projected 4→14/yr by 2055 (HVAC capex compounding) — expect insurance premiums to compound above CPI over the hold.
Questions for the listing agent
- What do current leases actually rent for vs. the listed asking? Can we see a recent rent roll and the last 12 months of T-12 income?
- It's been on market 515 days. Have you received any prior offers? Is the seller open to a 12% concession, seller financing, or rate buy-down credit?
- Built in 1970 — when were the roof, HVAC, electrical panel, plumbing, and water heater last replaced?
- What's the actual annual flood-insurance premium (NFIP or private), and is the property in a SFHA with mandatory coverage?
- What does the HOA fee cover, when was the last increase, and are there any pending special assessments or reserve-fund shortfalls?
- Any open or pending special assessments — roof, HVAC, plumbing, elevator, façade? What's the per-unit balance and payoff schedule, and is the seller paying it off at close or rolling it to the buyer?
- Why hasn't it sold? Are there any deal-killer items the seller is aware of (foundation, flood, title, zoning, code violations)?
- Is there a deadline driving the sale (1031 exchange, divorce, estate, relocation)? That informs how much negotiation room exists.
- Crime grade is D in this area — have there been break-ins, vandalism, or insurance claims at this property in the last 3 years? What carrier currently insures it and at what premium?
- This sits on a lake — are riparian / water-frontage rights deeded with the parcel? Any dock permits, shoreline easements, or HOA water-use restrictions?
- What's the documented flood / surge / shoreline-erosion history here (FEMA AND non-FEMA — e.g., storm surge, creek backup, septic-field saturation)?
- Any water-quality or seasonal algae-bloom issues that affect tenant satisfaction or short-term-rental demand?
- What's the average days-on-market for RENTAL listings here right now (not sales)? A rising rental-DOM trend means longer vacancies and softer asking-rent achievability than the comps imply.
- What's the recent tenant-quality profile in this submarket — average credit score on applications, eviction rate, late-payment / NSF rate, and stable-employment percentage? A property-management company in the area should have these aggregated.
- How much new apartment / multifamily construction is in the pipeline within 1–3 miles? Heavy new supply (>2% of stock underway) typically softens rents 12–24 months out; light construction supports rent growth.
Investment metrics
- 1% rule
- 1.44% ✓
- Cap rate
- 8.82%
- Cash-on-cash
- 9.01%
- DSCR
- 1.40
- GRM
- 5.8
CMA / ARV
No comps found within radius.
Projected returns pro-forma
-3.0% appreciation · 0.22% rent growth · sell at horizon
- IRR
- -27.1%
- Equity multiple
- 0.12×
- Total profit
- $-36,753
- Equity at exit
- $22,365
- IRR
- -59.8%
- Equity multiple
- -0.47×
- Total profit
- $-61,861
- Equity at exit
- $12,969
Cash invested: $42,000 (down + closing). Projections, not guarantees.
Landlord ↔ Tenant lean methodology
- Overall (STATE)
- 87 Strongly Landlord-Friendly
- State Florida
- 87 Strongly Landlord-Friendly · R+3
- County
- — inherits STATE
- City
- — inherits STATE
ZIP-level market 33179
- Rents YoY
- 0.2%
- Active inventory
- 572
- Price-to-rent
- 5.8×
Monthly cashflow live
- Estimated rent
- $2,161 high interval (Pro) →
- Mortgage (P&I)
- −$787
- Tax est. 1.5%
- −$188 /mo · $2,250/yr
- Insurance
- −$62
- Flood insurance flood zone
- −$427 /mo · $5,118/yr
- HOA
- −$355
- Vacancy / Maint / Mgmt
- −$454
- Net cashflow
- $-111
Break-even live
Sensitivity live
| Price | -10% $-7 | -5% $-59 | +0% $-111 | +5% $-163 | +10% $-215 |
|---|---|---|---|---|---|
| Rent | -10% $-282 | -5% $-196 | +0% $-111 | +5% $-26 | +10% $60 |
| Rate | -1.0pp $-36 | -0.5pp $-73 | base $-111 | +0.5pp $-150 | +1.0pp $-190 |
UW: 25.0% down · 7.5% · 30yr · 1.5% tax · 5.0% vac · 8.0% maint · 8.0% mgmt
Financing live
Cash to close
- Down payment
- $37,500
- Closing costs
- $4,500
- Reserves months
- —
- Total cash needed
- —
Loan-product check · same deal, 3 products live
Conventional
25% down · 7.5% · 30yr
- Down + closing
- —
- Monthly P&I
- —
- Monthly cashflow
- —
- DSCR
- —
- Eligible?
- —
Personal DTI + credit; lowest rate.
DSCR
20% down · 8.5% · 30yr
- Down + closing
- —
- Monthly P&I
- —
- Monthly cashflow
- —
- DSCR
- —
- Eligible?
- —
No personal income docs; deal must DSCR.
Hard money
10% down · 12.0% · 12mo
- Down + closing
- —
- Monthly P&I
- —
- Monthly cashflow
- —
- DSCR
- —
- Eligible?
- —
Short-term bridge; refi at stabilization.
Rent comps 27 comps
| Address | Beds | Baths | Sqft | Rent | $/sqft | DOM | Units | Dist |
|---|---|---|---|---|---|---|---|---|
| 5721 SW 41st St West Park, FL | 3.0 | 1.0 | 839 | $2,650 | $3.16 | 24d | 1 | 0.77mi |
| 5525 SW 41st St Hollywood, FL | 2.0 | 2.0 | 1031 | $2,145 | $2.08 | 3d | 1 | 0.83mi |
| 5100 SW 41st St Pembroke Park, FL | 1.0–2.0 | 1.0–2.0 | 815 | $1,799 | $2.21 | 4d | 4 | 0.89mi |
| 5100 SW 41st St Pembroke Park, FL | 1.0–2.0 | 1.0–2.0 | 815 | $1,750 | $2.15 | 20d | 3 | 0.89mi |
| 5540 SW 38th Ct West Park, FL | 2.0 | 1.0 | 768 | $2,000 | $2.60 | 11d | 1 | 0.91mi |
| 5460 SW 38th Ct West Park, FL | 2.0 | 1.0 | 890 | $2,350 | $2.64 | 24d | 1 | 0.92mi |
| 5440 SW 38th Ct West Park, FL | 2.0 | 1.0 | 768 | $1,900 | $2.47 | 8d | 1 | 0.92mi |
| 5440 SW 38th Ct West Park, FL | 2.0 | 1.0 | 768 | $1,900 | $2.47 | 24d | 1 | 0.92mi |
| 5710 SW 38th St West Park, FL | 2.0 | 1.0 | 835 | $2,400 | $2.87 | 24d | 1 | 0.92mi |
| 5510 SW 38th St West Park, FL | 2.0 | 1.0 | 855 | $2,250 | $2.63 | 2d | 1 | 0.96mi |
| 5510 SW 38th St Unit 5510 West Park, FL | 2.0 | 1.0 | 822 | $2,250 | $2.74 | 4d | 1 | 0.96mi |
| 5510 SW 38th St Unit 5510 West Park, FL | 2.0 | 1.0 | 822 | $2,250 | $2.74 | 4d | 1 | 0.96mi |
| 3721 SW 54th Ave West Park, FL | 2.0 | 1.0 | 768 | $2,100 | $2.73 | 13d | 1 | 1.02mi |
| 3700 SW 52nd Ave Hollywood, FL | 2.0 | 2.0 | 850 | $1,446 | $1.70 | 24d | 1 | 1.04mi |
| 3842 SW 48th Ave Hollywood, FL | 2.0 | 2.0 | 966 | $2,000 | $2.07 | 24d | 1 | 1.05mi |
| 3856 SW 48th Ave #3856 Pembroke Park, FL | 2.0 | 2.0 | 950 | $2,150 | $2.26 | 17d | 1 | 1.06mi |
| 3838 SW 48th Ave Unit 3838 Pembroke Park, FL | 2.0 | 2.0 | 966 | $2,200 | $2.28 | 24d | 1 | 1.06mi |
| 3828 SW 48th Ave Unit D27 Hollywood, FL | 2.0 | 2.0 | 950 | $2,300 | $2.42 | 24d | 1 | 1.08mi |
| 3874 SW 48th Ave #3874 Pembroke Park, FL | 2.0 | 2.0 | 950 | $2,150 | $2.26 | 8d | 1 | 1.08mi |
| 3826 SW 48th Ave Unit 3826 Pembroke Park, FL | 2.0 | 2.0 | 950 | $2,200 | $2.32 | 15d | 1 | 1.10mi |
| 3826 SW 48th Ave Unit 3826 Pembroke Park, FL | 2.0 | 2.0 | 950 | $2,200 | $2.32 | 5d | 1 | 1.10mi |
| 6112 SW 37th St Unit B Miramar, FL | 2.0 | 1.0 | 850 | $1,800 | $2.12 | 22d | 1 | 1.11mi |
| 5521 SW 34th St Unit 2 Pembroke Park, FL | 2.0 | 1.0 | 692 | $1,750 | $2.53 | 24d | 1 | 1.29mi |
| 6033 SW 35th St Unit 101 Miramar, FL | 2.0 | 2.0 | 1000 | $1,995 | $2.00 | 24d | 1 | 1.32mi |
| 4141 SW 32nd Dr West Park, FL | 3.0 | 1.0 | 1048 | $2,700 | $2.58 | 8d | 1 | 1.48mi |
| 4141 SW 32nd Dr West Park, FL | 3.0 | 1.0 | 1048 | $2,700 | $2.58 | 24d | 1 | 1.48mi |
| 4628 SW 32nd Dr West Park, FL | 3.0 | 1.0 | 1082 | $2,800 | $2.59 | 24d | 1 | 1.49mi |
HOA detail condo
- Monthly dues
- $355 · $4,260/yr
- Assessments
- None detected in remarks — confirm with the listing agent.
Listing history 31 events
-
2026-06-18days on market $150,000 Active 515 DOM
-
2026-06-17days on market $150,000 Active 514 DOM
-
2026-06-16days on market $150,000 Active 513 DOM
-
2026-06-15days on market $150,000 Active 512 DOM
-
2026-06-13days on market $150,000 Active 510 DOM
-
2026-06-09days on market $150,000 Active 506 DOM
-
2026-06-08days on market $150,000 Active 505 DOM
-
2026-06-08days on market $150,000 Active 504 DOM
-
2026-06-04days on market $150,000 Active 501 DOM
-
2026-06-03days on market $150,000 Active 500 DOM
-
2026-06-02days on market $150,000 Active 499 DOM
-
2026-06-01days on market $150,000 Active 498 DOM
-
2026-05-31days on market $150,000 Active 497 DOM
-
2026-04-01status Active
-
2026-03-31historical
-
2025-04-01status Active
-
2025-02-10historical Active Under Contract
-
2025-01-17$150,000 Active
-
2025-01-04historical $2,200
-
2024-12-20price $2,200
-
2024-12-17status Active
-
2024-12-16historical
-
2024-11-11$2,400
-
2024-11-08status Pending
-
2024-06-21$150,000 Active
-
2024-06-15historical
-
2024-05-13status Active
-
2024-04-10status Active
-
2024-03-11historical Active Under Contract
-
2024-02-13$150,000 Active
-
2000-08-04soldstatus $40,833
ⓘ Source: listings_history table (triggers on properties + properties_extension) + one-shot
backfill from property_details.listing_events for pre-trigger history.
Climate risk First Street
- Flood 4/10 Moderate FEMA zone AE · 22% chance over 30 yrs
- Wildfire 1/10 Low
- Heat 10/10 Extreme 4 d/yr ≥105°F today · 14 d/yr by 30 yrs out
- Wind 10/10 Extreme 99% chance of damaging wind over 30 yrs
- Air quality 2/10 Low 2 unhealthy d/yr today · 2 by 30 yrs out
Nearby sold comps map
Loading sold comps map…
Walkable amenities ~0.75 mi
Loading nearby amenities…
Taxation est. · year 1
- Rental income
- $25,929
- − Mortgage interest
- −$8,402
- − Property taxes
- −$2,250
- − Insurance
- −$5,868
- − Repairs & maintenance
- −$2,074
- − Management
- −$2,074
- − HOA
- −$4,260
- − Depreciation
- −$4,364
- Taxable loss
- −$3,364
- Est. tax savings @ 24.0%
- +$807
- After-tax cash flow
- $-526/yr
For passive investors: Depreciation is non-cash, so a rental often shows a tax loss while cash-flowing — sheltering income. Rental losses are passive: they offset passive income freely, and up to $25,000/yr can offset ordinary (W-2) income if you actively participate and your MAGI is under $100k (phasing out to $0 by $150k); unused losses carry forward. On sale, claimed depreciation is recaptured at up to 25%, and gains may owe capital-gains tax (a 1031 exchange can defer both). Figures are a year-1 estimate at your 24.0% rate — not tax advice; consult a CPA.
Schools (NCES district)
- District
- Miami-Dade
- NCES district ID
- 1200390
- Math proficiency
- 45% ▼ -16.00%
- Reading proficiency
- 54% ▼ -5.00%
- Median HH income
- $43,928
- Composite
- 41.76/100
- National rank
- #3397
- State rank
- #40 of 73 in FL
Livability — Miami Gardens
- Score
- 72/100
- State rank
- #338
- US rank
- #5854
Category grades
Schools grade is shown separately in the Schools card above.
Census & demographics
- Census place
- Miami Gardens, FL
- County
- Miami-Dade County · 2,697,751 people
- City population
- 81,592
- Metro
- Miami-Fort Lauderdale-Pompano Beach, FL
- Population (ZIP)
- 51,591
- Household income
- $65,211
- Rent vs Own
- Severe rent burden
- 3123.0
Population outlook (Miami-Dade County) Hauer SSP2
- Today (2025)
- 3,126,439 people
- By 2030
- 3,325,765 · +6.4%
- By 2040
- 3,697,561 · +18.3%
- By 2050
- 4,012,134 · +28.3%
- By 2075
- 4,605,612 · +47.3%
- By 2100
- 4,866,598 · +55.7%
Race, ethnicity, and origin ACS 2023
- Neighborhood character
- Diverse neighborhood (Simpson 0.67)
- Race & ethnicity
- Black 39% Hispanic / Latino 38% Two or more races 23% White 19% Asian 1%
- Hispanic origin (detail)
- Mexican 1% Puerto Rican 2% Cuban 6% Dominican 3% Salvadoran 3%
- Common ancestry
- Hispanic 13% Scotch-Irish 2% Romanian 2%
- Foreign-born
- 48% · Canada, Jamaica, Dominican Republic
- Languages at home
- 42% English-only · Spanish 37% French/Haitian/Cajun 13% Other Indo-European 2%
Political lean MEDSL · Miami-Dade
- 2024 margin
- R (+11.4) · D 43.9% · R 55.4%
- 2008→2024 swing
- -27.6pp toward R · 2008: 16.1pp · 2024: -11.4pp
- All cycles
- 2024: R+11.4 2020: D+7.3 2016: D+29.6 2012: D+23.7 2008: D+16.1
Not yet ingested
- Civics
- —
Market trends
- HPI YoY
- ▼ -608.34%
- Current HPI
- 328.1733
- Rent YoY
- ▲ 0.22%
- Metro
- Miami-Fort Lauderdale-Pompano Beach, FL
- State GDP YoY
- ▲ 3.28%
- F500 in state
- 36
Industry mix (Fortune 500 HQ in FL)
| Industry | F500 HQs | Revenue |
|---|---|---|
| Industrial Technology | 2 | $29B |
|
||
| Insurance | 2 | $17B |
|
||
| Retail | 1 | $60B |
|
||
| Technology Distribution | 1 | $58B |
|
||
| Homebuilding | 1 | $35B |
|
||
| Technology Manufacturing | 1 | $35B |
|
||
Price history
+267.3% since first listed18 events — show timeline
- 2026-04-01 Relisted — MARMLS
- 2026-03-31 Listing Removed — MARMLS
- 2025-04-01 Relisted — MARMLS
- 2025-02-10 Contingent — MARMLS
- 2025-01-17 Listed $150,000 MARMLS
- 2025-01-04 Rental Removed $2,200 MARMLS
- 2024-12-20 Price Changed $2,200 MARMLS
- 2024-12-17 Relisted — MARMLS
- 2024-12-16 Listing Removed — MARMLS
- 2024-11-11 Listed for Rent $2,400 MARMLS
- 2024-11-08 Pending — MARMLS
- 2024-06-21 Listed $150,000 MARMLS
- 2024-06-15 Listing Removed — MARMLS
- 2024-05-13 Relisted — MARMLS
- 2024-04-10 Relisted — MARMLS
- 2024-03-11 Contingent — MARMLS
- 2024-02-13 Listed $150,000 MARMLS
- 2000-08-04 Sold (Public Records) $40,833 Public Records
Property tax history
+14.7%/yrLatest (2025): $288 · +8.3% YoY. Source: county tax records.
Cash-flow waterfall
monthlySold comps — $/sqft
last 12 mo · ≤1 miLoading sold comps…