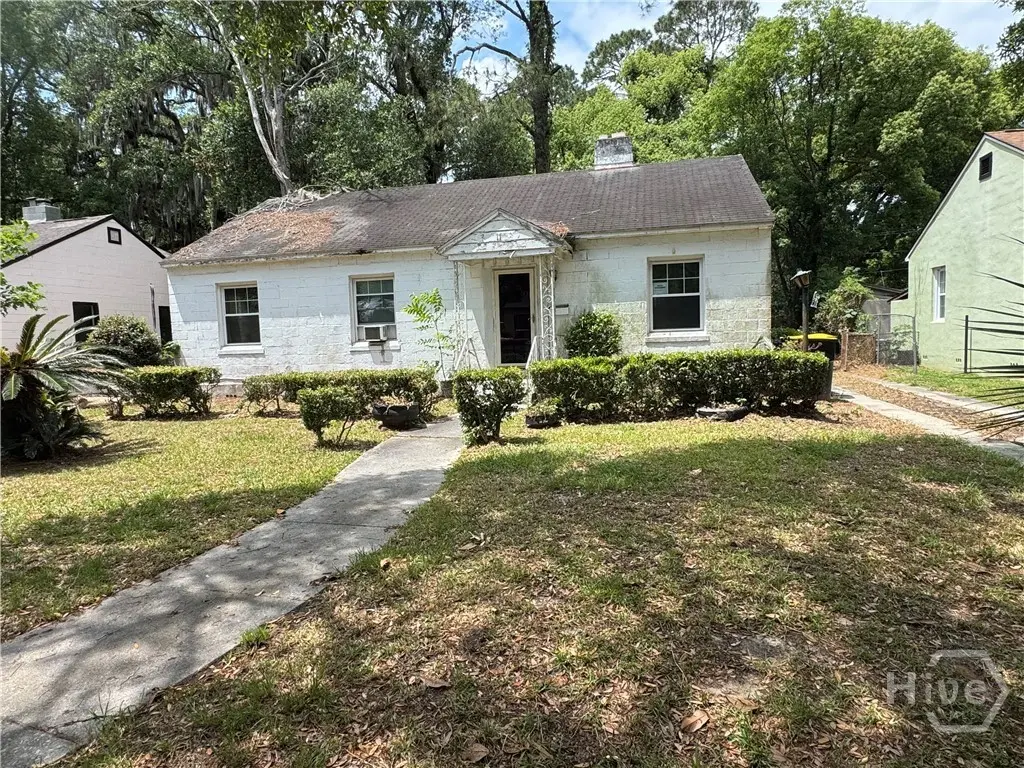
11 Oleander Ave · Savannah, GA
Flood risk 5/10 · Moderate
- FEMA flood zone
- X (unshaded)
- Chance of flooding over 30 yrs
- 0.5%
- Est. flood insurance / yr
- $507 – $1,088
Fire risk 3/10 · Minor
- Est. fire insurance / yr
- $963 – $1,789
Heat risk 9/10 · Severe
- Hot days now (above 107°F)
- 7 days/yr
- Hot days in 30 yrs
- 17 days/yr
Wind risk 9/10 · Severe
- Chance of severe wind over 30 yrs
- 99.0%
Air-quality risk 2/10 · Minimal
- Unhealthy air days now
- 2 days/yr
- Unhealthy air days in 30 yrs
- 2 days/yr
Risk factors via First Street. Map © Google.
Why this score? — see what drove the B grade
The composite is a weighted blend of 9 inputs, each scored 0–100. Each bar is that input's sub-score; the figure is the points it added to the 100-point composite (weight × sub-score).
- Cash flow +28.4/30.0
- ARV discount +15.0/15.0
- DSCR +10.0/10.0
- 1% rule +7.8/10.0
- Livability +4.3/5.0
- Rent growth +3.4/5.0
- Condition / age +2.5/5.0
- Schools +2.0/10.0
- Appreciation +0.0/10.0
$159,900
🖨 Deal sheet 📄 Offer letter ✓ Due diligence
Listing remarks MLS
AS-IS FLIPPER OPPORTUNITY IN A PRIME LOCATION Looking for your next investment? This 3-bedroom, 1-bath home is full of potential and ready for your vision. Whether you're planning a profitable flip or adding a solid rental to your portfolio, this property checks the boxes. ~ Less than a mile from Daffin Park and Blessed Sacrament School ~ Located in a fast-growing, high-demand area ~ Strong upside potential with the right updates Don't miss your chance to get into a hot neighborhood on the rise. Opportunities like this don't last long!
Key facts
- Daffin park
- Fast growing area
- 8,220 sq ft lot
Tags
Property features AI
Exterior
- Parking: Off-street parking
- Utilities: Public water; Public sewer; Underground utilities
- Home design: Single-family residence; Residential property; 1 story
- Construction: Block construction
- Exterior features: Chain-link and privacy fencing
Interior
- Bathrooms: 1 full bathroom
- Interior features: Electric water heater
- Laundry & utility: Laundry room
Neighborhood map
What this means for you Summary
Snapshot
- This is a 3-bed/1.0-bath single-family listed at $160k.
Deal economics
- At list price, monthly cash flow is $517 ($6k/yr) — positive.
- The deal already cash-flows at list — no discount required.
- Meets the 1% rule at list price ($2k rent vs $160k).
- Cap rate 10.2% vs local median 4.0% in Savannah — top-decile yield for the area; either an underpriced asset or a hidden risk that comps aren't pricing in. Stress-test before assuming the spread holds.
Location & tenants
- Location reads 86/100 on livability (#1 in GA, #397 nationally) — a professional / high-income tenant draw. Strengths: crime A+, amenities A+, commute A+; Watch: employment D, schools F.
- Savannah-Chatham County (urban): math 20% / reading 26% proficiency, ranked #134 of 174 in GA (top 77%) — low school quality limits family demand, transient renter base, plan for 1-2y turnover.
- Market conditions: Rents rising (+3.6%/yr); 226 active listings in the ZIP; 40 comparable units currently listed for rent nearby; rentals lingering (median 44d on market — plan ~5-8 weeks vacancy on turnover, expect pricing pressure); 60% of comp listings sitting > 30 days — soft ceiling on asking rent; 2,694 units permitted in Chatham County in 2024 (973 in 5+ unit buildings).
- At $2,043/mo this rent would consume 46% of the median local household income ($53k/yr) (locally 1649% of renters already pay >50% of income on rent) — very limited rent-growth headroom before tenants either downsize or default.
Forward outlook
- Local home prices are declining (-3.0%/yr); year-one equity from $1k of loan paydown is wiped out by about $5k of value loss. Plan a longer hold.
- Chatham County population projected at +33% by 2050 — long-run rental-demand tailwind backs the buy-and-hold thesis.
- At projected returns (-3.0% appreciation + 3.6% rent growth), your $45k cash investment doubles in ~8 years — after that, you're playing with house money.
Negotiation context
- Only 8 days on market — expect competitive offers; lowballing is unlikely to land.
- 2 sale attempts with the ask held roughly flat each time — persistent listings suggest the price (not the market) is what's stuck; bring a comps-based counter.
- Current owner paid $138k; 16% above their basis — modest negotiation headroom, anchor on the comps not their cost.
Risks & watch-outs
- Watch-outs: built in 1943 — expect roof / HVAC / electrical / plumbing capex.
- Climate carrying-cost: moderate flood risk; severe wind risk, 99% chance of damaging wind over 30y; extreme-heat days projected 7→17/yr by 2055 (HVAC capex compounding) — expect insurance premiums to compound above CPI over the hold.
Questions for the listing agent
- Built in 1943 — when were the roof, HVAC, electrical panel, plumbing, and water heater last replaced?
- Is there a deadline driving the sale (1031 exchange, divorce, estate, relocation)? That informs how much negotiation room exists.
- Schools are F-rated, which usually means shorter tenancies and higher turnover. Who's the typical renter profile here, and what's been the actual vacancy rate?
- What's the average days-on-market for RENTAL listings here right now (not sales)? A rising rental-DOM trend means longer vacancies and softer asking-rent achievability than the comps imply.
- What's the recent tenant-quality profile in this submarket — average credit score on applications, eviction rate, late-payment / NSF rate, and stable-employment percentage? A property-management company in the area should have these aggregated.
- How much new for-sale + rental construction is in the pipeline within 1–3 miles? Heavy new supply typically softens prices + rents 12–24 months out; constrained supply supports both.
Investment metrics
- 1% rule
- 1.28% ✓
- Cap rate
- 10.17%
- Cash-on-cash
- 13.86%
- DSCR
- 1.62
- GRM
- 6.5
CMA / ARV
- ARV (median comp)
- $247,034
- List price
- $159,900
- Delta
- -35.27%
- Verdict
- UNDERPRICED
- Comps
- 20 within 1.0 mi
Show comp detail 12 sales within ~0.75 mi
| Address | Dist | Beds/Ba | Sqft | Sold | Price | $/sf | Match |
|---|---|---|---|---|---|---|---|
| 11 Oleander Ave | 0.00mi | 3/1.0 | 1,134 (0%) | 1mo | $138,000 | $122 | 99 |
| 1403 E 40th St | 0.29mi | 3/1.0 | 1,153 (+2%) | 6mo | $280,000 | $243 | 78 |
| 1317 E 39th St | 0.37mi | 2/1.0 (-1) | 1,036 (-9%) | 2mo | $207,000 | $200 | 62 |
| 1711 E 31st St | 0.60mi | 2/1.0 (-1) | 1,185 (+4%) | 1mo | $294,000 | $248 | 59 |
| 1804 Cedar St | 0.59mi | 3/1.0 | 1,051 (-7%) | 3mo | $190,000 | $181 | 58 |
| 1304 E 52nd St E | 0.69mi | 2/1.0 (-1) | 1,088 (-4%) | 1mo | $240,000 | $221 | 55 |
| 1104 E 40th St | 0.64mi | 3/1.5 | 1,200 (+6%) | 7mo | $210,000 | $175 | 52 |
| 1523 E 54th St | 0.72mi | 3/2.0 | 1,188 (+5%) | 2mo | $305,000 | $257 | 52 |
| 1726 E 33rd St | 0.51mi | 3/2.0 | 1,262 (+11%) | 4mo | $225,000 | $178 | 50 |
| 1107 Seiler Ave | 0.65mi | 2/1.0 (-1) | 1,212 (+7%) | 5mo | $140,000 | $116 | 49 |
| 1304 NE 36th St | 0.54mi | 3/2.0 | 1,258 (+11%) | 6mo | $350,000 | $278 | 47 |
| 2046 E 42nd St | 0.60mi | 3/2.0 | 1,030 (-9%) | 7mo | $250,000 | $243 | 47 |
Match score weights: distance 35% · size 25% · config 20% · recency 20%. Top-matched comps best support the ARV.
Projected returns pro-forma
-3.0% appreciation · 3.62% rent growth · sell at horizon
- IRR
- 4.8%
- Equity multiple
- 1.19×
- Total profit
- $8,340
- Equity at exit
- $23,842
- IRR
- 14.8%
- Equity multiple
- 2.23×
- Total profit
- $55,115
- Equity at exit
- $13,825
Cash invested: $44,772 (down + closing). Projections, not guarantees.
Landlord ↔ Tenant lean methodology
- Overall (STATE)
- 90 Strongly Landlord-Friendly
- State Georgia
- 90 Strongly Landlord-Friendly · R+3
- County
- — inherits STATE
- City
- — inherits STATE
ZIP-level market 31404
- Rents YoY
- 3.6%
- Active inventory
- 226
- Price-to-rent
- 6.5×
Monthly cashflow live
- Estimated rent
- $2,043 high interval (Pro) →
- Mortgage (P&I)
- −$839
- Tax from tax record
- −$192 /mo · $2,303/yr
- Insurance
- −$67
- HOA
- −$0
- Vacancy / Maint / Mgmt
- −$429
- Net cashflow
- $517
Break-even live
UW: 25.0% down · 7.5% · 30yr · 1.5% tax · 5.0% vac · 8.0% maint · 8.0% mgmt
Financing live
Cash to close
- Down payment
- $39,975
- Closing costs
- $4,797
- Reserves months
- —
- Total cash needed
- —
Loan-product check · same deal, 3 products live
Conventional
25% down · 7.5% · 30yr
- Down + closing
- —
- Monthly P&I
- —
- Monthly cashflow
- —
- DSCR
- —
- Eligible?
- —
Personal DTI + credit; lowest rate.
DSCR
20% down · 8.5% · 30yr
- Down + closing
- —
- Monthly P&I
- —
- Monthly cashflow
- —
- DSCR
- —
- Eligible?
- —
No personal income docs; deal must DSCR.
Hard money
10% down · 12.0% · 12mo
- Down + closing
- —
- Monthly P&I
- —
- Monthly cashflow
- —
- DSCR
- —
- Eligible?
- —
Short-term bridge; refi at stabilization.
Rent comps 40 comps
| Address | Beds | Baths | Sqft | Rent | $/sqft | DOM | Units | Dist |
|---|---|---|---|---|---|---|---|---|
| 114 Oleander Ave Unit Na Savannah, GA | 3.0 | 1.0 | 1128 | $2,100 | $1.86 | 43d | 1 | 0.10mi |
| 1800 E 38th St Savannah, GA | 2.0 | 1.0 | 846 | $1,338 | $1.58 | 43d | 1 | 0.22mi |
| 1436 E 42nd St Savannah, GA | 3.0 | 2.0 | 1447 | $2,290 | $1.58 | 13d | 1 | 0.22mi |
| 1513 E 37th St Savannah, GA | 3.0 | 1.0 | 1268 | $1,775 | $1.40 | 43d | 1 | 0.27mi |
| 2840 Wicklow St Savannah, GA | 1.0–3.0 | 1.0–2.0 | 1071 | $2,869 | $2.68 | 13d | 50 | 0.28mi |
| 1326 E 38th St Savannah, GA | 2.0 | 1.0 | 800 | $1,600 | $2.00 | 13d | 1 | 0.39mi |
| 3222 Bee Rd Savannah, GA | 2.0 | 1.0 | 900 | $1,195 | $1.33 | 13d | 1 | 0.44mi |
| 1226 E Victory Dr Apt 4 Savannah, GA | 2.0 | 1.0 | 950 | $1,675 | $1.76 | 43d | 1 | 0.47mi |
| 1224 E 38th St Savannah, GA | 2.0 | 1.0 | 798 | $1,550 | $1.94 | 43d | 1 | 0.49mi |
| 1220 E Victory Dr Savannah, GA | 2.0 | 1.0 | 1000 | $1,800 | $1.80 | 43d | 1 | 0.50mi |
| 1217 E 38th St Savannah, GA | 3.0 | 1.0 | 1227 | $1,675 | $1.37 | 23d | 1 | 0.50mi |
| 1401 E 33rd St Savannah, GA | 3.0 | 1.0 | 960 | $1,650 | $1.72 | 43d | 1 | 0.52mi |
| 1331 E 48th St Savannah, GA | 3.0 | 2.0 | 1408 | $3,450 | $2.45 | 43d | 1 | 0.54mi |
| 1205 E 38th St Savannah, GA | 2.0 | 1.0 | 1000 | $1,595 | $1.59 | 43d | 1 | 0.54mi |
| 1704 E 31st St Savannah, GA | 3.0 | 2.0 | 1137 | $2,350 | $2.07 | 43d | 1 | 0.55mi |
| 1206 Seiler Ave Savannah, GA | 3.0 | 1.0 | 1183 | $2,050 | $1.73 | 43d | 1 | 0.56mi |
| 2033 E 41st St Savannah, GA | 4.0 | 2.0 | 1448 | $2,800 | $1.93 | 43d | 1 | 0.56mi |
| 1202 E 37th St Unit A Savannah, GA | 4.0 | 2.0 | 1480 | $2,295 | $1.55 | 13d | 1 | 0.59mi |
| 1502 E 31st St Savannah, GA | 3.0 | 2.0 | 1212 | $1,700 | $1.40 | 13d | 1 | 0.59mi |
| 1810 E 32nd St Savannah, GA | 3.0 | 1.5 | 1218 | $3,000 | $2.46 | 23d | 1 | 0.61mi |
| 1131 SE 36th St Unit A Savannah, GA | 2.0 | 1.0 | 1200 | $1,675 | $1.40 | 13d | 1 | 0.62mi |
| 1305 E 32nd St Savannah, GA | 2.0 | 1.0 | 832 | $2,400 | $2.88 | 13d | 1 | 0.63mi |
| 1402 E 51st St Unit 1 Savannah, GA | 2.0 | 1.0 | 988 | $2,100 | $2.13 | 23d | 1 | 0.63mi |
| 2010 Vermont Ave Savannah, GA | 2.0 | 1.0 | 892 | $1,690 | $1.89 | 43d | 1 | 0.63mi |
| 1122 E 37th St Savannah, GA | 3.0 | 2.0 | 1292 | $1,895 | $1.47 | 43d | 1 | 0.64mi |
| 1405 E 51st St Savannah, GA | 3.0 | 2.0 | 1458 | $2,850 | $1.95 | 43d | 1 | 0.64mi |
| 1107 E 38th St Savannah, GA | 3.0 | 2.0 | 1500 | $2,400 | $1.60 | 43d | 1 | 0.64mi |
| 1105 E 38th St Savannah, GA | 3.0 | 2.0 | 1500 | $2,400 | $1.60 | 43d | 1 | 0.65mi |
| 1403 E Anderson St Savannah, GA | 3.0 | 2.0 | 1300 | $2,400 | $1.85 | 44d | 1 | 0.66mi |
| 3601 Eastgate Dr Savannah, GA | 3.0 | 2.0 | 1400 | $2,500 | $1.79 | 43d | 1 | 0.67mi |
| 1118 NE 36th St Savannah, GA | 3.0 | 2.0 | 1200 | $2,000 | $1.67 | 43d | 1 | 0.68mi |
| 1315 E Anderson St Unit 1315 Savannah, GA | 2.0 | 2.0 | 859 | $1,500 | $1.75 | 43d | 1 | 0.70mi |
| 3608 Duane Ct Savannah, GA | 2.0 | 1.0 | 975 | $1,095 | $1.12 | 23d | 1 | 0.72mi |
| 3608 Duane Ct Unit C Savannah, GA | 2.0 | 1.0 | 975 | $1,095 | $1.12 | 43d | 1 | 0.72mi |
| 2201 E 37th St Savannah, GA | 3.0 | 1.5 | 1424 | $1,800 | $1.26 | 23d | 1 | 0.73mi |
| 1306 E 53rd St Savannah, GA | 2.0 | 1.0 | 850 | $1,500 | $1.76 | 23d | 1 | 0.77mi |
| 1207 E Anderson St Unit B Savannah, GA | 2.0 | 1.0 | 1000 | $1,640 | $1.64 | 23d | 1 | 0.78mi |
| 904 E 39th St Savannah, GA | 3.0 | 1.0 | 1200 | $2,300 | $1.92 | 43d | 1 | 0.79mi |
| 2002 E 51st St Unit Labs Savannah, GA | 3.0 | 1.0 | 1044 | $1,680 | $1.61 | 43d | 1 | 0.80mi |
| 1320 E 54th St Savannah, GA | 2.0 | 1.0 | 781 | $1,595 | $2.04 | 13d | 1 | 0.80mi |
Listing history 4 events
-
2026-05-07status Pending 562-char remark
-
2026-04-28$159,900 New 541-char remark
Show marketing remark (541 chars)
AS-IS FLIPPER OPPORTUNITY IN A PRIME LOCATION Looking for your next investment? This 3-bedroom, 1-bath home is full of potential and ready for your vision. Whether you're planning a profitable flip or adding a solid rental to your portfolio, this property checks the boxes. ~ Less than a mile from Daffin Park and Blessed Sacrament School ~ Located in a fast-growing, high-demand area ~ Strong upside potential with the right updates Don't miss your chance to get into a hot neighborhood on the rise. Opportunities like this don't last long!
-
2026-04-28$159,900 Active 562-char remark
Show marketing remark (541 chars)
AS-IS FLIPPER OPPORTUNITY IN A PRIME LOCATION Looking for your next investment? This 3-bedroom, 1-bath home is full of potential and ready for your vision. Whether you're planning a profitable flip or adding a solid rental to your portfolio, this property checks the boxes. ~ Less than a mile from Daffin Park and Blessed Sacrament School ~ Located in a fast-growing, high-demand area ~ Strong upside potential with the right updates Don't miss your chance to get into a hot neighborhood on the rise. Opportunities like this don't last long!
-
1978-07-01soldstatus $27,000
ⓘ Source: listings_history table (triggers on properties + properties_extension) + one-shot
backfill from property_details.listing_events for pre-trigger history.
Tax reassessment forecast GA · Resets to sale price
- Current annual tax
- $2,303 · $192/mo
- Projected year-2 tax
- $2,303 · $192/mo
- Expected delta
- $0/yr ($0/mo · 0.0%)
ⓘ Screening estimate from a state-policy table — verify with the county assessor before closing.
Climate risk First Street
- Flood 5/10 Major FEMA zone X (unshaded) · 50% chance over 30 yrs
- Wildfire 3/10 Moderate
- Heat 9/10 Extreme 7 d/yr ≥107°F today · 17 d/yr by 30 yrs out
- Wind 9/10 Extreme 99% chance of damaging wind over 30 yrs
- Air quality 2/10 Low 2 unhealthy d/yr today · 2 by 30 yrs out
Nearby sold comps map
Loading sold comps map…
Walkable amenities ~0.75 mi
Loading nearby amenities…
Taxation est. · year 1
- Rental income
- $24,521
- − Mortgage interest
- −$8,957
- − Property taxes
- −$2,303
- − Insurance
- −$800
- − Repairs & maintenance
- −$1,962
- − Management
- −$1,962
- − Depreciation
- −$4,652
- Taxable income
- $3,887
- Est. tax owed @ 24.0%
- −$933
- After-tax cash flow
- $5,274/yr
For passive investors: Depreciation is non-cash, so a rental often shows a tax loss while cash-flowing — sheltering income. Rental losses are passive: they offset passive income freely, and up to $25,000/yr can offset ordinary (W-2) income if you actively participate and your MAGI is under $100k (phasing out to $0 by $150k); unused losses carry forward. On sale, claimed depreciation is recaptured at up to 25%, and gains may owe capital-gains tax (a 1031 exchange can defer both). Figures are a year-1 estimate at your 24.0% rate — not tax advice; consult a CPA.
Schools (NCES district)
- District
- Savannah-Chatham County
- NCES district ID
- 1301020
- Math proficiency
- 20% ▼ -11.00%
- Reading proficiency
- 26% ▼ -5.00%
- Median HH income
- $47,443
- Composite
- 20.14/100
- National rank
- #8639
- State rank
- #134 of 174 in GA
Livability — Savannah
- Score
- 86/100
- State rank
- #1
- US rank
- #397
Category grades
Schools grade is shown separately in the Schools card above.
Census & demographics
- Census place
- Savannah, GA
- County
- Chatham County · 271,602 people
- City population
- 216,564
- Metro
- Savannah, GA
- Population (ZIP)
- 30,062
- Household income
- $53,303
- Rent vs Own
- Severe rent burden
- 1649.0
Population outlook (Chatham County) Hauer SSP2
- Today (2025)
- 332,584 people
- By 2030
- 355,508 · +6.9%
- By 2040
- 400,030 · +20.3%
- By 2050
- 443,019 · +33.2%
- By 2075
- 534,579 · +60.7%
- By 2100
- 583,863 · +75.6%
Race, ethnicity, and origin ACS 2023
- Neighborhood character
- Majority Black (60%)
- Race & ethnicity
- Black 60% White 33% Two or more races 4% Hispanic / Latino 3% Asian 1%
- Common ancestry
- Romanian 2% Lithuanian 1% Slovak 1%
- Foreign-born
- 4% · Canada, Vietnam
- Languages at home
- 93% English-only · Spanish 3% Other Asian/Pacific 1% French/Haitian/Cajun 1%
Political lean MEDSL · Chatham
- 2024 margin
- D (+18.0) · D 58.6% · R 40.6%
- 2008→2024 swing
- +3.6pp toward D · 2008: 14.4pp · 2024: 18.0pp
- All cycles
- 2024: D+18.0 2020: D+18.8 2016: D+14.5 2012: D+12.0 2008: D+14.4
Not yet ingested
- Civics
- —
Market trends
- HPI YoY
- ▼ -187.86%
- Current HPI
- 310.0764
- Rent YoY
- ▲ 3.62%
- Metro
- Savannah, GA
- State GDP YoY
- ▲ 2.66%
- F500 in state
- 28
Industry mix (Fortune 500 HQ in GA)
| Industry | F500 HQs | Revenue |
|---|---|---|
| Paper / Packaging | 2 | $29B |
|
||
| Retail | 1 | $160B |
|
||
| Transportation / Logistics | 1 | $91B |
|
||
| Airlines | 1 | $62B |
|
||
| Consumer Goods | 1 | $47B |
|
||
| Utilities | 1 | $25B |
|
||
Price history
+411.1% since first listed6 events — show timeline
- 2026-05-28 Sold (MLS) $138,000 GAMLS
- 2026-05-28 Sold (MLS) $138,000 Hive MLS
- 2026-05-07 Pending — Hive MLS
- 2026-04-28 Listed $159,900 GAMLS
- 2026-04-28 Listed $159,900 Hive MLS
- 1978-07-01 Sold (Public Records) $27,000 Public Records
Property tax history
+24.6%/yrLatest (2025): $2,303 · +1138.2% YoY. Source: county tax records.
Cash-flow waterfall
monthlySold comps — $/sqft
last 12 mo · ≤1 miLoading sold comps…