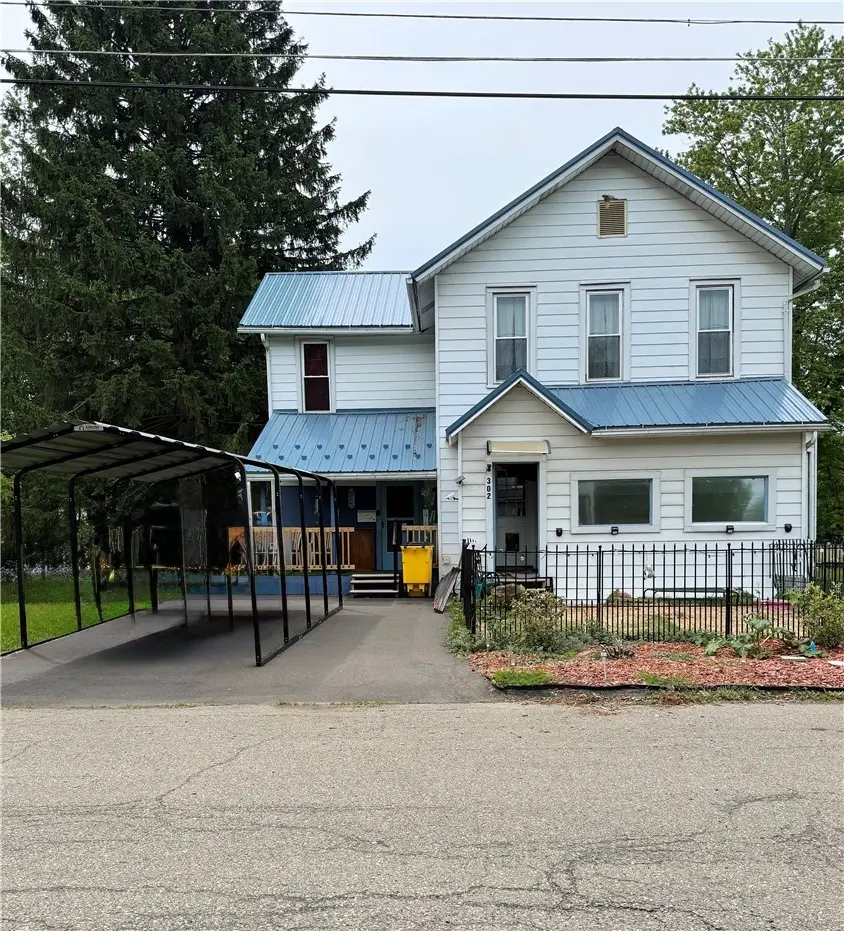
302 Diven Ave · Elmira, NY
Flood risk 4/10 · Minor
- FEMA flood zone
- X (shaded)
- Chance of flooding over 30 yrs
- 0.23%
- Est. flood insurance / yr
- $473 – $860
Fire risk 2/10 · Minimal
- Est. fire insurance / yr
- $691 – $1,283
Heat risk 3/10 · Minor
- Hot days now (above 96°F)
- 7 days/yr
- Hot days in 30 yrs
- 16 days/yr
Wind risk 2/10 · Minimal
- Chance of severe wind over 30 yrs
- 1.0%
Air-quality risk 1/10 · Minimal
- Unhealthy air days now
- 0 days/yr
- Unhealthy air days in 30 yrs
- 0 days/yr
Risk factors via First Street. Map © Google.
Why this score? — see what drove the C+ grade
The composite is a weighted blend of 9 inputs, each scored 0–100. Each bar is that input's sub-score; the figure is the points it added to the 100-point composite (weight × sub-score).
- Cash flow +20.2/30.0
- Appreciation +10.0/10.0
- ARV discount +7.5/15.0
- DSCR +6.4/10.0
- 1% rule +5.8/10.0
- Livability +3.1/5.0
- Rent growth +2.5/5.0
- Condition / age +2.5/5.0
- Schools +2.4/10.0
$129,900
🖨 Deal sheet (PDF) 📄 Offer letter ✓ Due diligence
Listing remarks
Completely gutted and remodeled in 2022, this 3-bedroom, 1.5-bath home offers a spacious kitchen/dining room combo featuring a large custom-made island perfect for entertaining! Enjoy a relaxing jacuzzi tub, high-gloss laminate flooring, newer windows, an on-demand hot water system, and an inline water filtration system. The metal roof was installed in 2023, with a new asphalt driveway and sidewalk completed in 2024. Situated on a corner lot with a large side yard with an electric fence system already in place for pets, which can be turned on or off as needed. Located just a block from Eldridge Park and close to the Lackawanna Trail!
Key facts
- Metal roof
- Asphalt driveway
- Custom-made island
Tags
Property features AI
Exterior
- Parking: Carport
- Utilities: Public water connected; Sewer connected
- Home design: 2-story residence; Resale property
- Construction: Aluminum siding; Metal roof; Existing structure
- Exterior features: Blacktop driveway; City street frontage; Rectangular residential lot (116 x 54)
Interior
- Kitchen: Gas cooktop; Refrigerator
- Flooring: Carpet; Laminate; Varies
- Bathrooms: 1 full bathroom; 1 half bathroom; 1 main-level bathroom
- Heating & cooling: Gas heating; Window air-conditioning units
- Interior features: Eat-in kitchen; Kitchen island; Basement with dirt floor and walk-out access; 6 total rooms
- Laundry & utility: Laundry on main level; Electric water heater; Tankless water heater
Neighborhood map
What this means for you Summary
Snapshot
- This is a 4-bed/1.0-bath single-family listed at $130k.
Deal economics
- At list price, monthly cash flow is $163 ($2k/yr) — positive.
- The deal already cash-flows at list — no discount required.
- Meets the 1% rule at list price ($1k rent vs $130k).
- Recommended offer: $128k (1.5% below list) — sets the bar for market timing.
- Cap rate 7.8% vs local median 10.1% in Elmira — below-typical yield; the buyer is paying a premium for something (appreciation thesis, condition, location) that the cap rate doesn't capture.
Location & tenants
- Location reads 62/100 on livability (#832 in NY) — a middle-class / working-renter tenant base. Strengths: cost of living A+, housing A+, health & safety A+; Watch: schools F, crime F, amenities F.
- Elmira City School District (urban): math 23% / reading 35% proficiency, ranked #580 of 590 in NY (top 98%) — low school quality limits family demand, transient renter base, plan for 1-2y turnover.
- Market conditions: 79 active listings in the ZIP; 2 comparable units currently listed for rent nearby; 91 units permitted in Chemung County in 2024 (63 in 5+ unit buildings).
Forward outlook
- In year one you build about $14k of equity ($898 loan paydown + $13k appreciation (10.0% local appreciation)).
- Chemung County population projected at -17% by 2050 — secular population decline; favor cash flow + early exit over multi-decade hold.
- At projected returns (10.0% appreciation + 3.0% rent growth), your $36k cash investment doubles in ~3 years — after that, you're playing with house money.
- By year 3, paydown + projected appreciation supports a ~$35k cash-out refi (75% LTV) — recoverable capital for the next deal without selling this one.
Negotiation context
- It's been on market 23 days — a 2% lower offer ($128k) is reasonable based on typical stale-listing flexibility.
- Current owner paid $29k; list at $130k implies a 348% gain — meaningful room to come down on a strong offer.
Risks & watch-outs
- Watch-outs: built in 1885 — expect roof / HVAC / electrical / plumbing capex.
Questions for the listing agent
- Built in 1885 — when were the roof, HVAC, electrical panel, plumbing, and water heater last replaced?
- Is there a deadline driving the sale (1031 exchange, divorce, estate, relocation)? That informs how much negotiation room exists.
- Schools are F-rated, which usually means shorter tenancies and higher turnover. Who's the typical renter profile here, and what's been the actual vacancy rate?
- Crime grade is F in this area — have there been break-ins, vandalism, or insurance claims at this property in the last 3 years? What carrier currently insures it and at what premium?
- What's the average days-on-market for RENTAL listings here right now (not sales)? A rising rental-DOM trend means longer vacancies and softer asking-rent achievability than the comps imply.
- What's the recent tenant-quality profile in this submarket — average credit score on applications, eviction rate, late-payment / NSF rate, and stable-employment percentage? A property-management company in the area should have these aggregated.
- How much new for-sale + rental construction is in the pipeline within 1–3 miles? Heavy new supply typically softens prices + rents 12–24 months out; constrained supply supports both.
Investment metrics
- 1% rule
- 1.08% ✓
- Cap rate
- 7.80%
- Cash-on-cash
- 5.39%
- DSCR
- 1.24
- GRM
- 7.7
CMA / ARV
- ARV (on-the-fly)
- $76,583
- Comps found
- 12
Show comp detail 12 sales within ~0.75 mi
| Address | Dist | Beds/Ba | Sqft | Sold | Price | $/sf | Match |
|---|---|---|---|---|---|---|---|
| 1218 Lackawanna Ave | 0.22mi | 3/1.0 (-1) | 1,763 (-1%) | 15mo | $57,000 | $32 | 71 |
| 1230 Lake St | 0.36mi | 4/1.5 | 1,768 (-1%) | 13mo | $124,900 | $71 | 69 |
| 918 Magee St | 0.67mi | 4/1.0 | 1,812 (+2%) | 1mo | $112,000 | $62 | 65 |
| 1201 Magee St | 0.26mi | 3/2.0 (-1) | 1,686 (-5%) | 8mo | $176,000 | $104 | 64 |
| 1213 Magee St | 0.24mi | 3/2.0 (-1) | 1,908 (+7%) | 6mo | $189,361 | $99 | 63 |
| 1315 Grand Central Ave | 0.15mi | 4/1.5 | 1,560 (-12%) | 15mo | $54,000 | $35 | 58 |
| 1227 Lake St | 0.32mi | 3/1.5 (-1) | 1,664 (-7%) | 11mo | $49,000 | $29 | 58 |
| 229 Crete Ave | 0.72mi | 3/1.5 (-1) | 1,730 (-3%) | 3mo | $75,000 | $43 | 52 |
| 756 Carpenter St | 0.71mi | 4/2.0 | 1,896 (+6%) | 2mo | $105,000 | $55 | 51 |
| 950 N Main St | 0.67mi | 4/1.5 | 1,644 (-8%) | 7mo | $37,000 | $23 | 48 |
| 965 Wisner | 0.62mi | 3/1.0 (-1) | 1,890 (+6%) | 16mo | $11,000 | $6 | 43 |
| 957 Oak St | 0.66mi | 4/1.5 | 1,626 (-9%) | 13mo | $54,590 | $34 | 42 |
Match score weights: distance 35% · size 25% · config 20% · recency 20%. Top-matched comps best support the ARV.
Projected returns pro-forma
10.0% appreciation · 3.0% rent growth · sell at horizon
- IRR
- 28.2%
- Equity multiple
- 3.23×
- Total profit
- $81,198
- Equity at exit
- $117,024
- IRR
- 24.6%
- Equity multiple
- 7.35×
- Total profit
- $231,032
- Equity at exit
- $252,367
Cash invested: $36,372 (down + closing). Projections, not guarantees.
Landlord ↔ Tenant lean methodology
- Overall (STATE)
- 15 Strongly Tenant-Friendly
- State New York
- 15 Strongly Tenant-Friendly · D+10
- County
- — inherits STATE
- City
- — inherits STATE
ZIP-level market 14901
- Home prices YoY
- 15.9%
- Active inventory
- 79
- Price-to-rent
- 7.7×
Monthly cashflow live
- Estimated rent
- $1,400 medium interval (Pro) →
- Mortgage (P&I)
- −$681
- Tax from tax record
- −$207 /mo · $2,488/yr
- Insurance
- −$54
- HOA
- −$0
- Vacancy / Maint / Mgmt
- −$294
- Net cashflow
- $163
Break-even live
Sensitivity live
| Price | -10% $237 | -5% $200 | +0% $163 | +5% $127 | +10% $90 |
|---|---|---|---|---|---|
| Rent | -10% $53 | -5% $108 | +0% $163 | +5% $219 | +10% $274 |
| Rate | -1.0pp $229 | -0.5pp $196 | base $163 | +0.5pp $130 | +1.0pp $95 |
UW: 25.0% down · 7.5% · 30yr · 1.5% tax · 5.0% vac · 8.0% maint · 8.0% mgmt
Financing live
Cash to close
- Down payment
- $32,475
- Closing costs
- $3,897
- Reserves months
- —
- Total cash needed
- —
Loan-product check · same deal, 3 products live
Conventional
25% down · 7.5% · 30yr
- Down + closing
- —
- Monthly P&I
- —
- Monthly cashflow
- —
- DSCR
- —
- Eligible?
- —
Personal DTI + credit; lowest rate.
DSCR
20% down · 8.5% · 30yr
- Down + closing
- —
- Monthly P&I
- —
- Monthly cashflow
- —
- DSCR
- —
- Eligible?
- —
No personal income docs; deal must DSCR.
Hard money
10% down · 12.0% · 12mo
- Down + closing
- —
- Monthly P&I
- —
- Monthly cashflow
- —
- DSCR
- —
- Eligible?
- —
Short-term bridge; refi at stabilization.
Rent comps 2 comps
| Address | Beds | Baths | Sqft | Rent | $/sqft | DOM | Units | Dist |
|---|---|---|---|---|---|---|---|---|
| 355 W Clinton St Unit 1 Elmira, NY | 3.0 | 1.5 | 1650 | $1,400 | $0.85 | 44d | 1 | 1.21mi |
| 106 W 2nd St Unit A Elmira, NY | 3.0 | 1.0 | 1395 | $1,400 | $1.00 | 44d | 1 | 1.27mi |
Listing history 18 events
-
2026-06-19days on market $129,900 Active 23 DOM
-
2026-06-18days on market $129,900 Active 22 DOM
-
2026-06-17days on market $129,900 Active 21 DOM
-
2026-06-16days on market $129,900 Active 20 DOM
-
2026-06-15days on market $129,900 Active 19 DOM
-
2026-06-14days on market $129,900 Active 17 DOM
-
2026-06-12days on market $129,900 Active 16 DOM
-
2026-06-09days on market $129,900 Active 13 DOM
-
2026-06-08days on market $129,900 Active 12 DOM
-
2026-06-07days on market $129,900 Active 11 DOM
-
2026-06-05days on market $129,900 Active 8 DOM
-
2026-06-03days on market $129,900 Active 7 DOM
-
2026-06-02days on market $129,900 Active 6 DOM
-
2026-06-01days on market $129,900 Active 5 DOM
-
2026-05-31days on market $129,900 Active 4 DOM
-
2026-05-30days on market $129,900 Active 3 DOM
-
2026-05-27$129,900 Active
-
2019-10-17soldstatus $29,000
ⓘ Source: listings_history table (triggers on properties + properties_extension) + one-shot
backfill from property_details.listing_events for pre-trigger history.
Tax reassessment forecast NY · Partial reset (capped growth)
- Current annual tax
- $2,488 · $207/mo
- Projected year-2 tax
- $2,488 · $207/mo
- Expected delta
- $0/yr ($0/mo · 0.0%)
ⓘ Screening estimate from a state-policy table — verify with the county assessor before closing.
Climate risk First Street
- Flood 4/10 Moderate FEMA zone X (shaded) · 23% chance over 30 yrs
- Wildfire 2/10 Low
- Heat 3/10 Moderate 7 d/yr ≥96°F today · 16 d/yr by 30 yrs out
- Wind 2/10 Low 100% chance of damaging wind over 30 yrs
- Air quality 1/10 Low 0 unhealthy d/yr today · 0 by 30 yrs out
Nearby sold comps map
Loading sold comps map…
Walkable amenities ~0.75 mi
Loading nearby amenities…
Taxation est. · year 1
- Rental income
- $16,800
- − Mortgage interest
- −$7,276
- − Property taxes
- −$2,488
- − Insurance
- −$650
- − Repairs & maintenance
- −$1,344
- − Management
- −$1,344
- − Depreciation
- −$3,779
- Taxable loss
- −$81
- Est. tax savings @ 24.0%
- +$19
- After-tax cash flow
- $1,979/yr
For passive investors: Depreciation is non-cash, so a rental often shows a tax loss while cash-flowing — sheltering income. Rental losses are passive: they offset passive income freely, and up to $25,000/yr can offset ordinary (W-2) income if you actively participate and your MAGI is under $100k (phasing out to $0 by $150k); unused losses carry forward. On sale, claimed depreciation is recaptured at up to 25%, and gains may owe capital-gains tax (a 1031 exchange can defer both). Figures are a year-1 estimate at your 24.0% rate — not tax advice; consult a CPA.
Schools (NCES district)
- District
- Elmira City School District
- NCES district ID
- 3610560
- Math proficiency
- 23% ▼ -7.00%
- Reading proficiency
- 35% ▲ 7.00%
- Median HH income
- $40,180
- Composite
- 24.39/100
- National rank
- #7688
- State rank
- #580 of 590 in NY
Livability — Elmira
- Score
- 62/100
- State rank
- #832
- US rank
- #16139
Category grades
Schools grade is shown separately in the Schools card above.
Census & demographics
- Census place
- Elmira, NY
- City population
- 14,276
- Population (ZIP)
- 14,430
Population outlook (Chemung County) Hauer SSP2
- Today (2025)
- 82,931 people
- By 2030
- 80,356 · -3.1%
- By 2040
- 74,745 · -9.9%
- By 2050
- 69,012 · -16.8%
- By 2075
- 55,689 · -32.8%
- By 2100
- 41,428 · -50.0%
Race, ethnicity, and origin ACS 2023
- Neighborhood character
- Predominantly White (70%)
- Race & ethnicity
- White 70% Black 15% Two or more races 7% Hispanic / Latino 7% Asian 1%
- Hispanic origin (detail)
- Mexican 1% Puerto Rican 3%
- Common ancestry
- Romanian 4% Slovak 3% Iranian 2%
- Foreign-born
- 4% · Canada, China
- Languages at home
- 93% English-only · Spanish 3% Russian/Polish/Slavic 1% Chinese 1%
Political lean MEDSL · Chemung
- 2024 margin
- R (+16.8) · D 41.6% · R 58.4%
- 2008→2024 swing
- -15.6pp toward R · 2008: -1.2pp · 2024: -16.8pp
- All cycles
- 2024: R+16.8 2020: R+13.4 2016: R+20.0 2012: R+2.9 2008: R+1.2
Not yet ingested
- Civics
- —
Market trends
- HPI YoY
- ▲ 32.34%
- Current HPI
- 236.2674
- Rent YoY
- —
- Metro
- —
- State GDP YoY
- ▲ 2.60%
- F500 in state
- 92
Industry mix (Fortune 500 HQ in NY)
| Industry | F500 HQs | Revenue |
|---|---|---|
| Financial Services | 10 | $950B |
|
||
| Consumer Goods | 9 | $162B |
|
||
| Insurance | 4 | $225B |
|
||
| Telecommunications | 2 | $144B |
|
||
| Pharmaceuticals | 2 | $112B |
|
||
| Media / Entertainment | 2 | $69B |
|
||
Price history
+347.9% since first listed2 events — show timeline
- 2026-05-27 Listed $129,900 UNYREIS
- 2019-10-17 Sold (Public Records) $29,000 Public Records
Property tax history
+12.7%/yrLatest (2025): $2,488 · -11.8% YoY. Source: county tax records.
Cash-flow waterfall
monthlySold comps — $/sqft
last 12 mo · ≤1 miLoading sold comps…