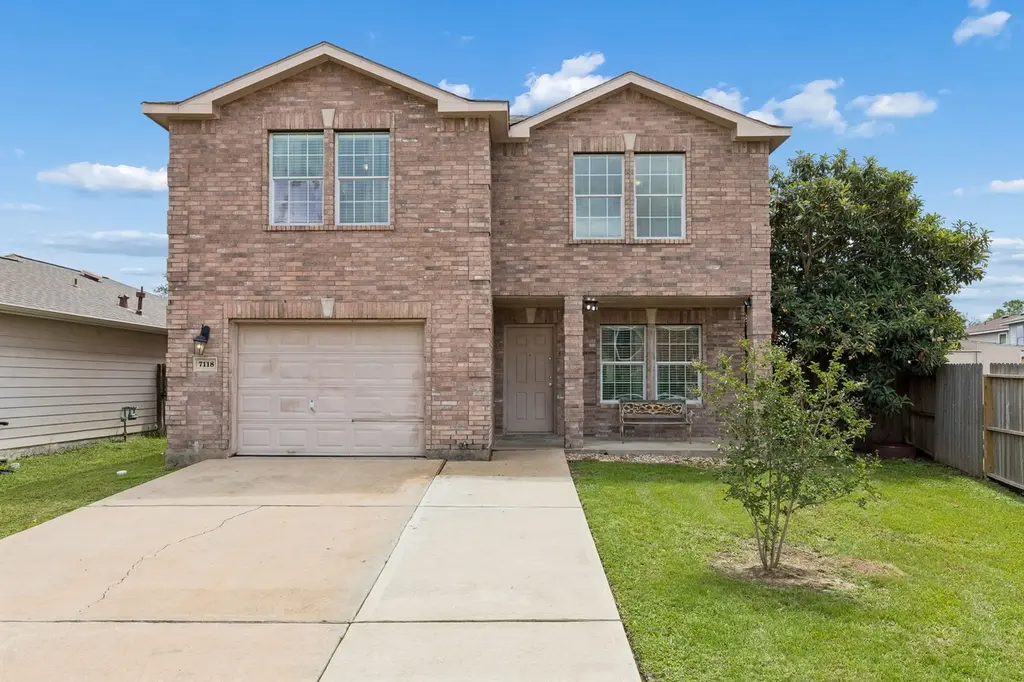
7118 Rising Brook Dr · Houston, TX
Flood risk 6/10 · Moderate
- FEMA flood zone
- X (unshaded)
- Chance of flooding over 30 yrs
- 0.71%
- Est. flood insurance / yr
- $507 – $1,088
Fire risk 3/10 · Minor
- Est. fire insurance / yr
- $1,222 – $2,270
Heat risk 9/10 · Severe
- Hot days now (above 110°F)
- 7 days/yr
- Hot days in 30 yrs
- 23 days/yr
Wind risk 8/10 · Major
- Chance of severe wind over 30 yrs
- 99.0%
Air-quality risk 2/10 · Minimal
- Unhealthy air days now
- 2 days/yr
- Unhealthy air days in 30 yrs
- 2 days/yr
Risk factors via First Street. Map © Google.
Why this score? — see what drove the D grade
The composite is a weighted blend of 9 inputs, each scored 0–100. Each bar is that input's sub-score; the figure is the points it added to the 100-point composite (weight × sub-score).
- Cash flow +10.8/30.0
- ARV discount +9.4/15.0
- Schools +4.4/10.0
- 1% rule +4.2/10.0
- Livability +3.7/5.0
- DSCR +3.1/10.0
- Condition / age +2.5/5.0
- Rent growth +2.2/5.0
- Appreciation +0.0/10.0
$260,000
🖨 Deal sheet 📄 Offer letter ✓ Due diligence
Listing remarks
Welcome to 7118 Rising Brook Dr, a spacious two-story home located in Cypress, TX 77433. This well-designed 2 story residence offers 5 bedrooms and 2.5 bathrooms, providing ample space for comfortable everyday living and flexible use of rooms for guests, home office, or additional living needs. Located in an established Cypress neighborhood, the property offers convenient access to nearby schools, shopping, dining, and major roadways, making commuting and daily errands simple and efficient.
Key facts
- 5,366 sq ft lot
- Garage
- Built 2005
Property features AI
Finance
- Other: Seller disclosure available
- HOA & community: Lancaster Community association; Annual association fee of $475
Exterior
- Parking: Attached garage with 1 parking space
- Utilities: Public water; Public sewer
- Home design: Residential property; Built in 2005; Slab foundation
- Construction: Brick construction; Composition roof
- Exterior features: Located in a subdivision; Lot approximately 0.12 acres
Interior
- Kitchen: Dishwasher; Microwave
- Bedrooms: Primary bedroom on second level; Additional bedrooms on second level (multiple)
- Bathrooms: 2 full bathrooms; 1 half bathroom; Primary bathroom on second level
- Heating & cooling: Central heating (electric); Central air conditioning (electric)
- Interior features: Dishwasher; Microwave; 10 total rooms
Neighborhood map
What this means for you Summary
Snapshot
- This is a 4-bed/2.5-bath single-family listed at $260k.
Deal economics
- At list price, monthly cash flow is $-118 ($-1k/yr) — negative.
- To cash-flow at today's rent, offer at most $239k (8.0% below list).
- To meet the 1% rule (rent ≥ 1% of price), the offer needs to be $240k (7.6% below list).
- Recommended offer: $239k (8.0% below list) — sets the bar for cash-flow.
- Cap rate 5.7% vs local median 3.2% in Houston — top-decile yield for the area; either an underpriced asset or a hidden risk that comps aren't pricing in. Stress-test before assuming the spread holds.
Location & tenants
- Location reads 74/100 on livability (#184 in TX, #4,771 nationally) — a middle-class / working-renter tenant base. Strengths: amenities A+, cost of living A+, housing A+; Watch: crime F.
- Cypress-Fairbanks ISD (suburban): math 45% / reading 52% proficiency, ranked #161 of 826 in TX (top 20%) — families likely to look elsewhere, expect single-tenant / working-renter base with shorter leases.
- Zoned schools: Hopper Middle (math 24% / reading 34%, grade F, #1,103 of 1,662 statewide, top 67%, 930 students, 80% FRL); Cypress Springs H S (math 35% / reading 60%, grade D, #583 of 1,632 statewide, top 36%, 2,788 students, 68% FRL) — zoned schools average 74% FRL vs 43% district-wide (31 pts higher); higher-poverty schools than district average — tighter screening recommended.
- Market conditions: Rents soft (-1.3%/yr); 2034 active listings in the ZIP; 40 comparable units currently listed for rent nearby; rentals lingering (median 44d on market — plan ~5-8 weeks vacancy on turnover, expect pricing pressure); 52% of comp listings sitting > 30 days — soft ceiling on asking rent; high-income renter base; 29,883 units permitted in Harris County in 2024 (8,621 in 5+ unit buildings).
Forward outlook
- Local home prices are declining (-3.0%/yr); year-one equity from $2k of loan paydown is wiped out by about $8k of value loss. Plan a longer hold.
- Harris County population projected at +47% by 2050 — long-run rental-demand tailwind backs the buy-and-hold thesis.
Negotiation context
- It's been on market 25 days — a 2% lower offer ($256k) is reasonable based on typical stale-listing flexibility.
- 6 sale attempts since 4y ago with the ask held roughly flat each time — persistent listings suggest the price (not the market) is what's stuck; bring a comps-based counter.
Risks & watch-outs
- Climate carrying-cost: major flood risk; severe wind risk, 99% chance of damaging wind over 30y; extreme-heat days projected 7→23/yr by 2055 (HVAC capex compounding) — expect insurance premiums to compound above CPI over the hold.
Questions for the listing agent
- What do current leases actually rent for vs. the listed asking? Can we see a recent rent roll and the last 12 months of T-12 income?
- What does the HOA fee cover, when was the last increase, and are there any pending special assessments or reserve-fund shortfalls?
- Is there a deadline driving the sale (1031 exchange, divorce, estate, relocation)? That informs how much negotiation room exists.
- Schools are D-rated, which usually means shorter tenancies and higher turnover. Who's the typical renter profile here, and what's been the actual vacancy rate?
- Crime grade is F in this area — have there been break-ins, vandalism, or insurance claims at this property in the last 3 years? What carrier currently insures it and at what premium?
- The area grade is low — what's the realistic commute time and amenity access for the typical tenant pool here? Any planned neighborhood developments (good or bad) we should know about?
- What's the average days-on-market for RENTAL listings here right now (not sales)? A rising rental-DOM trend means longer vacancies and softer asking-rent achievability than the comps imply.
- What's the recent tenant-quality profile in this submarket — average credit score on applications, eviction rate, late-payment / NSF rate, and stable-employment percentage? A property-management company in the area should have these aggregated.
- How much new for-sale + rental construction is in the pipeline within 1–3 miles? Heavy new supply typically softens prices + rents 12–24 months out; constrained supply supports both.
Investment metrics
- 1% rule
- 0.92% ✗
- Cap rate
- 5.75%
- Cash-on-cash
- -1.94%
- DSCR
- 0.91
- GRM
- 9.0
CMA / ARV
- ARV (median comp)
- $271,355
- List price
- $260,000
- Delta
- -0.50%
- Verdict
- FAIR
- Comps
- 20 within 1.0 mi
Show comp detail 12 sales within ~0.75 mi
| Address | Dist | Beds/Ba | Sqft | Sold | Price | $/sf | Match |
|---|---|---|---|---|---|---|---|
| 20203 Sendera Oaks Ln | 0.35mi | 3/2.0 (-1) | 2,040 (+4%) | 4mo | $239,900 | $118 | 67 |
| 20014 Goldlake Dr | 0.51mi | 3/2.0 (-1) | 2,031 (+3%) | 2mo | $299,900 | $148 | 62 |
| 20519 Holly Barr Ln | 0.26mi | 3/2.5 (-1) | 1,751 (-11%) | 4mo | $269,999 | $154 | 62 |
| 20022 Rustic Lake Ln | 0.71mi | 4/2.0 | 1,905 (-3%) | 2mo | $252,000 | $132 | 58 |
| 20730 Cypress Crescent Ln | 0.72mi | 3/2.5 (-1) | 1,967 (+0%) | 4mo | $270,000 | $137 | 58 |
| 21043 Salt Rock Dr | 0.74mi | 4/2.5 | 1,900 (-3%) | 3mo | $344,900 | $182 | 58 |
| 7554 Appleberry Dr | 0.50mi | 3/2.0 (-1) | 1,812 (-8%) | 2mo | $275,000 | $152 | 55 |
| 20702 Desert Shadows Ln | 0.56mi | 3/2.5 (-1) | 2,140 (+9%) | 1mo | $265,000 | $124 | 53 |
| 6810 Creek Village Dr | 0.74mi | 3/2.5 (-1) | 2,055 (+5%) | 5mo | $249,900 | $122 | 49 |
| 6746 Windy River Ln | 0.61mi | 3/2.5 (-1) | 2,152 (+10%) | 3mo | $255,000 | $118 | 48 |
| 21054 Salt Rock Dr | 0.74mi | 5/3.5 (+1) | 2,043 (+4%) | 4mo | $369,900 | $181 | 47 |
| 21022 Salt Rock Dr | 0.74mi | 4/2.0 | 2,141 (+9%) | 5mo | $449,900 | $210 | 45 |
Match score weights: distance 35% · size 25% · config 20% · recency 20%. Top-matched comps best support the ARV.
Projected returns pro-forma
-3.0% appreciation · 0.0% rent growth · sell at horizon
- IRR
- -23.3%
- Equity multiple
- 0.22×
- Total profit
- $-56,505
- Equity at exit
- $38,767
- IRR
- -30.9%
- Equity multiple
- -0.17×
- Total profit
- $-85,380
- Equity at exit
- $22,480
Cash invested: $72,800 (down + closing). Projections, not guarantees.
Landlord ↔ Tenant lean methodology
- Overall (STATE)
- 87 Strongly Landlord-Friendly
- State Texas
- 87 Strongly Landlord-Friendly · R+5
- County
- — inherits STATE
- City
- — inherits STATE
ZIP-level market 77433
- Home prices YoY
- -28.5%
- Rents YoY
- -1.3%
- Active inventory
- 2034
- Price-to-rent
- 9.0×
Monthly cashflow live
- Estimated rent
- $2,402 high interval (Pro) →
- Mortgage (P&I)
- −$1,363
- Tax from tax record
- −$504 /mo · $6,045/yr
- Insurance
- −$108
- HOA
- −$40
- Vacancy / Maint / Mgmt
- −$504
- Net cashflow
- $-118
Break-even live
UW: 25.0% down · 7.5% · 30yr · 1.5% tax · 5.0% vac · 8.0% maint · 8.0% mgmt
Financing live
Cash to close
- Down payment
- $65,000
- Closing costs
- $7,800
- Reserves months
- —
- Total cash needed
- —
Loan-product check · same deal, 3 products live
Conventional
25% down · 7.5% · 30yr
- Down + closing
- —
- Monthly P&I
- —
- Monthly cashflow
- —
- DSCR
- —
- Eligible?
- —
Personal DTI + credit; lowest rate.
DSCR
20% down · 8.5% · 30yr
- Down + closing
- —
- Monthly P&I
- —
- Monthly cashflow
- —
- DSCR
- —
- Eligible?
- —
No personal income docs; deal must DSCR.
Hard money
10% down · 12.0% · 12mo
- Down + closing
- —
- Monthly P&I
- —
- Monthly cashflow
- —
- DSCR
- —
- Eligible?
- —
Short-term bridge; refi at stabilization.
Rent comps 40 comps
| Address | Beds | Baths | Sqft | Rent | $/sqft | DOM | Units | Dist |
|---|---|---|---|---|---|---|---|---|
| 20123 Braley Ct Cypress, TX | 3.0 | 2.5 | 1726 | $2,036 | $1.18 | 4d | 1 | 0.18mi |
| 6810 N Fry Rd Katy, TX | 1.0–3.0 | 1.0–3.0 | 1151 | $2,683 | $2.33 | 1d | 56 | 0.47mi |
| 7310 Coconut Bay Dr Cypress, TX | 4.0 | 2.0 | 1620 | $2,307 | $1.42 | 43d | 1 | 0.51mi |
| 20126 Breezy Oak Ct Cypress, TX | 3.0 | 2.0 | 1667 | $2,100 | $1.26 | 4d | 1 | 0.55mi |
| 20735 Dewberry Creek Ln Katy, TX | 4.0 | 2.0 | 1609 | $1,756 | $1.09 | 21d | 1 | 0.56mi |
| 21038 Bay Village Dr Cypress, TX | 4.0 | 2.5 | 1904 | $2,491 | $1.31 | 43d | 1 | 0.64mi |
| 21031 Sandestin Ridge Dr Cypress, TX | 5.0 | 3.5 | 2099 | $2,861 | $1.36 | 43d | 1 | 0.64mi |
| 21034 Shore Oak Dr Cypress, TX | 4.0 | 3.0 | 2110 | $2,950 | $1.40 | 43d | 1 | 0.65mi |
| 19815 Blushdawn Sierra Ct Cypress, TX | 3.0 | 2.5 | 2590 | $2,050 | $0.79 | 24d | 1 | 0.65mi |
| 21054 Breezeway Cove Dr Bridgeland, TX | 3.0–4.0 | 2.5–3.5 | 1784 | $3,258 | $1.83 | 3d | 41 | 0.66mi |
| 20507 Barker Bend Ct Katy, TX | 3.0 | 2.0 | 1488 | $1,825 | $1.23 | 43d | 1 | 0.67mi |
| 6642 High Stone Ln Katy, TX | 4.0 | 2.0 | 2091 | $1,999 | $0.96 | 43d | 1 | 0.74mi |
| 21010 Treasure Gate Ln Cypress, TX | 4.0 | 2.0 | 2157 | $2,768 | $1.28 | 43d | 1 | 0.74mi |
| 21014 Montego Breeze Ln Cypress, TX | 4.0 | 2.5 | 2489 | $2,953 | $1.19 | 43d | 1 | 0.78mi |
| 21035 Carmel Valley Dr Katy, TX | 3.0 | 2.0 | 1431 | $1,791 | $1.25 | 24d | 1 | 0.79mi |
| 21047 Treasure Gate Ln Cypress, TX | 5.0 | 3.0 | 2461 | $2,953 | $1.20 | 43d | 1 | 0.79mi |
| 21038 Treasure Gate Ln Cypress, TX | 4.0 | 2.5 | 1804 | $2,676 | $1.48 | 43d | 1 | 0.79mi |
| 6619 Rusty Ridge Ln Katy, TX | 3.0 | 2.5 | 1450 | $1,895 | $1.31 | 3d | 1 | 0.80mi |
| 21046 Treasure Gate Ln Cypress, TX | 4.0 | 2.5 | 2489 | $3,045 | $1.22 | 43d | 1 | 0.80mi |
| 21034 Montego Breeze Ln Cypress, TX | 5.0 | 3.0 | 2461 | $2,861 | $1.16 | 43d | 1 | 0.81mi |
| 19715 Swan Valley Dr Cypress, TX | 3.0 | 2.0 | 1380 | $1,886 | $1.37 | 43d | 1 | 0.82mi |
| 7830 Ashland Springs Ln Cypress, TX | 4.0 | 2.5 | 2352 | $1,974 | $0.84 | 20d | 1 | 0.82mi |
| 19442 Elmtree Estates Dr Katy, TX | 3.0 | 2.0 | 1735 | $1,776 | $1.02 | 12d | 1 | 0.83mi |
| 21054 Montego Breeze Ln Cypress, TX | 3.0–5.0 | 2.0–3.5 | 1935 | $2,622 | $1.35 | 12d | 21 | 0.85mi |
| 21235 Catalina Palm Dr Cypress, TX | 4.0 | 2.0 | 1756 | $2,600 | $1.48 | 43d | 1 | 0.87mi |
| 21114 Montego Bay Dr Cypress, TX | 3.0 | 2.5 | 2124 | $2,499 | $1.18 | 43d | 1 | 0.89mi |
| 19434 Glenway Falls Dr Katy, TX | 3.0 | 2.0 | 1326 | $1,800 | $1.36 | 43d | 1 | 0.91mi |
| 20211 Longenbaugh Rd Cypress, TX | 1.0–3.0 | 1.0–2.0 | 1065 | $2,506 | $2.35 | 1d | 27 | 0.92mi |
| 6506 Garden Canyon Dr Katy, TX | 3.0 | 2.0 | 1842 | $1,895 | $1.03 | 21d | 1 | 0.97mi |
| 19607 Buckland Park Dr Katy, TX | 3.0 | 2.0 | 1798 | $1,965 | $1.09 | 2d | 1 | 0.97mi |
| 7850 Maverick Trace Ln Cypress, TX | 3.0 | 3.0 | 1852 | $1,875 | $1.01 | 43d | 1 | 0.97mi |
| 19758 Crossfalls Ln Cypress, TX | 4.0 | 2.5 | 2156 | $2,070 | $0.96 | 44d | 1 | 0.98mi |
| 6610 Gorton Dr Katy, TX | 4.0 | 3.5 | 2481 | $750 | $0.30 | 2d | 1 | 0.99mi |
| 7546 Coral Terrace Dr Cypress, TX | 3.0 | 2.5 | 2050 | $2,699 | $1.32 | 43d | 1 | 1.01mi |
| 6502 Wellington Meadows Dr Katy, TX | 3.0 | 2.0 | 1416 | $1,500 | $1.06 | 12d | 1 | 1.09mi |
| 19638 Billineys Park Dr Katy, TX | 3.0 | 2.5 | 1752 | $1,750 | $1.00 | 19d | 1 | 1.10mi |
| 20519 Keegans Ledge Ln Cypress, TX | 4.0 | 3.0 | 1907 | $2,100 | $1.10 | 43d | 1 | 1.12mi |
| 6402 Wild River Dr Katy, TX | 3.0 | 2.0 | 1572 | $2,091 | $1.33 | 2d | 1 | 1.16mi |
| 20967 Young Meadows Way Katy, TX | 3.0 | 2.0 | 1256 | $1,795 | $1.43 | 7d | 1 | 1.25mi |
| 7911 Tuscan Cypress Dr Cypress, TX | 4.0 | 3.0 | 1730 | $2,475 | $1.43 | 43d | 1 | 1.28mi |
HOA detail
- Monthly dues
- $40 · $480/yr
Listing history 25 events
-
2026-06-18days on market $260,000 Active 25 DOM
-
2026-06-17days on market $260,000 Active 24 DOM
-
2026-06-16days on market $260,000 Active 23 DOM
-
2026-06-15days on market $260,000 Active 22 DOM
-
2026-06-13days on market $260,000 Active 20 DOM
-
2026-06-13days on market $260,000 Active 19 DOM
-
2026-06-09days on market $260,000 Active 16 DOM
-
2026-06-08days on market $260,000 Active 15 DOM
-
2026-06-07days on market $260,000 Active 14 DOM
-
2026-06-04days on market $260,000 Active 11 DOM
-
2026-06-03days on market $260,000 Active 10 DOM
-
2026-06-02days on market $260,000 Active 9 DOM
-
2026-06-01days on market $260,000 Active 8 DOM
-
2026-05-31days on market $260,000 Active 7 DOM
-
2026-04-21$270,000 Active 496-char remark
-
2023-03-31historical
-
2023-03-14status Active
-
2023-03-08status Option Pending
-
2023-03-01status Active
-
2023-02-23status Option Pending
-
2023-01-01price $259,900
-
2022-11-29$270,000 Active
-
2022-11-05historical
-
2022-09-27price $287,500
-
2022-07-05$295,000 Active
ⓘ Source: listings_history table (triggers on properties + properties_extension) + one-shot
backfill from property_details.listing_events for pre-trigger history.
Tax reassessment forecast TX · Resets to sale price
- Current annual tax
- $6,045 · $504/mo
- Projected year-2 tax
- $6,045 · $504/mo
- Expected delta
- $0/yr ($0/mo · 0.0%)
ⓘ Screening estimate from a state-policy table — verify with the county assessor before closing.
Climate risk First Street
- Flood 6/10 Major FEMA zone X (unshaded) · 71% chance over 30 yrs
- Wildfire 3/10 Moderate
- Heat 9/10 Extreme 7 d/yr ≥110°F today · 23 d/yr by 30 yrs out
- Wind 8/10 Severe 99% chance of damaging wind over 30 yrs
- Air quality 2/10 Low 2 unhealthy d/yr today · 2 by 30 yrs out
Nearby sold comps map
Loading sold comps map…
Walkable amenities ~0.75 mi
Loading nearby amenities…
Taxation est. · year 1
- Rental income
- $28,826
- − Mortgage interest
- −$14,564
- − Property taxes
- −$6,045
- − Insurance
- −$1,300
- − Repairs & maintenance
- −$2,306
- − Management
- −$2,306
- − HOA
- −$480
- − Depreciation
- −$7,564
- Taxable loss
- −$5,739
- Est. tax savings @ 24.0%
- +$1,377
- After-tax cash flow
- $-37/yr
For passive investors: Depreciation is non-cash, so a rental often shows a tax loss while cash-flowing — sheltering income. Rental losses are passive: they offset passive income freely, and up to $25,000/yr can offset ordinary (W-2) income if you actively participate and your MAGI is under $100k (phasing out to $0 by $150k); unused losses carry forward. On sale, claimed depreciation is recaptured at up to 25%, and gains may owe capital-gains tax (a 1031 exchange can defer both). Figures are a year-1 estimate at your 24.0% rate — not tax advice; consult a CPA.
Schools (NCES district)
- District
- Cypress-Fairbanks ISD
- NCES district ID
- 4816110
- Math proficiency
- 45% ▼ -12.00%
- Reading proficiency
- 52% ▼ -2.00%
- Median HH income
- $72,025
- Composite
- 43.63/100
- National rank
- #2968
- State rank
- #161 of 826 in TX
Livability — Houston
- Score
- 74/100
- State rank
- #184
- US rank
- #4771
Category grades
Schools grade is shown separately in the Schools card above.
Census & demographics
- County
- Harris County · 4,702,590 people
- City population
- 3,226,434
- Metro
- Houston-The Woodlands-Sugar Land, TX
- Population (ZIP)
- 116,550
- Household income
- $143,934
- Rent vs Own
- Severe rent burden
- 1700.0
Population outlook (Harris County) Hauer SSP2
- Today (2025)
- 5,571,493 people
- By 2030
- 6,089,821 · +9.3%
- By 2040
- 7,142,806 · +28.2%
- By 2050
- 8,185,864 · +46.9%
- By 2075
- 10,574,329 · +89.8%
- By 2100
- 12,109,958 · +117.4%
Race, ethnicity, and origin ACS 2023
- Neighborhood character
- Highly diverse neighborhood (Simpson 0.73)
- Race & ethnicity
- White 39% Hispanic / Latino 27% Black 17% Two or more races 14% Asian 13%
- Hispanic origin (detail)
- Mexican 16%
- Common ancestry
- Lithuanian 2% Romanian 1% Italian 1%
- Foreign-born
- 21% · Canada, Vietnam, China
- Languages at home
- 66% English-only · Spanish 19% Other Indo-European 4% Vietnamese 4%
Political lean MEDSL · Harris
- 2024 margin
- Lean D (+5.5) · D 52.0% · R 46.4% · Other 1.6%
- 2008→2024 swing
- +3.9pp toward D · 2008: 1.6pp · 2024: 5.5pp
- All cycles
- 2024: D+5.5 2020: D+13.3 2016: D+12.4 2012: D+0.1 2008: D+1.6
Not yet ingested
- Civics
- —
Market trends
- HPI YoY
- ▼ -87.83%
- Current HPI
- 220.2136
- Rent YoY
- ▼ -1.27%
- Metro
- Houston-The Woodlands-Sugar Land, TX
- State GDP YoY
- ▲ 3.95%
- F500 in state
- 110
Industry mix (Fortune 500 HQ in TX)
| Industry | F500 HQs | Revenue |
|---|---|---|
| Energy | 16 | $1,198B |
|
||
| Technology | 5 | $198B |
|
||
| Engineering / Construction | 4 | $72B |
|
||
| Energy Services | 3 | $60B |
|
||
| Utilities | 3 | $41B |
|
||
| Healthcare | 2 | $330B |
|
||
Price history
-11.9% since first listed13 events — show timeline
- 2026-05-24 Listing Removed — HARMLS
- 2026-05-24 Listed $260,000 HARMLS
- 2026-04-21 Listed $270,000 HARMLS
- 2023-03-31 Listing Removed — HARMLS
- 2023-03-14 Relisted — HARMLS
- 2023-03-08 Pending — HARMLS
- 2023-03-01 Relisted — HARMLS
- 2023-02-23 Pending — HARMLS
- 2023-01-01 Price Changed $259,900 HARMLS
- 2022-11-29 Listed $270,000 HARMLS
- 2022-11-05 Listing Removed — HARMLS
- 2022-09-27 Price Changed $287,500 HARMLS
- 2022-07-05 Listed $295,000 HARMLS
Property tax history
+6.1%/yrLatest (2025): $6,045 · +9.1% YoY. Source: county tax records.
Cash-flow waterfall
monthlySold comps — $/sqft
last 12 mo · ≤1 miLoading sold comps…