325 State St · Westfield, IL
Flood risk 1/10 · Minimal
- FEMA flood zone
- X (unshaded)
- Chance of flooding over 30 yrs
- 0.0%
- Est. flood insurance / yr
- $507 – $1,088
Fire risk 1/10 · Minimal
- Est. fire insurance / yr
- $804 – $1,492
Heat risk 3/10 · Minor
- Hot days now (above 105°F)
- 7 days/yr
- Hot days in 30 yrs
- 19 days/yr
Wind risk 2/10 · Minimal
- Chance of severe wind over 30 yrs
- 1.0%
Air-quality risk 2/10 · Minimal
- Unhealthy air days now
- 1 days/yr
- Unhealthy air days in 30 yrs
- 1 days/yr
Risk factors via First Street. Map © Google.
Why this score? — see what drove the A- grade
The composite is a weighted blend of 9 inputs, each scored 0–100. Each bar is that input's sub-score; the figure is the points it added to the 100-point composite (weight × sub-score).
- Cash flow +30.0/30.0
- ARV discount +15.0/15.0
- 1% rule +10.0/10.0
- DSCR +10.0/10.0
- Appreciation +6.2/10.0
- Livability +2.9/5.0
- Rent growth +2.5/5.0
- Condition / age +2.5/5.0
- Schools +2.2/10.0
$42,500
🖨 Deal sheet 📄 Offer letter ✓ Due diligence
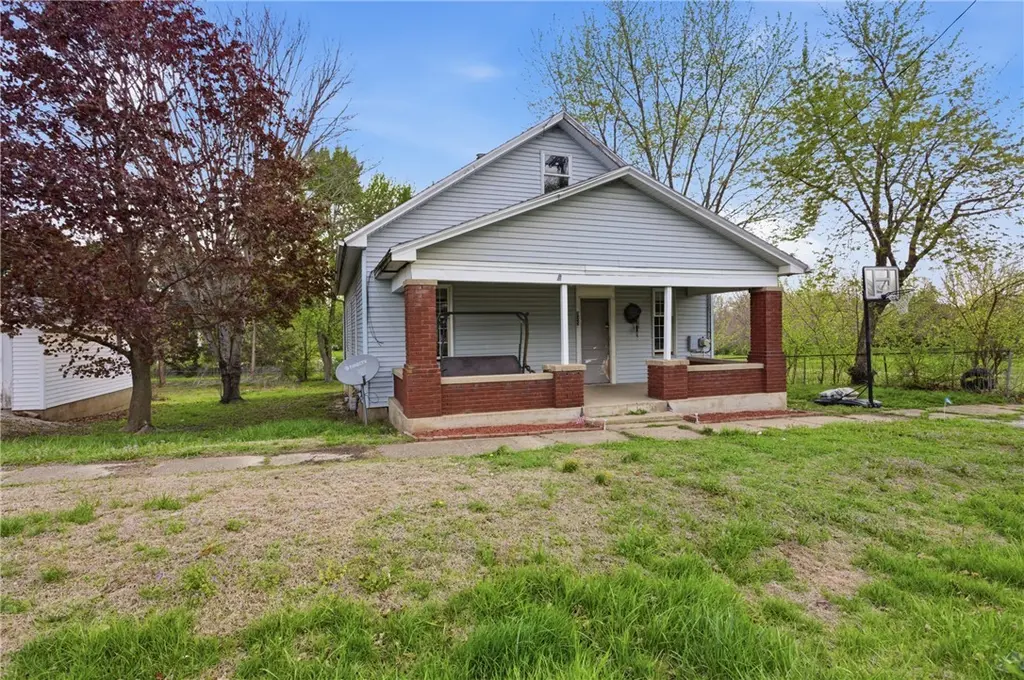
Listing remarks
Investor opportunity in Westfield, IL with strong value-add potential. This 1 bed, 1 bath home offers approx. 1,040 sq ft with tall ceilings and a functional layout buyers are actively searching for. The kitchen features an island and opens to main living areas with durable LVP flooring. A full basement provides added storage or future use flexibility. Exterior highlights include vinyl siding, a shed, and a spacious yard. Key system updates include newer electrical, updated plumbing, and a PVC sewer line. Located in a quiet small-town setting, this property presents a practical option for investors seeking an affordable entry point with upside potential.
Key facts
- Island kitchen
- Full basement
- Vinyl siding
Tags
Property features AI
Exterior
- Utilities: Public water; Septic tank
- Home design: Single-family residence; One-story
- Construction: Vinyl siding; Asphalt roof
- Exterior features: Front porch; Rear porch; Shed(s); Gravel road access
Interior
- Kitchen: Microwave; Oven; Refrigerator
- Bathrooms: 1 full bathroom
- Heating & cooling: Natural gas heating; Window air conditioning units
- Interior features: Gas water heater; Microwave; Oven; Refrigerator; Unfinished full basement
- Laundry & utility: Laundry on main level
Neighborhood map
What this means for you Summary
Snapshot
- This is a 1-bed/1.0-bath single-family listed at $42k.
Deal economics
- At list price, monthly cash flow is $478 ($6k/yr) — positive.
- The deal already cash-flows at list — no discount required.
- Meets the 1% rule at list price ($976 rent vs $42k).
- Recommended offer: $42k (1.5% below list) — sets the bar for market timing.
Location & tenants
- Location reads 58/100 on livability (#1,087 in IL) — a working-class tenant base; expect higher turnover. Strengths: cost of living A+, housing A; Watch: schools F, crime D-, amenities F.
- Casey-Westfield CUSD 4C (town): math 19% / reading 32% proficiency, ranked #322 of 620 in IL (top 52%) — low school quality limits family demand, transient renter base, plan for 1-2y turnover.
- Market conditions: 4 active listings in the ZIP; 1 units permitted in Clark County in 2024 (0 in 5+ unit buildings).
Forward outlook
- In year one you build about $1k of equity ($294 loan paydown + $993 appreciation (2.3% local appreciation)).
- Clark County population projected at -20% by 2050 — secular population decline; favor cash flow + early exit over multi-decade hold.
- At projected returns (2.3% appreciation + 3.0% rent growth), your $12k cash investment doubles in ~2 years — after that, you're playing with house money.
Negotiation context
- It's been on market 18 days — a 2% lower offer ($42k) is reasonable based on typical stale-listing flexibility.
- Current owner paid $35k; 21% above their basis — modest negotiation headroom, anchor on the comps not their cost.
Risks & watch-outs
- Watch-outs: built in 1910 — expect roof / HVAC / electrical / plumbing capex.
Questions for the listing agent
- Built in 1910 — when were the roof, HVAC, electrical panel, plumbing, and water heater last replaced?
- Is there a deadline driving the sale (1031 exchange, divorce, estate, relocation)? That informs how much negotiation room exists.
- Schools are F-rated, which usually means shorter tenancies and higher turnover. Who's the typical renter profile here, and what's been the actual vacancy rate?
- Crime grade is D in this area — have there been break-ins, vandalism, or insurance claims at this property in the last 3 years? What carrier currently insures it and at what premium?
- What's the average days-on-market for RENTAL listings here right now (not sales)? A rising rental-DOM trend means longer vacancies and softer asking-rent achievability than the comps imply.
- What's the recent tenant-quality profile in this submarket — average credit score on applications, eviction rate, late-payment / NSF rate, and stable-employment percentage? A property-management company in the area should have these aggregated.
- How much new for-sale + rental construction is in the pipeline within 1–3 miles? Heavy new supply typically softens prices + rents 12–24 months out; constrained supply supports both.
Investment metrics
- 1% rule
- 2.30% ✓
- Cap rate
- 19.78%
- Cash-on-cash
- 48.17%
- DSCR
- 3.14
- GRM
- 3.6
CMA / ARV
- ARV (median comp)
- $73,025
- List price
- $42,500
- Delta
- -41.80%
- Verdict
- UNDERPRICED
- Comps
- 4 within 1.0 mi
Show comp detail 1 sale within ~0.75 mi
| Address | Dist | Beds/Ba | Sqft | Sold | Price | $/sf | Match |
|---|---|---|---|---|---|---|---|
| 125 E Walnut St | 0.22mi | 2/2.0 (+1) | 1,637 (-3%) | 4mo | $17,500 | $11 | 72 |
Match score weights: distance 35% · size 25% · config 20% · recency 20%. Top-matched comps best support the ARV.
Projected returns pro-forma
2.34% appreciation · 3.0% rent growth · sell at horizon
- IRR
- 52.5%
- Equity multiple
- 3.86×
- Total profit
- $34,085
- Equity at exit
- $17,541
- IRR
- 52.8%
- Equity multiple
- 7.77×
- Total profit
- $80,612
- Equity at exit
- $25,870
Cash invested: $11,900 (down + closing). Projections, not guarantees.
Landlord ↔ Tenant lean methodology
- Overall (STATE)
- 43 Moderately Tenant-Leaning
- State Illinois
- 43 Moderately Tenant-Leaning · D+7
- County
- — inherits STATE
- City
- — inherits STATE
ZIP-level market 62474
- Home prices YoY
- 2.5%
- Active inventory
- 4
- Price-to-rent
- 3.6×
Monthly cashflow live
- Estimated rent
- $976 medium interval (Pro) →
- Mortgage (P&I)
- −$223
- Tax from tax record
- −$53 /mo · $638/yr
- Insurance
- −$18
- HOA
- −$0
- Vacancy / Maint / Mgmt
- −$205
- Net cashflow
- $478
Break-even live
UW: 25.0% down · 7.5% · 30yr · 1.5% tax · 5.0% vac · 8.0% maint · 8.0% mgmt
Financing live
Cash to close
- Down payment
- $10,625
- Closing costs
- $1,275
- Reserves months
- —
- Total cash needed
- —
Loan-product check · same deal, 3 products live
Conventional
25% down · 7.5% · 30yr
- Down + closing
- —
- Monthly P&I
- —
- Monthly cashflow
- —
- DSCR
- —
- Eligible?
- —
Personal DTI + credit; lowest rate.
DSCR
20% down · 8.5% · 30yr
- Down + closing
- —
- Monthly P&I
- —
- Monthly cashflow
- —
- DSCR
- —
- Eligible?
- —
No personal income docs; deal must DSCR.
Hard money
10% down · 12.0% · 12mo
- Down + closing
- —
- Monthly P&I
- —
- Monthly cashflow
- —
- DSCR
- —
- Eligible?
- —
Short-term bridge; refi at stabilization.
Listing history 2 events
-
2026-05-04$42,500 Active 662-char remark
-
2003-03-25soldstatus $35,000
ⓘ Source: listings_history table (triggers on properties + properties_extension) + one-shot
backfill from property_details.listing_events for pre-trigger history.
Tax reassessment forecast IL · Partial reset (capped growth)
- Current annual tax
- $638 · $53/mo
- Projected year-2 tax
- $801 · $67/mo
- Expected delta
- +$164/yr (+$14/mo · 25.7%)
ⓘ Screening estimate from a state-policy table — verify with the county assessor before closing.
Climate risk First Street
- Flood 1/10 Low FEMA zone X (unshaded) · 0% chance over 30 yrs
- Wildfire 1/10 Low
- Heat 3/10 Moderate 7 d/yr ≥105°F today · 19 d/yr by 30 yrs out
- Wind 2/10 Low 100% chance of damaging wind over 30 yrs
- Air quality 2/10 Low 1 unhealthy d/yr today · 1 by 30 yrs out
Nearby sold comps map
Loading sold comps map…
Walkable amenities ~0.75 mi
Loading nearby amenities…
Taxation est. · year 1
- Rental income
- $11,718
- − Mortgage interest
- −$2,381
- − Property taxes
- −$638
- − Insurance
- −$212
- − Repairs & maintenance
- −$937
- − Management
- −$937
- − Depreciation
- −$1,236
- Taxable income
- $5,376
- Est. tax owed @ 24.0%
- −$1,290
- After-tax cash flow
- $4,442/yr
For passive investors: Depreciation is non-cash, so a rental often shows a tax loss while cash-flowing — sheltering income. Rental losses are passive: they offset passive income freely, and up to $25,000/yr can offset ordinary (W-2) income if you actively participate and your MAGI is under $100k (phasing out to $0 by $150k); unused losses carry forward. On sale, claimed depreciation is recaptured at up to 25%, and gains may owe capital-gains tax (a 1031 exchange can defer both). Figures are a year-1 estimate at your 24.0% rate — not tax advice; consult a CPA.
Schools (NCES district)
- District
- Casey-Westfield CUSD 4C
- NCES district ID
- 1700002
- Math proficiency
- 19% ▼ -13.00%
- Reading proficiency
- 32% ▼ -12.00%
- Median HH income
- $45,497
- Composite
- 21.99/100
- National rank
- #8208
- State rank
- #322 of 620 in IL
Livability — Westfield
- Score
- 58/100
- State rank
- #1087
- US rank
- #20703
Category grades
Schools grade is shown separately in the Schools card above.
Census & demographics
- Census place
- Westfield, IL
- Population (ZIP)
- 651
Population outlook (Clark County) Hauer SSP2
- Today (2025)
- 14,978 people
- By 2030
- 14,380 · -4.0%
- By 2040
- 13,135 · -12.3%
- By 2050
- 11,920 · -20.4%
- By 2075
- 9,254 · -38.2%
- By 2100
- 6,737 · -55.0%
Race, ethnicity, and origin ACS 2023
- Neighborhood character
- Predominantly White (97%)
- Race & ethnicity
- White 97% Two or more races 3%
- Common ancestry
- Lithuanian 2% Slovak 2% German 1%
- Foreign-born
- 1% · Canada
- Languages at home
- 98% English-only · Spanish 1%
Political lean MEDSL · Clark
- 2024 margin
- Solid R (+51.2) · D 23.5% · R 74.7% · Other 1.8%
- 2008→2024 swing
- -43.2pp toward R · 2008: -8.1pp · 2024: -51.2pp
- All cycles
- 2024: R+51.2 2020: R+50.7 2016: R+47.9 2012: R+32.5 2008: R+8.1
Not yet ingested
- Civics
- —
Market trends
- HPI YoY
- ▲ 2.34%
- Current HPI
- 96.2394
- Rent YoY
- —
- Metro
- —
- State GDP YoY
- ▲ 1.59%
- F500 in state
- 60
Industry mix (Fortune 500 HQ in IL)
| Industry | F500 HQs | Revenue |
|---|---|---|
| Insurance | 4 | $201B |
|
||
| Consumer Goods | 4 | $87B |
|
||
| Industrial Machinery | 3 | $64B |
|
||
| Healthcare | 2 | $55B |
|
||
| Retail / Pharmacy | 1 | $148B |
|
||
| Agriculture / Food | 1 | $86B |
|
||
Price history
+21.4% since first listed3 events — show timeline
- 2026-05-22 Pending — CIBR
- 2026-05-04 Listed $42,500 CIBR
- 2003-03-25 Sold (Public Records) $35,000 Public Records
Property tax history
+4.2%/yrLatest (2024): $638 · +9.9% YoY. Source: county tax records.
Cash-flow waterfall
monthlySold comps — $/sqft
last 12 mo · ≤1 miLoading sold comps…