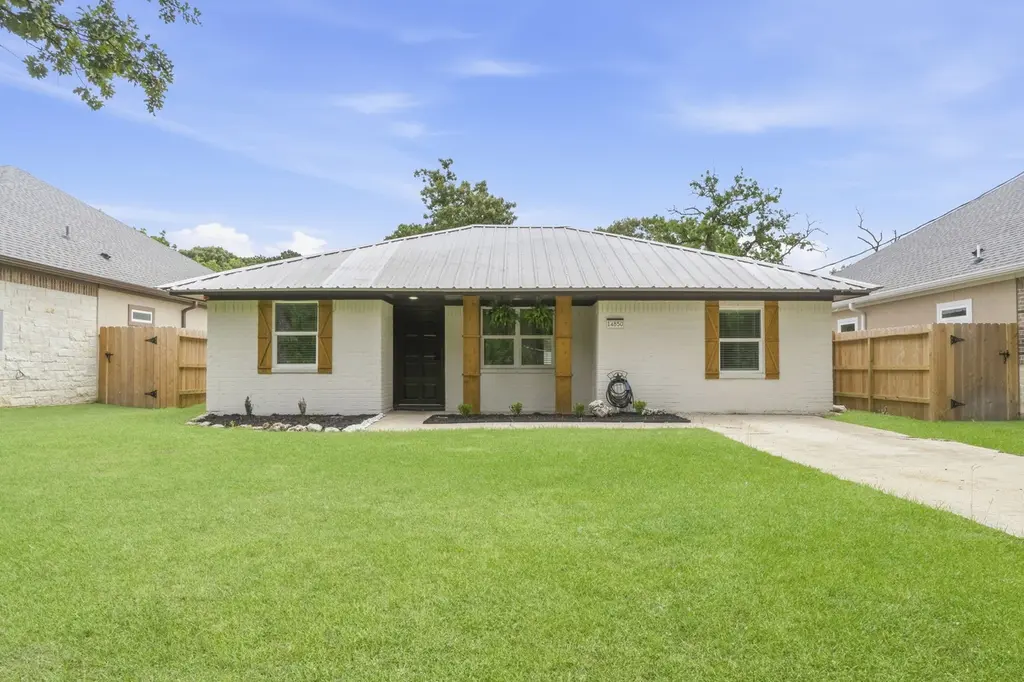
14850 Coaltown Rd · Willis, TX
Flood risk 1/10 · Minimal
- FEMA flood zone
- X (unshaded)
- Chance of flooding over 30 yrs
- 0.0%
- Est. flood insurance / yr
- $507 – $1,088
Fire risk 5/10 · Moderate
- Est. fire insurance / yr
- $1,222 – $2,270
Heat risk 8/10 · Major
- Hot days now (above 111°F)
- 7 days/yr
- Hot days in 30 yrs
- 24 days/yr
Wind risk 8/10 · Major
- Chance of severe wind over 30 yrs
- 99.0%
Air-quality risk 2/10 · Minimal
- Unhealthy air days now
- 1 days/yr
- Unhealthy air days in 30 yrs
- 1 days/yr
Risk factors via First Street. Map © Google.
Why this score? — see what drove the D grade
The composite is a weighted blend of 9 inputs, each scored 0–100. Each bar is that input's sub-score; the figure is the points it added to the 100-point composite (weight × sub-score).
- Cash flow +13.7/30.0
- ARV discount +7.1/15.0
- DSCR +4.1/10.0
- 1% rule +3.7/10.0
- Schools +3.2/10.0
- Livability +3.1/5.0
- Rent growth +2.7/5.0
- Condition / age +2.5/5.0
- Appreciation +0.9/10.0
$230,000
🖨 Deal sheet 📄 Offer letter ✓ Due diligence
Listing remarks
Beautifully remodeled home offering modern style with rustic charm! The inviting front exterior features fresh landscaping, cedar shutters and columns, a durable metal roof, and a spacious fenced yard with plenty of room to enjoy outdoor living. Step inside to an open-concept layout with light wood-look flooring, recessed lighting, neutral paint tones, and abundant natural light throughout. The spacious living area flows seamlessly into the kitchen and dining spaces, creating the perfect setup for entertaining and everyday living. The stylish kitchen features sleek two-tone cabinetry, stainless steel appliances, modern fixtures, ample counter space, and a contemporary design that feels brig
Key facts
- Metal roof
- Fenced yard
- Fresh landscaping
Tags
Property features AI
Finance
- Other:
- Financial info: Lease considered
- HOA & community: Arrowhead Lakes community; Association fee $120 annually
Exterior
- Parking:
- Security: Smoke detector(s)
- Utilities: Public water; Septic tank sewer
- Home design: Residential property; Single-story (first floor entry)
- Construction: Brick and cement siding construction; Metal roof; Slab foundation; Built in 1979
- Exterior features: Deck; Fence (back yard); Porch; Patio; Private yard; Cleared lot in a subdivision; Concrete road surface
Interior
- Kitchen: Dishwasher; Electric cooktop; Electric range; Free-standing range; Microwave; Oven; Refrigerator
- Bedrooms: Primary bedroom (first floor); Bedroom (first floor) — 16x9; Bedroom (first floor) — 9x9; Bedroom (first floor) — 11x9; Bedrooms possible: 4
- Flooring: Carpet; Plank; Vinyl
- Bathrooms: 2 full bathrooms
- Heating & cooling: Central heating (electric); Central air (electric)
- Interior features: Ceiling fan(s)
- Laundry & utility: Washer hookup; Electric dryer hookup; Utility room (first floor) — 5x4
Neighborhood map
What this means for you Summary
Snapshot
- This is a 4-bed/1.5-bath single-family listed at $230k.
Deal economics
- At list price, monthly cash flow is $15 ($182/yr) — positive.
- The deal already cash-flows at list — no discount required.
- To meet the 1% rule (rent ≥ 1% of price), the offer needs to be $200k (13.0% below list).
- Recommended offer: $200k (13.0% below list) — sets the bar for 1% rule.
- Cap rate 6.4% vs local median 4.7% in Willis — top-decile yield for the area; either an underpriced asset or a hidden risk that comps aren't pricing in. Stress-test before assuming the spread holds.
Location & tenants
- Location reads 62/100 on livability (#933 in TX) — a middle-class / working-renter tenant base. Strengths: cost of living A+, housing A+; Watch: crime C-, employment D+, amenities F.
- Willis ISD (rural): math 33% / reading 40% proficiency, ranked #458 of 826 in TX (top 55%) — families likely to look elsewhere, expect single-tenant / working-renter base with shorter leases.
- Zoned schools: Lynn Lucas Middle (math 23% / reading 32%, grade F, #1,156 of 1,662 statewide, top 71%, 971 students, 74% FRL); Willis H S (math 19% / reading 46%, grade F, #1,029 of 1,632 statewide, top 64%, 2,521 students, 57% FRL).
- Market conditions: Rents flat; 710 active listings in the ZIP; 1 comparable units currently listed for rent nearby; 13,259 units permitted in Montgomery County in 2024 (1,402 in 5+ unit buildings).
- This rent runs 34% of the median local income ($71k/yr) — at the standard rent-burdened threshold; future hikes will face affordability resistance.
Forward outlook
- Local home prices are declining (-3.0%/yr); year-one equity from $2k of loan paydown is wiped out by about $7k of value loss. Plan a longer hold.
- Montgomery County population projected at +65% by 2050 — long-run rental-demand tailwind backs the buy-and-hold thesis.
Negotiation context
- It's been on market 37 days — a 3% lower offer ($223k) is reasonable based on typical stale-listing flexibility.
- 12 sale attempts since 20y ago; this cycle's ask is 13043% above the opening price — seller raised mid-cycle; expect resistance to lowballs.
Risks & watch-outs
- Climate carrying-cost: severe wind risk, 99% chance of damaging wind over 30y; moderate wildfire risk; extreme-heat days projected 7→24/yr by 2055 (HVAC capex compounding) — expect insurance premiums to compound above CPI over the hold.
Questions for the listing agent
- It's been on market 37 days. Have you received any prior offers? Is the seller open to a 13% concession, seller financing, or rate buy-down credit?
- Built in 1979 — when were the roof, HVAC, electrical panel, plumbing, and water heater last replaced?
- What does the HOA fee cover, when was the last increase, and are there any pending special assessments or reserve-fund shortfalls?
- Is there a deadline driving the sale (1031 exchange, divorce, estate, relocation)? That informs how much negotiation room exists.
- Schools are D-rated, which usually means shorter tenancies and higher turnover. Who's the typical renter profile here, and what's been the actual vacancy rate?
- The area grade is low — what's the realistic commute time and amenity access for the typical tenant pool here? Any planned neighborhood developments (good or bad) we should know about?
- What's the average days-on-market for RENTAL listings here right now (not sales)? A rising rental-DOM trend means longer vacancies and softer asking-rent achievability than the comps imply.
- What's the recent tenant-quality profile in this submarket — average credit score on applications, eviction rate, late-payment / NSF rate, and stable-employment percentage? A property-management company in the area should have these aggregated.
- How much new for-sale + rental construction is in the pipeline within 1–3 miles? Heavy new supply typically softens prices + rents 12–24 months out; constrained supply supports both.
Investment metrics
- 1% rule
- 0.87% ✗
- Cap rate
- 6.37%
- Cash-on-cash
- 0.28%
- DSCR
- 1.01
- GRM
- 9.6
CMA / ARV
- ARV (median comp)
- $228,219
- List price
- $230,000
- Delta
- 0.78%
- Verdict
- FAIR
- Comps
- 20 within 1.0 mi
Show comp detail 12 sales within ~0.75 mi
| Address | Dist | Beds/Ba | Sqft | Sold | Price | $/sf | Match |
|---|---|---|---|---|---|---|---|
| 14882 Big Springs Cir | 0.09mi | 3/2.0 (-1) | 1,341 (-5%) | 4mo | $228,888 | $171 | 77 |
| 3435 Sam Houston Rd | 0.35mi | 3/2.0 (-1) | 1,378 (-2%) | 5mo | $250,000 | $181 | 69 |
| 15119 Arrowhead Loop Rd E | 0.30mi | 3/2.0 (-1) | 1,300 (-8%) | 3mo | $232,600 | $179 | 63 |
| 116 Indian Creek Cir | 0.27mi | 3/2.0 (-1) | 1,301 (-8%) | 8mo | $232,000 | $178 | 61 |
| 15113 Austin | 0.60mi | 3/2.0 (-1) | 1,383 (-2%) | 1mo | $239,900 | $173 | 61 |
| 14962 Indian Hill Trl | 0.43mi | 3/2.0 (-1) | 1,500 (+6%) | 4mo | $268,000 | $179 | 60 |
| 115 Indian Creek Cir | 0.24mi | 3/2.0 (-1) | 1,250 (-12%) | 6mo | $217,000 | $174 | 57 |
| 3975 Sam Houston Rd | 0.59mi | 3/2.5 (-1) | 1,341 (-5%) | 1mo | $219,600 | $164 | 54 |
| 15123 Arrowhead Loop E | 0.30mi | 3/2.0 (-1) | 1,200 (-15%) | 1mo | $218,800 | $182 | 53 |
| 2442 Mohawk Bnd | 0.52mi | 3/2.0 (-1) | 1,303 (-8%) | 4mo | $229,900 | $176 | 53 |
| 15451 Arrowhead Loop Dr W | 0.55mi | 3/2.5 (-1) | 1,324 (-6%) | 3mo | $219,900 | $166 | 52 |
| 3507 Sam Houston Rd | 0.41mi | 3/2.0 (-1) | 1,230 (-13%) | 1mo | $219,999 | $179 | 52 |
Match score weights: distance 35% · size 25% · config 20% · recency 20%. Top-matched comps best support the ARV.
Projected returns pro-forma
-3.0% appreciation · 0.98% rent growth · sell at horizon
- IRR
- -18.1%
- Equity multiple
- 0.37×
- Total profit
- $-40,272
- Equity at exit
- $34,294
- IRR
- -14.8%
- Equity multiple
- 0.23×
- Total profit
- $-49,463
- Equity at exit
- $19,886
Cash invested: $64,400 (down + closing). Projections, not guarantees.
Landlord ↔ Tenant lean methodology
- Overall (STATE)
- 87 Strongly Landlord-Friendly
- State Texas
- 87 Strongly Landlord-Friendly · R+5
- County
- — inherits STATE
- City
- — inherits STATE
ZIP-level market 77378
- Home prices YoY
- -3.0%
- Rents YoY
- 1.0%
- Active inventory
- 710
- Price-to-rent
- 9.6×
Monthly cashflow live
- Estimated rent
- $2,000 medium interval (Pro) →
- Mortgage (P&I)
- −$1,206
- Tax from tax record
- −$253 /mo · $3,035/yr
- Insurance
- −$96
- HOA
- −$10
- Vacancy / Maint / Mgmt
- −$420
- Net cashflow
- $15
Break-even live
UW: 25.0% down · 7.5% · 30yr · 1.5% tax · 5.0% vac · 8.0% maint · 8.0% mgmt
Financing live
Cash to close
- Down payment
- $57,500
- Closing costs
- $6,900
- Reserves months
- —
- Total cash needed
- —
Loan-product check · same deal, 3 products live
Conventional
25% down · 7.5% · 30yr
- Down + closing
- —
- Monthly P&I
- —
- Monthly cashflow
- —
- DSCR
- —
- Eligible?
- —
Personal DTI + credit; lowest rate.
DSCR
20% down · 8.5% · 30yr
- Down + closing
- —
- Monthly P&I
- —
- Monthly cashflow
- —
- DSCR
- —
- Eligible?
- —
No personal income docs; deal must DSCR.
Hard money
10% down · 12.0% · 12mo
- Down + closing
- —
- Monthly P&I
- —
- Monthly cashflow
- —
- DSCR
- —
- Eligible?
- —
Short-term bridge; refi at stabilization.
Rent comps 1 comps
| Address | Beds | Baths | Sqft | Rent | $/sqft | DOM | Units | Dist |
|---|---|---|---|---|---|---|---|---|
| 15309 Coaltown Rd Willis, TX | 3.0 | 2.0 | 1200 | $1,445 | $1.20 | 24d | 1 | 0.36mi |
HOA detail
- Monthly dues
- $10 · $120/yr
- Likely covers
- landscaping
Listing history 48 events
-
2026-06-18days on market $230,000 Active 37 DOM
-
2026-06-17days on market $230,000 Active 36 DOM
-
2026-06-16days on market $230,000 Active 35 DOM
-
2026-06-15days on market $230,000 Active 34 DOM
-
2026-06-13days on market $230,000 Active 32 DOM
-
2026-06-09days on market $230,000 Active 28 DOM
-
2026-06-08days on market $230,000 Active 27 DOM
-
2026-06-07days on market $230,000 Active 26 DOM
-
2026-06-04days on market $230,000 Active 23 DOM
-
2026-06-03days on market $230,000 Active 22 DOM
-
2026-06-02days on market $230,000 Active 21 DOM
-
2026-06-01days on market $230,000 Active 20 DOM
-
2026-05-31days on market $230,000 Active 19 DOM
-
2026-05-14$1,750
-
2026-05-12$230,000 Active 912-char remark
-
2024-02-03historical $1,550
-
2024-02-02historical
-
2024-01-19$1,550
-
2023-11-17price $239,500
-
2023-10-29price $244,900
-
2023-10-16$249,900 Active
-
2023-10-16historical
-
2023-09-27price $260,000
-
2023-09-08$267,000 Active
-
2023-02-28soldstatus Sold
-
2023-02-13status Pending
-
2023-02-03status Option Pending
-
2023-01-23price $175,000
-
2022-12-14price $184,900
-
2022-09-29$188,000 Active
-
2022-08-04soldstatus
-
2016-06-15soldstatus
-
2016-06-14soldstatus Sold
-
2016-04-21status Pending
-
2016-04-15status Option Pending
-
2016-04-08$124,900 Active
-
2015-11-20soldstatus Sold
-
2015-11-02status Pending
-
2015-10-12$56,100 Active
-
2008-05-12historical
-
2008-04-17$79,500
-
2008-03-23historical
-
2007-04-23$79,500
-
2007-04-01historical
-
2006-11-29$98,500
-
2006-04-28$129,500
-
2006-04-01historical
-
1997-07-03soldstatus
ⓘ Source: listings_history table (triggers on properties + properties_extension) + one-shot
backfill from property_details.listing_events for pre-trigger history.
Tax reassessment forecast TX · Resets to sale price
- Current annual tax
- $3,035 · $253/mo
- Projected year-2 tax
- $4,209 · $351/mo
- Expected delta
- +$1,174/yr (+$98/mo · 38.7%)
ⓘ Screening estimate from a state-policy table — verify with the county assessor before closing.
Climate risk First Street
- Flood 1/10 Low FEMA zone X (unshaded) · 0% chance over 30 yrs
- Wildfire 5/10 Major
- Heat 8/10 Severe 7 d/yr ≥111°F today · 24 d/yr by 30 yrs out
- Wind 8/10 Severe 99% chance of damaging wind over 30 yrs
- Air quality 2/10 Low 1 unhealthy d/yr today · 1 by 30 yrs out
Nearby sold comps map
Loading sold comps map…
Walkable amenities ~0.75 mi
Loading nearby amenities…
Taxation est. · year 1
- Rental income
- $24,002
- − Mortgage interest
- −$12,884
- − Property taxes
- −$3,035
- − Insurance
- −$1,150
- − Repairs & maintenance
- −$1,920
- − Management
- −$1,920
- − HOA
- −$120
- − Depreciation
- −$6,691
- Taxable loss
- −$3,718
- Est. tax savings @ 24.0%
- +$892
- After-tax cash flow
- $1,075/yr
For passive investors: Depreciation is non-cash, so a rental often shows a tax loss while cash-flowing — sheltering income. Rental losses are passive: they offset passive income freely, and up to $25,000/yr can offset ordinary (W-2) income if you actively participate and your MAGI is under $100k (phasing out to $0 by $150k); unused losses carry forward. On sale, claimed depreciation is recaptured at up to 25%, and gains may owe capital-gains tax (a 1031 exchange can defer both). Figures are a year-1 estimate at your 24.0% rate — not tax advice; consult a CPA.
Schools (NCES district)
- District
- Willis ISD
- NCES district ID
- 4845900
- Math proficiency
- 33% ▼ -15.00%
- Reading proficiency
- 40% ▼ -2.00%
- Median HH income
- $57,828
- Composite
- 32.32/100
- National rank
- #5746
- State rank
- #458 of 826 in TX
Livability — Willis
- Score
- 62/100
- State rank
- #933
- US rank
- #16579
Category grades
Schools grade is shown separately in the Schools card above.
Census & demographics
- County
- Montgomery County · 663,713 people
- City population
- 38,421
- Metro
- Houston-The Woodlands-Sugar Land, TX
- Population (ZIP)
- 17,629
- Household income
- $71,143
- Rent vs Own
- Severe rent burden
- 402.0
Population outlook (Montgomery County) Hauer SSP2
- Today (2025)
- 713,896 people
- By 2030
- 805,263 · +12.8%
- By 2040
- 992,708 · +39.1%
- By 2050
- 1,179,590 · +65.2%
- By 2075
- 1,628,084 · +128.1%
- By 2100
- 1,937,880 · +171.5%
Race, ethnicity, and origin ACS 2023
- Neighborhood character
- Diverse neighborhood (Simpson 0.55)
- Race & ethnicity
- White 58% Hispanic / Latino 32% Two or more races 14% Black 7% Native American 1%
- Hispanic origin (detail)
- Mexican 27%
- Common ancestry
- Romanian 2% Slovak 2% Serbian 1%
- Foreign-born
- 12% · Canada
- Languages at home
- 80% English-only · Spanish 19%
Political lean MEDSL · Montgomery
- 2024 margin
- Solid R (+45.5) · D 26.8% · R 72.3%
- 2008→2024 swing
- +7.2pp toward D · 2008: -52.7pp · 2024: -45.5pp
- All cycles
- 2024: R+45.5 2020: R+43.8 2016: R+51.4 2012: R+60.7 2008: R+52.7
Not yet ingested
- Civics
- —
Market trends
- HPI YoY
- ▼ -8.25%
- Current HPI
- 261.9673
- Rent YoY
- ▲ 0.98%
- Metro
- Houston-The Woodlands-Sugar Land, TX
- State GDP YoY
- ▲ 3.95%
- F500 in state
- 110
Industry mix (Fortune 500 HQ in TX)
| Industry | F500 HQs | Revenue |
|---|---|---|
| Energy | 16 | $1,198B |
|
||
| Technology | 5 | $198B |
|
||
| Engineering / Construction | 4 | $72B |
|
||
| Energy Services | 3 | $60B |
|
||
| Utilities | 3 | $41B |
|
||
| Healthcare | 2 | $330B |
|
||
Price history
-98.6% since first listed35 events — show timeline
- 2026-05-14 Listed for Rent $1,750 HARMLS
- 2026-05-12 Listed $230,000 HARMLS
- 2024-02-03 Rental Removed $1,550 HARMLS
- 2024-02-02 Listing Removed — HARMLS
- 2024-01-19 Listed for Rent $1,550 HARMLS
- 2023-11-17 Price Changed $239,500 HARMLS
- 2023-10-29 Price Changed $244,900 HARMLS
- 2023-10-16 Listing Removed — HARMLS
- 2023-10-16 Listed $249,900 HARMLS
- 2023-09-27 Price Changed $260,000 HARMLS
- 2023-09-08 Listed $267,000 HARMLS
- 2023-02-28 Sold (MLS) — HARMLS
- 2023-02-13 Pending — HARMLS
- 2023-02-03 Pending — HARMLS
- 2023-01-23 Price Changed $175,000 HARMLS
- 2022-12-14 Price Changed $184,900 HARMLS
- 2022-09-29 Listed $188,000 HARMLS
- 2022-08-04 Sold (Public Records) — Public Records
- 2016-06-15 Sold (Public Records) — Public Records
- 2016-06-14 Sold (MLS) — HARMLS
- 2016-04-21 Pending — HARMLS
- 2016-04-15 Pending — HARMLS
- 2016-04-08 Listed $124,900 HARMLS
- 2015-11-20 Sold (MLS) — HARMLS
- 2015-11-02 Pending — HARMLS
- 2015-10-12 Listed $56,100 HARMLS
- 2008-05-12 Listing Removed — HARMLS
- 2008-04-17 Listed $79,500 HARMLS
- 2008-03-23 Listing Removed — HARMLS
- 2007-04-23 Listed $79,500 HARMLS
- 2007-04-01 Listing Removed — HARMLS
- 2006-11-29 Listed $98,500 HARMLS
- 2006-04-28 Listed $129,500 HARMLS
- 2006-04-01 Listing Removed — HARMLS
- 1997-07-03 Sold (Public Records) — Public Records
Property tax history
+6.2%/yrLatest (2025): $3,035 · +5.8% YoY. Source: county tax records.
Cash-flow waterfall
monthlySold comps — $/sqft
last 12 mo · ≤1 miLoading sold comps…