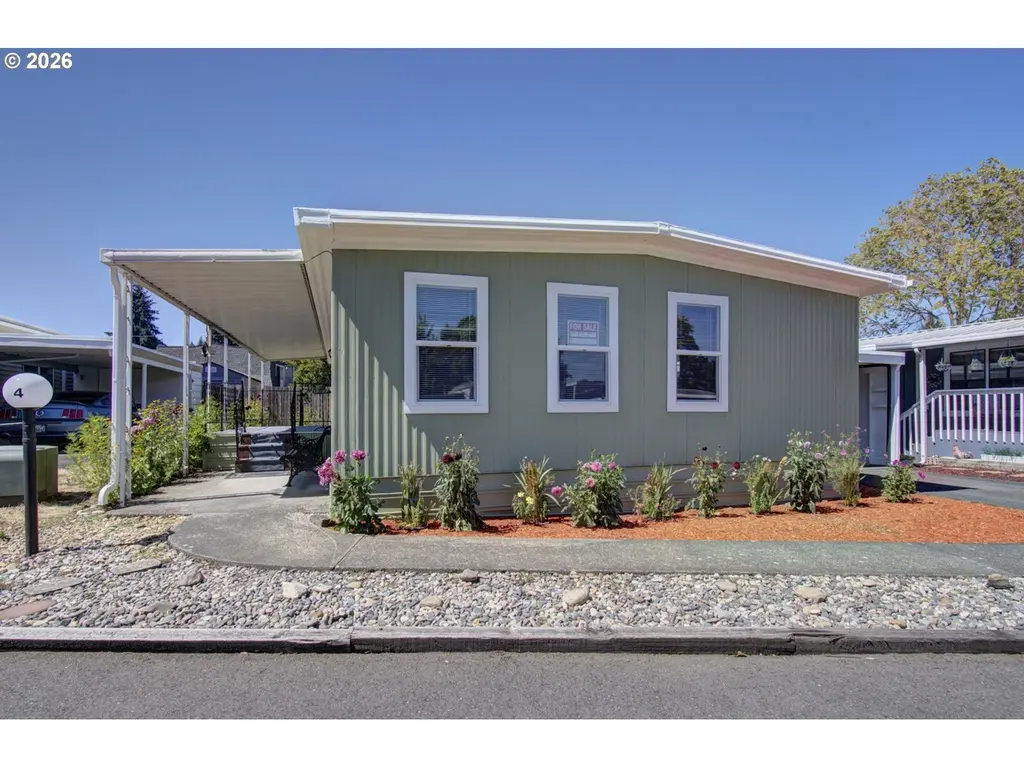
3909 E Fourth Plain Blvd #4 · Vancouver, WA
Flood risk No data
- FEMA flood zone
- —
- Chance of flooding over 30 yrs
- —
- Est. flood insurance / yr
- —
Fire risk No data
- Est. fire insurance / yr
- —
Heat risk No data
- Hot days now (above threshold)
- —
- Hot days in 30 yrs
- —
Wind risk No data
- Chance of severe wind over 30 yrs
- —
Air-quality risk No data
- Unhealthy air days now
- —
- Unhealthy air days in 30 yrs
- —
Risk factors via First Street. Map © Google.
Why this score? — see what drove the C- grade
The composite is a weighted blend of 9 inputs, each scored 0–100. Each bar is that input's sub-score; the figure is the points it added to the 100-point composite (weight × sub-score).
- Cash flow +18.0/30.0
- ARV discount +7.5/15.0
- DSCR +5.7/10.0
- 1% rule +4.8/10.0
- Schools +4.3/10.0
- Livability +4.1/5.0
- Rent growth +3.0/5.0
- Condition / age +2.5/5.0
- Appreciation +0.0/10.0
$170,000
🖨 Deal sheet (PDF) 📄 Offer letter ✓ Due diligence
Listing remarks MLS
Discover a charming 2 bed, 2 bath home in vibrant Vancouver, WA. Spanning 1,152 sq ft, this cozy manufactured home is updated with modern LVP flooring and fresh paint throughout. The kitchen delights with an updated design, tile backsplash, and a new dishwasher. Enjoy comfort year-round with a newer furnace, heat pump, and windows. Outdoors, a large fenced backyard and a covered patio offer private relaxation or entertaining space. Additionally, there's a 16x10 shop for hobbies or storage. With rent at $650 a month, water, sewer, and trash are included, and pets are welcome. This delightful home is situated in a 55+ community with no HOA fees, conveniently close to shopping centers, schools, and major freeways like 205 and I-5. Downtown Vancouver and Vancouver Mall are nearby for added convenience.
Key facts
- Newer furnace
- Heat pump
- Modern lvp flooring
Tags
Neighborhood map
What this means for you Summary
Snapshot
- This is a 2-bed/2.0-bath manufactured listed at $170k.
Deal economics
- At list price, monthly cash flow is $148 ($2k/yr) — positive.
- The deal already cash-flows at list — no discount required.
- To meet the 1% rule (rent ≥ 1% of price), the offer needs to be $167k (1.5% below list).
- Recommended offer: $155k (9.0% below list) — sets the bar for market timing.
- Cap rate 7.3% vs local median 2.7% in Vancouver — top-decile yield for the area; either an underpriced asset or a hidden risk that comps aren't pricing in. Stress-test before assuming the spread holds.
Location & tenants
- Location reads 82/100 on livability (#62 in WA, #1,133 nationally) — a professional / high-income tenant draw. Strengths: amenities A+, commute A+, housing A+; Watch: crime F, cost of living D-.
- Vancouver School District (suburban): math 43% / reading 53% proficiency, ranked #156 of 291 in WA (top 54%) — families likely to look elsewhere, expect single-tenant / working-renter base with shorter leases.
- Zoned schools: Martin Luther King Elementary (433 students, 76% FRL); Mcloughlin Middle School (911 students, 84% FRL); Fort Vancouver High School (1,547 students, 76% FRL) — zoned schools average 79% FRL vs 44% district-wide (34 pts higher); higher-poverty schools than district average — tighter screening recommended.
- Market conditions: Rents rising (+2.0%/yr); 270 active listings in the ZIP; 40 comparable units currently listed for rent nearby; rentals at typical pace (median 16d on market — plan ~3-4 weeks tenant-placement turnaround); solid renter incomes; 3,547 units permitted in Clark County in 2024 (1,361 in 5+ unit buildings).
Forward outlook
- Local home prices are declining (-3.0%/yr); year-one equity from $1k of loan paydown is wiped out by about $5k of value loss. Plan a longer hold.
- Clark County population projected at +29% by 2050 — long-run rental-demand tailwind backs the buy-and-hold thesis.
Negotiation context
- It's been on market 110 days — a 9% lower offer ($155k) is reasonable based on typical stale-listing flexibility.
Questions for the listing agent
- It's been on market 110 days. Have you received any prior offers? Is the seller open to a 9% concession, seller financing, or rate buy-down credit?
- Built in 1971 — when were the roof, HVAC, electrical panel, plumbing, and water heater last replaced?
- Why hasn't it sold? Are there any deal-killer items the seller is aware of (foundation, flood, title, zoning, code violations)?
- Is there a deadline driving the sale (1031 exchange, divorce, estate, relocation)? That informs how much negotiation room exists.
- Crime grade is F in this area — have there been break-ins, vandalism, or insurance claims at this property in the last 3 years? What carrier currently insures it and at what premium?
- What's the average days-on-market for RENTAL listings here right now (not sales)? A rising rental-DOM trend means longer vacancies and softer asking-rent achievability than the comps imply.
- What's the recent tenant-quality profile in this submarket — average credit score on applications, eviction rate, late-payment / NSF rate, and stable-employment percentage? A property-management company in the area should have these aggregated.
- How much new for-sale + rental construction is in the pipeline within 1–3 miles? Heavy new supply typically softens prices + rents 12–24 months out; constrained supply supports both.
Investment metrics
- 1% rule
- 0.98% ✗
- Cap rate
- 7.34%
- Cash-on-cash
- 3.72%
- DSCR
- 1.17
- GRM
- 8.5
CMA / ARV
- ARV (median comp)
- $81,979
- List price
- $170,000
- Delta
- 107.37%
- Verdict
- OVERPRICED
- Comps
- 3 within 1.0 mi
Show comp detail 1 sale within ~0.75 mi
| Address | Dist | Beds/Ba | Sqft | Sold | Price | $/sf | Match |
|---|---|---|---|---|---|---|---|
| 3921 E Fourth Plain Blvd #53 | 0.06mi | 3/2.0 (+1) | 1,020 (-12%) | 2mo | $162,000 | $159 | 72 |
Match score weights: distance 35% · size 25% · config 20% · recency 20%. Top-matched comps best support the ARV.
Projected returns pro-forma
-3.0% appreciation · 2.05% rent growth · sell at horizon
- IRR
- -11.5%
- Equity multiple
- 0.59×
- Total profit
- $-19,705
- Equity at exit
- $25,348
- IRR
- -3.7%
- Equity multiple
- 0.76×
- Total profit
- $-11,330
- Equity at exit
- $14,698
Cash invested: $47,600 (down + closing). Projections, not guarantees.
Landlord ↔ Tenant lean methodology
- Overall (STATE)
- 28 Tenant-Leaning
- State Washington
- 28 Tenant-Leaning · D+8
- County
- — inherits STATE
- City
- — inherits STATE
ZIP-level market 98661
- Rents YoY
- 2.0%
- Active inventory
- 270
- Price-to-rent
- 8.5×
Monthly cashflow live
- Estimated rent
- $1,674 high interval (Pro) →
- Mortgage (P&I)
- −$891
- Tax est. 1.5%
- −$212 /mo · $2,550/yr
- Insurance
- −$71
- HOA
- −$0
- Vacancy / Maint / Mgmt
- −$352
- Net cashflow
- $148
Break-even live
Sensitivity live
| Price | -10% $265 | -5% $206 | +0% $148 | +5% $89 | +10% $30 |
|---|---|---|---|---|---|
| Rent | -10% $15 | -5% $82 | +0% $148 | +5% $214 | +10% $280 |
| Rate | -1.0pp $233 | -0.5pp $191 | base $148 | +0.5pp $104 | +1.0pp $59 |
UW: 25.0% down · 7.5% · 30yr · 1.5% tax · 5.0% vac · 8.0% maint · 8.0% mgmt
Financing live
Cash to close
- Down payment
- $42,500
- Closing costs
- $5,100
- Reserves months
- —
- Total cash needed
- —
Loan-product check · same deal, 3 products live
Conventional
25% down · 7.5% · 30yr
- Down + closing
- —
- Monthly P&I
- —
- Monthly cashflow
- —
- DSCR
- —
- Eligible?
- —
Personal DTI + credit; lowest rate.
DSCR
20% down · 8.5% · 30yr
- Down + closing
- —
- Monthly P&I
- —
- Monthly cashflow
- —
- DSCR
- —
- Eligible?
- —
No personal income docs; deal must DSCR.
Hard money
10% down · 12.0% · 12mo
- Down + closing
- —
- Monthly P&I
- —
- Monthly cashflow
- —
- DSCR
- —
- Eligible?
- —
Short-term bridge; refi at stabilization.
Rent comps 40 comps
| Address | Beds | Baths | Sqft | Rent | $/sqft | DOM | Units | Dist |
|---|---|---|---|---|---|---|---|---|
| 3700 E Fourth Plain Blvd Vancouver, WA | 2.0 | 1.0 | 700 | $1,409 | $2.01 | 9d | 1 | 0.18mi |
| 3903 E 18th St #13 Vancouver, WA | 2.0 | 1.0 | 900 | $1,495 | $1.66 | 23d | 1 | 0.23mi |
| 1604 Bryant St #13 Vancouver, WA | 2.0 | 1.0 | 780 | $1,475 | $1.89 | 25d | 1 | 0.26mi |
| 4325 E 17th St Unit 1 Vancouver, WA | 2.0 | 1.0 | 700 | $1,489 | $2.13 | 14d | 1 | 0.29mi |
| 2478 Rossiter Ln Vancouver, WA | 2.0–3.0 | 1.0–1.5 | 1100 | $1,749 | $1.59 | 4d | 6 | 0.29mi |
| 4012 E 16th St Unit A Vancouver, WA | 2.0 | 1.0 | 950 | $1,350 | $1.42 | 21d | 1 | 0.31mi |
| 3911 Plomondon St Vancouver, WA | 2.0 | 1.5 | 900 | $1,795 | $1.99 | 25d | 1 | 0.33mi |
| 4706 Sheridan Dr Vancouver, WA | 3.0 | 1.0 | 1000 | $2,300 | $2.30 | 4d | 1 | 0.33mi |
| 3408 E 18th St Unit 3408-J Vancouver, WA | 2.0 | 1.0 | 830 | $1,695 | $2.04 | 25d | 1 | 0.34mi |
| 3408 E 18th St Unit J Vancouver, WA | 2.0 | 1.0 | 830 | $1,695 | $2.04 | 23d | 1 | 0.34mi |
| 2920 Falk Rd Vancouver, WA | 2.0–3.0 | 2.5–3.0 | 1268 | $2,375 | $1.87 | 0d | 1 | 0.38mi |
| 3311 E 21st St Apt 12 Vancouver, WA | 2.0 | 1.0 | 825 | $1,200 | $1.45 | 19d | 1 | 0.39mi |
| 3308 E 24th Cir Vancouver, WA | 1.0 | 1.0 | 700 | $1,795 | $2.56 | 19d | 1 | 0.40mi |
| 2615 Neals Ln Vancouver, WA | 2.0 | 1.0 | 850 | $1,390 | $1.64 | 4d | 1 | 0.40mi |
| 2815 Caples Ave Unit 1 Vancouver, WA | 2.0 | 1.0 | 814 | $1,695 | $2.08 | 16d | 1 | 0.40mi |
| 4402 Gibbons St Unit 1 Vancouver, WA | 2.0 | 1.0 | 890 | $1,649 | $1.85 | 25d | 1 | 0.41mi |
| 4601 E 18th St Vancouver, WA | 1.0–3.0 | 1.0–2.0 | 1010 | $1,734 | $1.72 | 0d | 12 | 0.43mi |
| 2900 General Anderson Ave Vancouver, WA | 1.0–3.0 | 1.0–2.0 | 880 | $1,591 | $1.81 | 0d | 4 | 0.43mi |
| 3306 E 18th St Unit WA3304-1 Vancouver, WA | 3.0 | 2.0 | 1150 | $1,825 | $1.59 | 25d | 1 | 0.43mi |
| 2817 Neals Ln Vancouver, WA | 2.0 | 1.0 | 900 | $1,275 | $1.42 | 25d | 1 | 0.44mi |
| 2009 Norris Rd Unit 6 Vancouver, WA | 2.0 | 1.0 | 850 | $1,295 | $1.52 | 25d | 1 | 0.44mi |
| 4420 Gibbons St Unit B Vancouver, WA | 2.0 | 1.0 | 900 | $1,395 | $1.55 | 14d | 1 | 0.44mi |
| 3100 Falk Rd Vancouver, WA | 2.0–3.0 | 2.0–3.0 | 1234 | $1,649 | $1.34 | 3d | 4 | 0.47mi |
| 2212 Carlson Rd Vancouver, WA | 2.0 | 1.0 | 780 | $1,420 | $1.82 | 12d | 1 | 0.48mi |
| 3622 E 13th St Vancouver, WA | 2.0 | 1.0 | 800 | $1,700 | $2.12 | 21d | 1 | 0.50mi |
| 1530 Ash St Vancouver, WA | 2.0 | 1.5 | 1020 | $1,450 | $1.42 | 16d | 1 | 0.54mi |
| 3212 E 13th St Unit 3214-2 Vancouver, WA | 2.0 | 1.0 | 952 | $1,595 | $1.68 | 25d | 1 | 0.62mi |
| 2815 E 19th St Unit D Vancouver, WA | 2.0 | 1.0 | 850 | $1,395 | $1.64 | 25d | 1 | 0.63mi |
| 2815 E 19th St Apt Q Vancouver, WA | 2.0 | 1.0 | 850 | $1,395 | $1.64 | 23d | 1 | 0.63mi |
| 4918 Plomondon St Vancouver, WA | 2.0 | 2.0 | 1000 | $1,695 | $1.70 | 9d | 1 | 0.63mi |
| 4500 Nicholson Rd Vancouver, WA | 2.0–3.0 | 2.0 | 1034 | $1,538 | $1.49 | 0d | 7 | 0.66mi |
| NE 47 NE 47th Ct Vancouver, WA | 3.0 | 2.5 | 1475 | $2,850 | $1.93 | 3d | 5 | 0.66mi |
| 5301 Plomondon St Unit A6 Vancouver, WA | 2.0 | 2.5 | 1491 | $1,995 | $1.34 | 23d | 1 | 0.67mi |
| 4316 NE 34th Cir Vancouver, WA | 3.0 | 2.5 | 1482 | $2,450 | $1.65 | 0d | 1 | 0.70mi |
| 4316 NE 34th Cir Vancouver, WA | 3.0 | 2.5 | 1482 | $2,450 | $1.65 | 3d | 1 | 0.70mi |
| 5500 NE Fourth Plain Blvd Vancouver, WA | 1.0–2.0 | 1.0–2.0 | 768 | $1,659 | $2.16 | 4d | 4 | 0.73mi |
| 3011 Fairmount Ave Unit 3011 Vancouver, WA | 2.0 | 1.0 | 1000 | $1,725 | $1.73 | 25d | 1 | 0.74mi |
| 5203 Ogden Ct Unit B Vancouver, WA | 2.0 | 2.0 | 1118 | $1,999 | $1.79 | 9d | 1 | 0.75mi |
| 5203 Ogden Ct Unit B Vancouver, WA | 2.0 | 2.0 | 1118 | $1,999 | $1.79 | 0d | 1 | 0.75mi |
| 3218 Edgewood Dr Unit 3224 D Vancouver, WA | 2.0 | 1.0 | 890 | $1,495 | $1.68 | 25d | 1 | 0.76mi |
Listing history 15 events
-
2026-06-21days on market $170,000 Active 110 DOM
-
2026-06-18days on market $170,000 Active 107 DOM
-
2026-06-17days on market $170,000 Active 106 DOM
-
2026-06-16days on market $170,000 Active 105 DOM
-
2026-06-15days on market $170,000 Active 104 DOM
-
2026-06-13days on market $170,000 Active 102 DOM
-
2026-06-09days on market $170,000 Active 98 DOM
-
2026-06-08days on market $170,000 Active 97 DOM
-
2026-06-07days on market $170,000 Active 96 DOM
-
2026-06-03days on market $170,000 Active 92 DOM
-
2026-06-02days on market $170,000 Active 91 DOM
-
2026-06-01days on market $170,000 Active 90 DOM
-
2026-05-31days on market $170,000 Active 89 DOM
-
2026-05-19price $170,000 809-char remark
Show marketing remark (809 chars)
Discover a charming 2 bed, 2 bath home in vibrant Vancouver, WA. Spanning 1,152 sq ft, this cozy manufactured home is updated with modern LVP flooring and fresh paint throughout. The kitchen delights with an updated design, tile backsplash, and a new dishwasher. Enjoy comfort year-round with a newer furnace, heat pump, and windows. Outdoors, a large fenced backyard and a covered patio offer private relaxation or entertaining space. Additionally, there's a 16x10 shop for hobbies or storage. With rent at $650 a month, water, sewer, and trash are included, and pets are welcome. This delightful home is situated in a 55+ community with no HOA fees, conveniently close to shopping centers, schools, and major freeways like 205 and I-5. Downtown Vancouver and Vancouver Mall are nearby for added convenience.
-
2026-03-01$175,000 Active 809-char remark
Show marketing remark (809 chars)
Discover a charming 2 bed, 2 bath home in vibrant Vancouver, WA. Spanning 1,152 sq ft, this cozy manufactured home is updated with modern LVP flooring and fresh paint throughout. The kitchen delights with an updated design, tile backsplash, and a new dishwasher. Enjoy comfort year-round with a newer furnace, heat pump, and windows. Outdoors, a large fenced backyard and a covered patio offer private relaxation or entertaining space. Additionally, there's a 16x10 shop for hobbies or storage. With rent at $650 a month, water, sewer, and trash are included, and pets are welcome. This delightful home is situated in a 55+ community with no HOA fees, conveniently close to shopping centers, schools, and major freeways like 205 and I-5. Downtown Vancouver and Vancouver Mall are nearby for added convenience.
ⓘ Source: listings_history table (triggers on properties + properties_extension) + one-shot
backfill from property_details.listing_events for pre-trigger history.
Nearby sold comps map
Loading sold comps map…
Walkable amenities ~0.75 mi
Loading nearby amenities…
Taxation est. · year 1
- Rental income
- $20,088
- − Mortgage interest
- −$9,523
- − Property taxes
- −$2,550
- − Insurance
- −$850
- − Repairs & maintenance
- −$1,607
- − Management
- −$1,607
- − Depreciation
- −$4,945
- Taxable loss
- −$994
- Est. tax savings @ 24.0%
- +$239
- After-tax cash flow
- $2,010/yr
For passive investors: Depreciation is non-cash, so a rental often shows a tax loss while cash-flowing — sheltering income. Rental losses are passive: they offset passive income freely, and up to $25,000/yr can offset ordinary (W-2) income if you actively participate and your MAGI is under $100k (phasing out to $0 by $150k); unused losses carry forward. On sale, claimed depreciation is recaptured at up to 25%, and gains may owe capital-gains tax (a 1031 exchange can defer both). Figures are a year-1 estimate at your 24.0% rate — not tax advice; consult a CPA.
Schools (NCES district)
- District
- Vancouver School District
- NCES district ID
- 5309270
- Math proficiency
- 43% ▬ 0.00%
- Reading proficiency
- 53% ▬ 0.00%
- Median HH income
- $52,562
- Composite
- 43.45/100
- National rank
- #6479
- State rank
- #156 of 291 in WA
Livability — Vancouver
- Score
- 82/100
- State rank
- #62
- US rank
- #1133
Category grades
Schools grade is shown separately in the Schools card above.
Census & demographics
- Census place
- Vancouver, WA
- County
- Clark County · 513,189 people
- City population
- 360,195
- Metro
- Portland-Vancouver-Hillsboro, OR-WA
- Population (ZIP)
- 50,743
- Household income
- $76,913
- Rent vs Own
- Severe rent burden
- 2384.0
Population outlook (Clark County) Hauer SSP2
- Today (2025)
- 529,610 people
- By 2030
- 563,242 · +6.4%
- By 2040
- 625,905 · +18.2%
- By 2050
- 681,558 · +28.7%
- By 2075
- 805,967 · +52.2%
- By 2100
- 877,450 · +65.7%
Race, ethnicity, and origin ACS 2023
- Neighborhood character
- Majority White (64%)
- Race & ethnicity
- White 64% Hispanic / Latino 21% Two or more races 14% Black 4% Asian 3% Pacific Islander 2%
- Hispanic origin (detail)
- Mexican 18%
- Common ancestry
- Lithuanian 3% Portuguese 3% Subsaharan African 3%
- Foreign-born
- 15% · Canada, Vietnam
- Languages at home
- 76% English-only · Spanish 14% Russian/Polish/Slavic 4% Other Indo-European 2%
Political lean MEDSL · Clark
- 2024 margin
- Lean D (+7.0) · D 52.1% · R 45.1% · Other 2.8%
- 2008→2024 swing
- +0.9pp no change · 2008: 6.1pp · 2024: 7.0pp
- All cycles
- 2024: D+7.0 2020: D+5.1 2016: D+0.1 2012: D+0.1 2008: D+6.1
Not yet ingested
- Civics
- —
Market trends
- HPI YoY
- ▼ -567.83%
- Current HPI
- 308.3632
- Rent YoY
- ▲ 2.05%
- Metro
- Portland-Vancouver-Hillsboro, OR-WA
- State GDP YoY
- ▲ 4.65%
- F500 in state
- 22
Industry mix (Fortune 500 HQ in WA)
| Industry | F500 HQs | Revenue |
|---|---|---|
| Retail | 2 | $269B |
|
||
| Technology / Retail | 1 | $638B |
|
||
| Technology | 1 | $245B |
|
||
| Telecommunications | 1 | $38B |
|
||
| Food / Beverage | 1 | $36B |
|
||
| Automotive / Trucks | 1 | $34B |
|
||
Price history
-2.9% since first listed2 events — show timeline
- 2026-05-19 Price Changed $170,000 RMLS
- 2026-03-01 Listed $175,000 RMLS
Property tax history
+17.9%/yrLatest (2026): $288 · +53.3% YoY. Source: county tax records.
Cash-flow waterfall
monthlySold comps — $/sqft
last 12 mo · ≤1 miLoading sold comps…