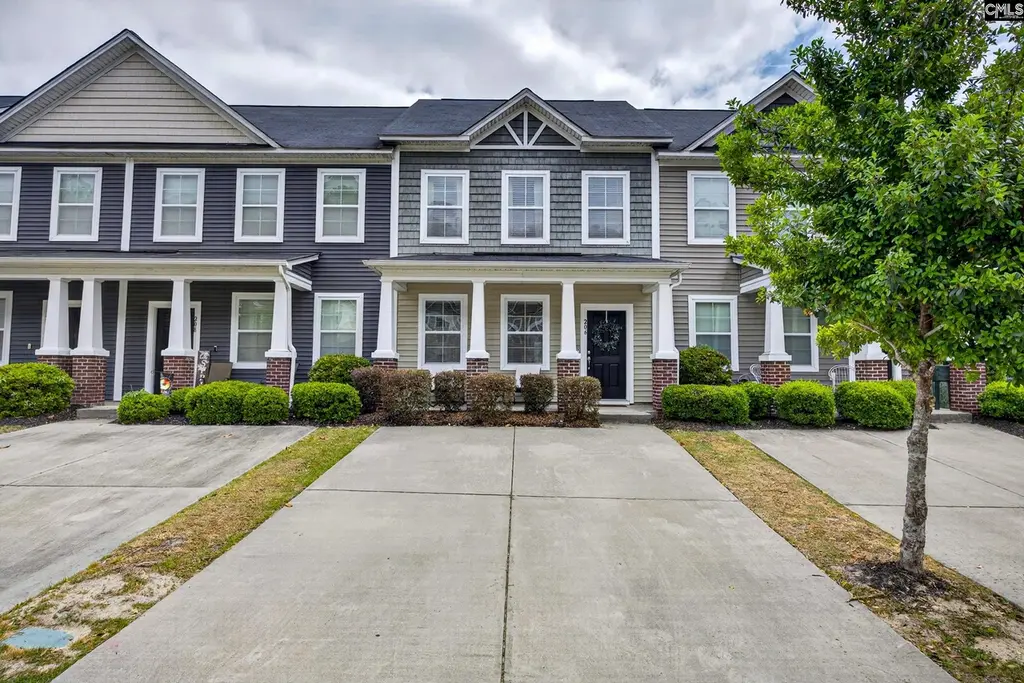
206 Favorite Ct · Oak Grove, SC
Flood risk 1/10 · Minimal
- FEMA flood zone
- X (unshaded)
- Chance of flooding over 30 yrs
- 0.0%
- Est. flood insurance / yr
- $507 – $1,088
Fire risk 3/10 · Minor
- Est. fire insurance / yr
- $783 – $1,453
Heat risk 6/10 · Moderate
- Hot days now (above 109°F)
- 7 days/yr
- Hot days in 30 yrs
- 16 days/yr
Wind risk 6/10 · Moderate
- Chance of severe wind over 30 yrs
- 67.0%
Air-quality risk 3/10 · Minor
- Unhealthy air days now
- 2 days/yr
- Unhealthy air days in 30 yrs
- 2 days/yr
Risk factors via First Street. Map © Google.
Why this score? — see what drove the C- grade
The composite is a weighted blend of 9 inputs, each scored 0–100. Each bar is that input's sub-score; the figure is the points it added to the 100-point composite (weight × sub-score).
- Cash flow +17.3/30.0
- ARV discount +8.3/15.0
- DSCR +5.4/10.0
- Appreciation +5.0/10.0
- 1% rule +3.9/10.0
- Livability +3.3/5.0
- Schools +2.9/10.0
- Rent growth +2.5/5.0
- Condition / age +2.5/5.0
$201,000
🖨 Deal sheet (PDF) 📄 Offer letter ✓ Due diligence
Listing remarks
Tucked away on a quiet cul-de-sac, 206 Favorite Court offers low-maintenance living in a convenient West Columbia location. This 3-bedroom, 2.5-bath townhome features a functional layout with spacious living areas, a well-appointed kitchen, and a comfortable flow for both everyday living and entertaining. Upstairs, you’ll find all three bedrooms, including a private primary suite with its own bath. The two additional bedrooms share a spacious full bathroom down the hall. Out back, enjoy a private patio space—perfect for morning coffee or unwinding in the evenings. Enjoy the ease of townhome living with minimal exterior upkeep, making it ideal for busy lifestyles or those looking
Key facts
- Quiet cul-de-sac
- Quick access to i-26
- Private patio space
Tags
Property features AI
Finance
- HOA & community: Community association present; Association covers landscaping and trash
Exterior
- Parking: Two parking spaces
- Utilities: Public water; Public sewer
- Home design: Two-story townhouse style; Vinyl exterior; Paved road access
- Construction: Slab foundation
- Exterior features: Covered front porch; Patio; Rear wood fencing
Interior
- Kitchen: Eat-in kitchen with granite countertops, stained wood cabinets, tile floor; Dishwasher; Disposal; Free-standing range; Refrigerator
- Bedrooms: Master bedroom on the second floor with double vanity, private bath, walk-in closet, tub/shower, ceiling fan, and carpeted floors; Second bedroom on the second floor with shared bath, tub/shower, ceiling fan, private closet, and carpeted floors; Third bedroom on the second floor with shared bath, tub/shower, ceiling fan, private closet, and carpeted floors
- Flooring: Luxury vinyl plank in living room; Carpet in bedrooms; Tile in kitchen
- Bathrooms: Two full bathrooms; One half bathroom; Two second full bathrooms
- Heating & cooling: Central heating; Central cooling
- Interior features: Attic access; Recessed lighting
- Laundry & utility: Washer and dryer included; Laundry located in a closet off a bath on the main level
Neighborhood map
What this means for you Summary
Snapshot
- This is a 3-bed/2.5-bath townhouse listed at $201k.
Deal economics
- At list price, monthly cash flow is $147 ($2k/yr) — positive.
- The deal already cash-flows at list — no discount required.
- To meet the 1% rule (rent ≥ 1% of price), the offer needs to be $178k (11.4% below list).
- Recommended offer: $178k (11.4% below list) — sets the bar for 1% rule.
Location & tenants
- Location reads 66/100 on livability (#114 in SC) — a middle-class / working-renter tenant base. Strengths: cost of living A+, housing A+, health & safety B; Watch: crime D, amenities F, commute F.
- Lexington 02 (suburban): math 30% / reading 38% proficiency, ranked #45 of 80 in SC (top 56%) — families likely to look elsewhere, expect single-tenant / working-renter base with shorter leases.
- Zoned schools: Northside Middle (math 27% / reading 35%, grade F, #128 of 229 statewide, top 58%, 555 students, 91% FRL); Brookland-Cayce High (math 32% / reading 77%, grade C-, #130 of 196 statewide, top 69%, 1,171 students, 100% FRL) — zoned schools average 95% FRL vs 59% district-wide (37 pts higher); higher-poverty schools than district average — tighter screening recommended.
- Market conditions: 1 active listings in the ZIP; 8 comparable units currently listed for rent nearby; rentals at typical pace (median 24d on market — plan ~3-4 weeks tenant-placement turnaround); 1,712 units permitted in Lexington County in 2024 (0 in 5+ unit buildings).
Forward outlook
- In year one you build about $7k of equity ($1k loan paydown + $6k appreciation (3.0% local appreciation)).
- Lexington County population projected at +26% by 2050 — long-run rental-demand tailwind backs the buy-and-hold thesis.
- At projected returns (3.0% appreciation + 3.0% rent growth), your $56k cash investment doubles in ~6 years — after that, you're playing with house money.
- By year 5, paydown + projected appreciation supports a ~$32k cash-out refi (75% LTV) — recoverable capital for the next deal without selling this one.
Negotiation context
- It's been on market 20 days — a 2% lower offer ($198k) is reasonable based on typical stale-listing flexibility.
- 2 sale attempts since 2y ago with the ask held roughly flat each time — persistent listings suggest the price (not the market) is what's stuck; bring a comps-based counter.
Risks & watch-outs
- Climate carrying-cost: major wind risk, 67% chance of damaging wind over 30y; extreme-heat days projected 7→16/yr by 2055 (HVAC capex compounding) — expect insurance premiums to compound above CPI over the hold.
Questions for the listing agent
- What does the HOA fee cover, when was the last increase, and are there any pending special assessments or reserve-fund shortfalls?
- Is there a deadline driving the sale (1031 exchange, divorce, estate, relocation)? That informs how much negotiation room exists.
- Schools are D-rated, which usually means shorter tenancies and higher turnover. Who's the typical renter profile here, and what's been the actual vacancy rate?
- Crime grade is D in this area — have there been break-ins, vandalism, or insurance claims at this property in the last 3 years? What carrier currently insures it and at what premium?
- What's the average days-on-market for RENTAL listings here right now (not sales)? A rising rental-DOM trend means longer vacancies and softer asking-rent achievability than the comps imply.
- What's the recent tenant-quality profile in this submarket — average credit score on applications, eviction rate, late-payment / NSF rate, and stable-employment percentage? A property-management company in the area should have these aggregated.
- How much new for-sale + rental construction is in the pipeline within 1–3 miles? Heavy new supply typically softens prices + rents 12–24 months out; constrained supply supports both.
Investment metrics
- 1% rule
- 0.89% ✗
- Cap rate
- 7.17%
- Cash-on-cash
- 3.14%
- DSCR
- 1.14
- GRM
- 9.4
CMA / ARV
- ARV (on-the-fly)
- $204,600
- Comps found
- 1
Show comp detail 1 sale within ~0.75 mi
| Address | Dist | Beds/Ba | Sqft | Sold | Price | $/sf | Match |
|---|---|---|---|---|---|---|---|
| 316 Favorite Ct | 0.07mi | 3/2.5 | 1,320 (0%) | 15mo | $205,000 | $155 | 84 |
Match score weights: distance 35% · size 25% · config 20% · recency 20%. Top-matched comps best support the ARV.
Projected returns pro-forma
3.0% appreciation · 3.0% rent growth · sell at horizon
- IRR
- 10.4%
- Equity multiple
- 1.60×
- Total profit
- $33,534
- Equity at exit
- $90,378
- IRR
- 12.7%
- Equity multiple
- 2.89×
- Total profit
- $106,199
- Equity at exit
- $139,284
Cash invested: $56,280 (down + closing). Projections, not guarantees.
Landlord ↔ Tenant lean methodology
- Overall (STATE)
- 90 Strongly Landlord-Friendly
- State South Carolina
- 90 Strongly Landlord-Friendly · R+6
- County
- — inherits STATE
- City
- — inherits STATE
ZIP-level market 29170-3317
- Active inventory
- 1
- Price-to-rent
- 9.4×
Monthly cashflow live
- Estimated rent
- $1,780 high interval (Pro) →
- Mortgage (P&I)
- −$1,054
- Tax from tax record
- −$53 /mo · $639/yr
- Insurance
- −$84
- HOA
- −$68
- Vacancy / Maint / Mgmt
- −$374
- Net cashflow
- $147
Break-even live
Sensitivity live
| Price | -10% $261 | -5% $204 | +0% $147 | +5% $90 | +10% $33 |
|---|---|---|---|---|---|
| Rent | -10% $7 | -5% $77 | +0% $147 | +5% $217 | +10% $288 |
| Rate | -1.0pp $248 | -0.5pp $198 | base $147 | +0.5pp $95 | +1.0pp $42 |
UW: 25.0% down · 7.5% · 30yr · 1.5% tax · 5.0% vac · 8.0% maint · 8.0% mgmt
Financing live
Cash to close
- Down payment
- $50,250
- Closing costs
- $6,030
- Reserves months
- —
- Total cash needed
- —
Loan-product check · same deal, 3 products live
Conventional
25% down · 7.5% · 30yr
- Down + closing
- —
- Monthly P&I
- —
- Monthly cashflow
- —
- DSCR
- —
- Eligible?
- —
Personal DTI + credit; lowest rate.
DSCR
20% down · 8.5% · 30yr
- Down + closing
- —
- Monthly P&I
- —
- Monthly cashflow
- —
- DSCR
- —
- Eligible?
- —
No personal income docs; deal must DSCR.
Hard money
10% down · 12.0% · 12mo
- Down + closing
- —
- Monthly P&I
- —
- Monthly cashflow
- —
- DSCR
- —
- Eligible?
- —
Short-term bridge; refi at stabilization.
Rent comps 8 comps
| Address | Beds | Baths | Sqft | Rent | $/sqft | DOM | Units | Dist |
|---|---|---|---|---|---|---|---|---|
| 213 Favorite Ct West Columbia, SC | 3.0 | 2.5 | 1251 | $1,695 | $1.35 | 23d | 1 | 0.01mi |
| 133 Brewers Oak Ln West Columbia, SC | 3.0 | 2.5 | 1600 | $2,049 | $1.28 | 4d | 1 | 0.51mi |
| 336 Gum Swamp Trl West Columbia, SC | 3.0 | 2.5 | 1350 | $2,500 | $1.85 | 25d | 1 | 0.97mi |
| 200 # W Unit Woodberry Rd unit West Columbia, SC | 2.0 | 2.0 | 1000 | $1,300 | $1.30 | 4d | 1 | 1.10mi |
| 3220 Woodsen Cir West Columbia, SC | 3.0 | 2.0 | 1475 | $1,800 | $1.22 | 25d | 1 | 1.12mi |
| 2720 Sunset Blvd West Columbia, SC | 1.0–3.0 | 1.0–2.0 | 1187 | $2,540 | $2.14 | 21d | 35 | 1.32mi |
| 320 Dreher Rd Unit 5 West Columbia, SC | 2.0 | 1.0 | 1000 | $1,000 | $1.00 | 25d | 1 | 1.34mi |
| 332 Guilford St West Columbia, SC | 3.0 | 1.0 | 958 | $1,550 | $1.62 | 23d | 1 | 1.45mi |
HOA detail
- Monthly dues
- $68 · $816/yr
Listing history 8 events
-
2026-05-21status Pending
-
2026-05-06historical Active - Contingent
-
2026-05-01$201,000 Active
-
2024-03-08soldstatus $197,500
-
2024-01-17status Pending
-
2024-01-09price $197,500
-
2024-01-08$197,500,000 Active
-
2012-01-04soldstatus $220,000
ⓘ Source: listings_history table (triggers on properties + properties_extension) + one-shot
backfill from property_details.listing_events for pre-trigger history.
Tax reassessment forecast SC · Resets to sale price
- Current annual tax
- $639 · $53/mo
- Projected year-2 tax
- $1,146 · $95/mo
- Expected delta
- +$507/yr (+$42/mo · 79.4%)
ⓘ Screening estimate from a state-policy table — verify with the county assessor before closing.
Climate risk First Street
- Flood 1/10 Low FEMA zone X (unshaded) · 0% chance over 30 yrs
- Wildfire 3/10 Moderate
- Heat 6/10 Major 7 d/yr ≥109°F today · 16 d/yr by 30 yrs out
- Wind 6/10 Major 67% chance of damaging wind over 30 yrs
- Air quality 3/10 Moderate 2 unhealthy d/yr today · 2 by 30 yrs out
Nearby sold comps map
Loading sold comps map…
Walkable amenities ~0.75 mi
Loading nearby amenities…
Taxation est. · year 1
- Rental income
- $21,360
- − Mortgage interest
- −$11,259
- − Property taxes
- −$639
- − Insurance
- −$1,005
- − Repairs & maintenance
- −$1,709
- − Management
- −$1,709
- − HOA
- −$816
- − Depreciation
- −$5,847
- Taxable loss
- −$1,624
- Est. tax savings @ 24.0%
- +$390
- After-tax cash flow
- $2,156/yr
For passive investors: Depreciation is non-cash, so a rental often shows a tax loss while cash-flowing — sheltering income. Rental losses are passive: they offset passive income freely, and up to $25,000/yr can offset ordinary (W-2) income if you actively participate and your MAGI is under $100k (phasing out to $0 by $150k); unused losses carry forward. On sale, claimed depreciation is recaptured at up to 25%, and gains may owe capital-gains tax (a 1031 exchange can defer both). Figures are a year-1 estimate at your 24.0% rate — not tax advice; consult a CPA.
Schools (NCES district)
- District
- Lexington 02
- NCES district ID
- 4502730
- Math proficiency
- 30% ▼ -6.00%
- Reading proficiency
- 38% ▬ 0.00%
- Median HH income
- $42,532
- Composite
- 28.78/100
- National rank
- #6669
- State rank
- #45 of 80 in SC
Livability — Oak Grove
- Score
- 66/100
- State rank
- #114
- US rank
- #11681
Category grades
Schools grade is shown separately in the Schools card above.
Census & demographics
- Census place
- Oak Grove, SC
Population outlook (Lexington County) Hauer SSP2
- Today (2025)
- 322,999 people
- By 2030
- 342,356 · +6.0%
- By 2040
- 377,715 · +16.9%
- By 2050
- 406,984 · +26.0%
- By 2075
- 465,447 · +44.1%
- By 2100
- 485,674 · +50.4%
Not yet ingested
- Political lean
- —
- Race & ethnicity
- —
- Common origin
- —
- Civics
- —
Market trends
- HPI YoY
- —
- Current HPI
- —
- Rent YoY
- —
- Metro
- —
- State GDP YoY
- ▲ 4.51%
- F500 in state
- 2
Industry mix (Fortune 500 HQ in SC)
| Industry | F500 HQs | Revenue |
|---|---|---|
| Packaging | 1 | $7B |
|
||
Price history
-8.6% since first listed8 events — show timeline
- 2026-05-21 Pending — Consolidated MLS
- 2026-05-06 Contingent — Consolidated MLS
- 2026-05-01 Listed $201,000 Consolidated MLS
- 2024-03-08 Sold (Public Records) $197,500 Public Records
- 2024-01-17 Pending — Consolidated MLS
- 2024-01-09 Price Changed $197,500 Consolidated MLS
- 2024-01-08 Listed $197,500,000 Consolidated MLS
- 2012-01-04 Sold (Public Records) $220,000 Public Records
Property tax history
-6.0%/yrLatest (2024): $639 · +3.3% YoY. Source: county tax records.
Cash-flow waterfall
monthlySold comps — $/sqft
last 12 mo · ≤1 miLoading sold comps…