1017 & 1021 S Cedar St · Casper, WY
Flood risk 6/10 · Moderate
- FEMA flood zone
- X (shaded)
- Chance of flooding over 30 yrs
- 0.7%
- Est. flood insurance / yr
- $507 – $1,088
Fire risk 6/10 · Moderate
- Est. fire insurance / yr
- $564 – $1,046
Heat risk 3/10 · Minor
- Hot days now (above 91°F)
- 7 days/yr
- Hot days in 30 yrs
- 19 days/yr
Wind risk 1/10 · Minimal
- Chance of severe wind over 30 yrs
- —
Air-quality risk 2/10 · Minimal
- Unhealthy air days now
- 2 days/yr
- Unhealthy air days in 30 yrs
- 2 days/yr
Risk factors via First Street. Map © Google.
Why this score? — see what drove the B grade
The composite is a weighted blend of 9 inputs, each scored 0–100. Each bar is that input's sub-score; the figure is the points it added to the 100-point composite (weight × sub-score).
- Cash flow +29.2/30.0
- DSCR +10.0/10.0
- 1% rule +8.2/10.0
- ARV discount +7.5/15.0
- Rent growth +4.7/5.0
- Schools +4.2/10.0
- Livability +3.9/5.0
- Condition / age +2.5/5.0
- Appreciation +0.0/10.0
$84,000
🖨 Deal sheet (PDF) 📄 Offer letter ✓ Due diligence
Listing remarks MLS
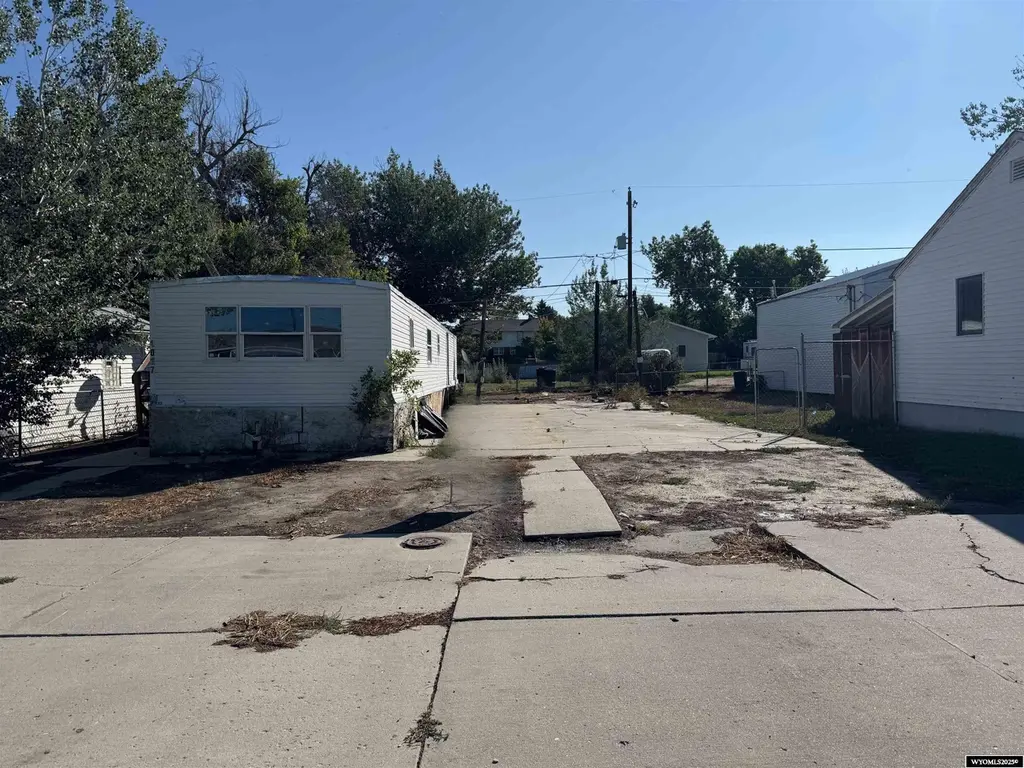
Two lots located at 1017 & 1021 S Cedar St in Casper, WY, zoned R-4 High Density Residential. Each lot is approximately 50' x 130'. Per City of Casper guidance, an existing trailer on site may remain if rehabilitated and kept in its current location. Any new construction must be a single-family residence, either stick-built or modular on a permanent foundation, subject to City approval. New manufactured or mobile homes are not permitted under current City interpretation unless meeting current standards. Buyer and Buyer’s Agent to verify zoning, setbacks, and intended use with the City of Casper. Property is being Sold AS IS, WHERE IS. Call Liane Embry @ 307-258-6305 to set up your showing.
Key facts
- 6,499 sq ft lot
- Built 1976
- Listed 174 days
Neighborhood map
What this means for you Summary
Snapshot
- This is a ?-bed/1.0-bath manufactured listed at $84k.
Deal economics
- At list price, monthly cash flow is $294 ($4k/yr) — positive.
- The deal already cash-flows at list — no discount required.
- Meets the 1% rule at list price ($1k rent vs $84k).
- Recommended offer: $74k (12.0% below list) — sets the bar for market timing.
- Cap rate 10.5% vs local median 3.0% in Casper — top-decile yield for the area; either an underpriced asset or a hidden risk that comps aren't pricing in. Stress-test before assuming the spread holds.
Location & tenants
- Location reads 78/100 on livability (#8 in WY, #2,629 nationally) — a middle-class / working-renter tenant base. Strengths: commute A+, cost of living A+, housing A+; Watch: amenities D, health & safety F.
- Natrona County School District #1 (urban): math 44% / reading 52% proficiency, ranked #32 of 41 in WY (top 78%) — families likely to look elsewhere, expect single-tenant / working-renter base with shorter leases.
- Zoned schools: Lincoln Elementary School (math 42% / reading 32%, grade F, #128 of 151 statewide, top 86%, 459 students, 67% FRL); Centennial Middle School (math 37% / reading 54%, grade D+, #40 of 55 statewide, top 72%, 796 students, 31% FRL); Kelly Walsh High School (math 49% / reading 60%, grade C-, #18 of 75 statewide, top 30%, 2,051 students, 29% FRL).
- Market conditions: Rents rising fast (+9.0%/yr); 225 active listings in the ZIP; 310 units permitted in Natrona County in 2024 (104 in 5+ unit buildings).
Forward outlook
- Local home prices are declining (-3.0%/yr); year-one equity from $581 of loan paydown is wiped out by about $3k of value loss. Plan a longer hold.
- Natrona County population projected at +46% by 2050 — long-run rental-demand tailwind backs the buy-and-hold thesis.
- At projected returns (-3.0% appreciation + 8.0% rent growth), your $24k cash investment doubles in ~6 years — after that, you're playing with house money.
Negotiation context
- It's been on market 174 days — a 12% lower offer ($74k) is reasonable based on typical stale-listing flexibility.
- 3 sale attempts with the ask held roughly flat each time — persistent listings suggest the price (not the market) is what's stuck; bring a comps-based counter.
Risks & watch-outs
- Climate carrying-cost: major flood risk; major wildfire risk — expect insurance premiums to compound above CPI over the hold.
Questions for the listing agent
- It's been on market 174 days. Have you received any prior offers? Is the seller open to a 12% concession, seller financing, or rate buy-down credit?
- Built in 1976 — when were the roof, HVAC, electrical panel, plumbing, and water heater last replaced?
- Why hasn't it sold? Are there any deal-killer items the seller is aware of (foundation, flood, title, zoning, code violations)?
- Is there a deadline driving the sale (1031 exchange, divorce, estate, relocation)? That informs how much negotiation room exists.
- What's the average days-on-market for RENTAL listings here right now (not sales)? A rising rental-DOM trend means longer vacancies and softer asking-rent achievability than the comps imply.
- What's the recent tenant-quality profile in this submarket — average credit score on applications, eviction rate, late-payment / NSF rate, and stable-employment percentage? A property-management company in the area should have these aggregated.
- How much new for-sale + rental construction is in the pipeline within 1–3 miles? Heavy new supply typically softens prices + rents 12–24 months out; constrained supply supports both.
Investment metrics
- 1% rule
- 1.32% ✓
- Cap rate
- 10.49%
- Cash-on-cash
- 14.98%
- DSCR
- 1.67
- GRM
- 6.3
CMA / ARV
- ARV (median comp)
- $47,595
- List price
- $84,000
- Delta
- 76.49%
- Verdict
- OVERPRICED
- Comps
- 4 within 2.0 mi
Show comp detail 1 sale within ~0.75 mi
| Address | Dist | Beds/Ba | Sqft | Sold | Price | $/sf | Match |
|---|---|---|---|---|---|---|---|
| 1045 Cedar St | 0.05mi | 2/1.0 (+2) | 840 (-9%) | 6mo | $79,900 | $95 | 67 |
Match score weights: distance 35% · size 25% · config 20% · recency 20%. Top-matched comps best support the ARV.
Projected returns pro-forma
-3.0% appreciation · 8.0% rent growth · sell at horizon
- IRR
- 11.1%
- Equity multiple
- 1.47×
- Total profit
- $10,947
- Equity at exit
- $12,525
- IRR
- 23.9%
- Equity multiple
- 3.56×
- Total profit
- $60,286
- Equity at exit
- $7,263
Cash invested: $23,520 (down + closing). Projections, not guarantees.
Landlord ↔ Tenant lean methodology
- Overall (STATE)
- 90 Strongly Landlord-Friendly
- State Wyoming
- 90 Strongly Landlord-Friendly · R+25
- County
- — inherits STATE
- City
- — inherits STATE
ZIP-level market 82601
- Rents YoY
- 9.0%
- Active inventory
- 225
- Price-to-rent
- 6.3×
Monthly cashflow live
- Estimated rent
- $1,106 medium interval (Pro) →
- Mortgage (P&I)
- −$441
- Tax est. 1.5%
- −$105 /mo · $1,260/yr
- Insurance
- −$35
- HOA
- −$0
- Vacancy / Maint / Mgmt
- −$232
- Net cashflow
- $294
Break-even live
Sensitivity live
| Price | -10% $352 | -5% $323 | +0% $294 | +5% $265 | +10% $235 |
|---|---|---|---|---|---|
| Rent | -10% $206 | -5% $250 | +0% $294 | +5% $337 | +10% $381 |
| Rate | -1.0pp $336 | -0.5pp $315 | base $294 | +0.5pp $272 | +1.0pp $250 |
UW: 25.0% down · 7.5% · 30yr · 1.5% tax · 5.0% vac · 8.0% maint · 8.0% mgmt
Financing live
Cash to close
- Down payment
- $21,000
- Closing costs
- $2,520
- Reserves months
- —
- Total cash needed
- —
Loan-product check · same deal, 3 products live
Conventional
25% down · 7.5% · 30yr
- Down + closing
- —
- Monthly P&I
- —
- Monthly cashflow
- —
- DSCR
- —
- Eligible?
- —
Personal DTI + credit; lowest rate.
DSCR
20% down · 8.5% · 30yr
- Down + closing
- —
- Monthly P&I
- —
- Monthly cashflow
- —
- DSCR
- —
- Eligible?
- —
No personal income docs; deal must DSCR.
Hard money
10% down · 12.0% · 12mo
- Down + closing
- —
- Monthly P&I
- —
- Monthly cashflow
- —
- DSCR
- —
- Eligible?
- —
Short-term bridge; refi at stabilization.
Listing history 23 events
-
2026-06-22days on market $84,000 Active 174 DOM
-
2026-06-19days on market $84,000 Active 172 DOM
-
2026-06-18days on market $84,000 Active 171 DOM
-
2026-06-17days on market $84,000 Active 170 DOM
-
2026-06-17days on market $84,000 Active 169 DOM
-
2026-06-15days on market $84,000 Active 168 DOM
-
2026-06-14days on market $84,000 Active 166 DOM
-
2026-06-13days on market $84,000 Active 165 DOM
-
2026-06-10days on market $84,000 Active 163 DOM
-
2026-06-09days on market $84,000 Active 162 DOM
-
2026-06-08days on market $84,000 Active 161 DOM
-
2026-06-07days on market $84,000 Active 160 DOM
-
2026-06-05days on market $84,000 Active 157 DOM
-
2026-06-03days on market $84,000 Active 156 DOM
-
2026-06-02days on market $84,000 Active 155 DOM
-
2026-06-01days on market $84,000 Active 154 DOM
-
2026-05-31days on market $84,000 Active 153 DOM
-
2026-05-30days on market $84,000 Active 152 DOM
-
2025-12-30$84,000 Active 710-char remark
Show marketing remark (710 chars)
Two lots located at 1017 & 1021 S Cedar St in Casper, WY, zoned R-4 High Density Residential. Each lot is approximately 50' x 130'. Per City of Casper guidance, an existing trailer on site may remain if rehabilitated and kept in its current location. Any new construction must be a single-family residence, either stick-built or modular on a permanent foundation, subject to City approval. New manufactured or mobile homes are not permitted under current City interpretation unless meeting current standards. Buyer and Buyer’s Agent to verify zoning, setbacks, and intended use with the City of Casper. Property is being Sold AS IS, WHERE IS. Call Liane Embry @ 307-258-6305 to set up your showing.
-
2025-10-21status Pending
-
2025-07-30status Active
-
2025-07-29status Pending
-
2025-07-25$84,000 Active
ⓘ Source: listings_history table (triggers on properties + properties_extension) + one-shot
backfill from property_details.listing_events for pre-trigger history.
Climate risk First Street
- Flood 6/10 Major FEMA zone X (shaded) · 70% chance over 30 yrs
- Wildfire 6/10 Major
- Heat 3/10 Moderate 7 d/yr ≥91°F today · 19 d/yr by 30 yrs out
- Wind 1/10 Low
- Air quality 2/10 Low 2 unhealthy d/yr today · 2 by 30 yrs out
Nearby sold comps map
Loading sold comps map…
Walkable amenities ~0.75 mi
Loading nearby amenities…
Taxation est. · year 1
- Rental income
- $13,277
- − Mortgage interest
- −$4,705
- − Property taxes
- −$1,260
- − Insurance
- −$420
- − Repairs & maintenance
- −$1,062
- − Management
- −$1,062
- − Depreciation
- −$2,444
- Taxable income
- $2,323
- Est. tax owed @ 24.0%
- −$558
- After-tax cash flow
- $2,965/yr
For passive investors: Depreciation is non-cash, so a rental often shows a tax loss while cash-flowing — sheltering income. Rental losses are passive: they offset passive income freely, and up to $25,000/yr can offset ordinary (W-2) income if you actively participate and your MAGI is under $100k (phasing out to $0 by $150k); unused losses carry forward. On sale, claimed depreciation is recaptured at up to 25%, and gains may owe capital-gains tax (a 1031 exchange can defer both). Figures are a year-1 estimate at your 24.0% rate — not tax advice; consult a CPA.
Schools (NCES district)
- District
- Natrona County School District #1
- NCES district ID
- 5604510
- Math proficiency
- 44% ▼ -4.00%
- Reading proficiency
- 52% ▼ -2.00%
- Median HH income
- $55,217
- Composite
- 41.6/100
- National rank
- #3437
- State rank
- #32 of 41 in WY
Livability — Casper
- Score
- 78/100
- State rank
- #8
- US rank
- #2629
Category grades
Schools grade is shown separately in the Schools card above.
Census & demographics
- Census place
- Casper, WY
- County
- Natrona County · 72,922 people
- City population
- 72,922
- Metro
- Casper, WY
- Population (ZIP)
- 26,721
- Household income
- $67,642
- Rent vs Own
- Severe rent burden
- 749.0
Population outlook (Natrona County) Hauer SSP2
- Today (2025)
- 98,530 people
- By 2030
- 107,084 · +8.7%
- By 2040
- 124,838 · +26.7%
- By 2050
- 143,617 · +45.8%
- By 2075
- 192,378 · +95.2%
- By 2100
- 228,435 · +131.8%
Race, ethnicity, and origin ACS 2023
- Neighborhood character
- Predominantly White (84%)
- Race & ethnicity
- White 84% Hispanic / Latino 12% Two or more races 7%
- Hispanic origin (detail)
- Mexican 8%
- Common ancestry
- Slovak 4% Lithuanian 4% Portuguese 4%
- Foreign-born
- 3% · Canada
- Languages at home
- 94% English-only · Spanish 4%
Political lean MEDSL · Natrona
- 2024 margin
- Solid R (+48.6) · D 24.8% · R 73.5% · Other 1.7%
- 2008→2024 swing
- -14.3pp toward R · 2008: -34.4pp · 2024: -48.6pp
- All cycles
- 2024: R+48.6 2020: R+47.6 2016: R+52.2 2012: R+41.1 2008: R+34.4
Not yet ingested
- Civics
- —
Market trends
- HPI YoY
- ▼ -190.42%
- Current HPI
- 181.2192
- Rent YoY
- ▲ 8.97%
- Metro
- Casper, WY
- State GDP YoY
- —
- F500 in state
- 0
Price history
+0.0% since first listed5 events — show timeline
- 2025-12-30 Listed $84,000 WMLS
- 2025-10-21 Pending — WMLS
- 2025-07-30 Relisted — WMLS
- 2025-07-29 Pending — WMLS
- 2025-07-25 Listed $84,000 WMLS
Cash-flow waterfall
monthlySold comps — $/sqft
last 12 mo · ≤1 miLoading sold comps…