 Triplex
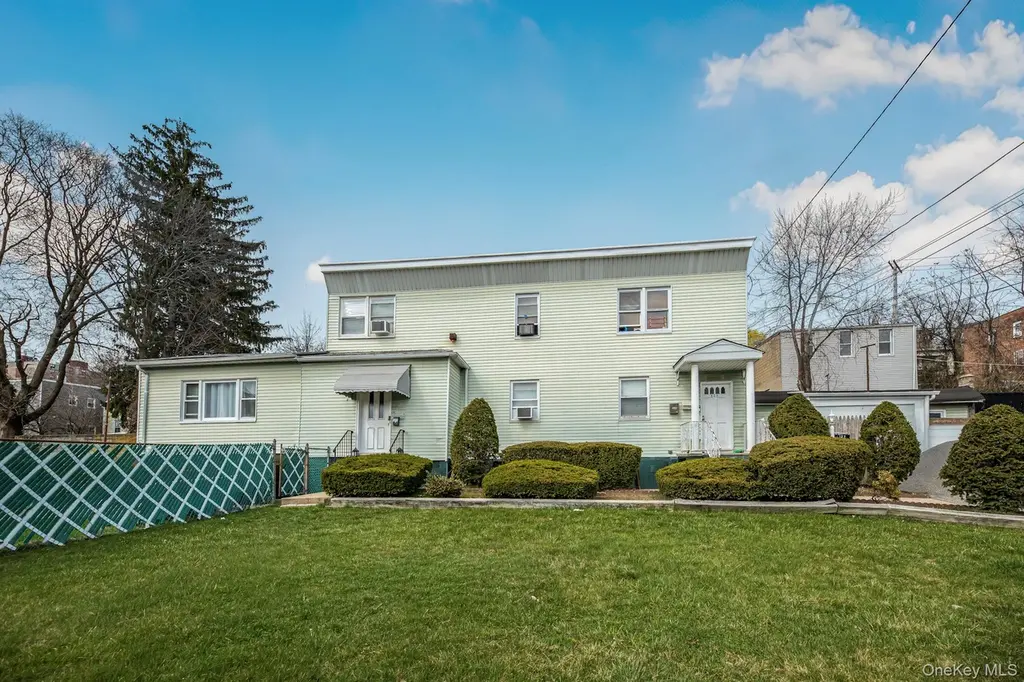
125 aka 127 Woodland Ave · Yonkers, NY
Flood risk 1/10 · Minimal
- FEMA flood zone
- X (unshaded)
- Chance of flooding over 30 yrs
- 0.0%
- Est. flood insurance / yr
- $473 – $860
Fire risk 1/10 · Minimal
- Est. fire insurance / yr
- $691 – $1,283
Heat risk 6/10 · Moderate
- Hot days now (above 99°F)
- 7 days/yr
- Hot days in 30 yrs
- 16 days/yr
Wind risk 6/10 · Moderate
- Chance of severe wind over 30 yrs
- 27.0%
Air-quality risk 3/10 · Minor
- Unhealthy air days now
- 3 days/yr
- Unhealthy air days in 30 yrs
- 4 days/yr
Risk factors via First Street. Map © Google.
Why this score? — see what drove the D grade
The composite is a weighted blend of 9 inputs, each scored 0–100. Each bar is that input's sub-score; the figure is the points it added to the 100-point composite (weight × sub-score).
- ARV discount +15.0/15.0
- Cash flow +9.2/30.0
- Schools +4.1/10.0
- Livability +3.4/5.0
- 1% rule +2.8/10.0
- DSCR +2.6/10.0
- Rent growth +2.5/5.0
- Condition / age +2.5/5.0
- Appreciation +0.0/10.0
$1,100,000
🖨 Deal sheet 📄 Offer letter ✓ Due diligence
Multi-family units
County records classify this as Multi-Family (2-4 Unit). Listing-text estimate: 3 units. confirmed
Listing remarks MLS
A wonderful Investment opportunity three family private home comes with additional lot. home features 6 bedrooms, additional rooms,3 full bathrooms, walk out basement, garage, 6 cars parking space in the driveway and a beautiful landscape yard.
Key facts
- Garage
- Built 1916
- Listed 71 days
Neighborhood map
What this means for you Summary
Snapshot
- This is a 3 × 2-bed/1.0-bath units multifamily listed at $1.10M.
Deal economics
- At list price, monthly cash flow is $-830 ($-10k/yr) — negative. Per door: $-277/mo.
- To cash-flow at today's rent, offer at most $980k (10.9% below list).
- To meet the 1% rule (rent ≥ 1% of price), the offer needs to be $857k (22.1% below list).
- Recommended offer: $857k (22.1% below list) — sets the bar for 1% rule.
Location & tenants
- Location reads 68/100 on livability (#528 in NY) — a middle-class / working-renter tenant base. Strengths: employment A, commute B; Watch: amenities F, cost of living F.
- Yonkers City School District (suburban): math 41% / reading 54% proficiency, ranked #413 of 590 in NY (top 70%) — families likely to look elsewhere, expect single-tenant / working-renter base with shorter leases; 64% free/reduced lunch — lower-income household profile, screen leases tightly.
- Market conditions: 75 active listings in the ZIP; 1 comparable units currently listed for rent nearby; solid renter incomes; 954 units permitted in Westchester County in 2024 (649 in 5+ unit buildings).
- At $8,572/mo this rent would consume 115% of the median local household income ($90k/yr) (locally 1216% of renters already pay >50% of income on rent) — very limited rent-growth headroom before tenants either downsize or default.
Forward outlook
- Local home prices are declining (-3.0%/yr); year-one equity from $8k of loan paydown is wiped out by about $33k of value loss. Plan a longer hold.
- Westchester County population projected at +10% by 2050 — modest demand growth; plan on rents tracking national, not racing it.
Negotiation context
- It's been on market 71 days — a 6% lower offer ($1.03M) is reasonable based on typical stale-listing flexibility.
Risks & watch-outs
- Watch-outs: built in 1916 — expect roof / HVAC / electrical / plumbing capex.
- Climate carrying-cost: major wind risk, 27% chance of damaging wind over 30y; extreme-heat days projected 7→16/yr by 2055 (HVAC capex compounding) — expect insurance premiums to compound above CPI over the hold.
Questions for the listing agent
- What do current leases actually rent for vs. the listed asking? Can we see a recent rent roll and the last 12 months of T-12 income?
- It's been on market 71 days. Have you received any prior offers? Is the seller open to a 22% concession, seller financing, or rate buy-down credit?
- Can we see the unit-by-unit rent roll, current vacancy, and any below-market leases? What's the average tenancy length?
- What capital expenditures (roof, boiler, parking lot, exteriors) have been made in the last 5 years, and what's planned in the next 2?
- Built in 1916 — when were the roof, HVAC, electrical panel, plumbing, and water heater last replaced?
- Why hasn't it sold? Are there any deal-killer items the seller is aware of (foundation, flood, title, zoning, code violations)?
- Is there a deadline driving the sale (1031 exchange, divorce, estate, relocation)? That informs how much negotiation room exists.
- The area grade is low — what's the realistic commute time and amenity access for the typical tenant pool here? Any planned neighborhood developments (good or bad) we should know about?
- What's the average days-on-market for RENTAL listings here right now (not sales)? A rising rental-DOM trend means longer vacancies and softer asking-rent achievability than the comps imply.
- What's the recent tenant-quality profile in this submarket — average credit score on applications, eviction rate, late-payment / NSF rate, and stable-employment percentage? A property-management company in the area should have these aggregated.
- How much new apartment / multifamily construction is in the pipeline within 1–3 miles? Heavy new supply (>2% of stock underway) typically softens rents 12–24 months out; light construction supports rent growth.
Investment metrics
- 1% rule
- 0.78% ✗
- Cap rate
- 5.39%
- Cash-on-cash
- -3.23%
- DSCR
- 0.86
- GRM
- 10.7
CMA / ARV
- ARV (median comp)
- $1,437,282
- List price
- $1,100,000
- Delta
- -23.47%
- Verdict
- UNDERPRICED
- Comps
- 20 within 1.0 mi
Show comp detail 8 sales within ~0.75 mi
| Address | Dist | Beds/Ba | Sqft | Sold | Price | $/sf | Match |
|---|---|---|---|---|---|---|---|
| 82 Morningside Ave | 0.24mi | 6/4.0 | 3,468 (+5%) | 2mo | $880,000 | $254 | 75 |
| 62 Fortfield Ave | 0.62mi | 5/— (-1) | 3,350 (+1%) | 6mo | $999,999 | $299 | 60 |
| 21 Lake Ave | 0.45mi | 7/4.0 (+1) | 3,382 (+2%) | 12mo | $975,000 | $288 | 57 |
| 287 Mary Lou Ave | 0.75mi | 6/4.0 | 3,200 (-4%) | 4mo | $1,145,000 | $358 | 52 |
| 40 Amackassin Ter | 0.35mi | 7/3.0 (+1) | 3,632 (+10%) | 14mo | $710,000 | $195 | 51 |
| 153 Burhans Ave | 0.65mi | 6/2.0 | 3,200 (-4%) | 18mo | $890,000 | $278 | 45 |
| 26 Parsons St | 0.48mi | 6/3.0 | 2,970 (-10%) | 19mo | $850,000 | $286 | 44 |
| 97 Greenvale Ave | 0.63mi | 5/2.0 (-1) | 3,453 (+4%) | 15mo | $905,000 | $262 | 42 |
Match score weights: distance 35% · size 25% · config 20% · recency 20%. Top-matched comps best support the ARV.
Projected returns pro-forma
-3.0% appreciation · 3.0% rent growth · sell at horizon
- IRR
- -21.7%
- Equity multiple
- 0.25×
- Total profit
- $-230,979
- Equity at exit
- $164,014
- IRR
- -15.4%
- Equity multiple
- 0.13×
- Total profit
- $-268,675
- Equity at exit
- $95,108
Cash invested: $308,000 (down + closing). Projections, not guarantees.
Landlord ↔ Tenant lean methodology
- Overall (CITY)
- 5 Strongly Tenant-Friendly
- State New York
- 15 Strongly Tenant-Friendly · D+10
- County
- — inherits STATE
- City Yonkers
- 5 Strongly Tenant-Friendly · D+20
ZIP-level market 10703
- Home prices YoY
- -13.2%
- Active inventory
- 75
- Price-to-rent
- 32.1×
Monthly cashflow live
- Estimated rent
- $8,572 high interval (Pro) →
- Mortgage (P&I)
- −$5,769
- Tax est. 1.5%
- −$1,375 /mo · $16,500/yr
- Insurance
- −$458
- HOA
- −$0
- Vacancy / Maint / Mgmt
- −$1,800
- Net cashflow
- $-830
Break-even live
3-unit breakdown (identical units grouped — click to expand)
| Units | Beds | Baths | Est. rent |
|---|---|---|---|
| 3× units | 2 | 1 | $8,571 |
| #1 | 2 | 1 | $2,857 |
| #2 | 2 | 1 | $2,857 |
| #3 | 2 | 1 | $2,857 |
| Total (3 units) | $8,572 | ||
UW: 25.0% down · 7.5% · 30yr · 1.5% tax · 5.0% vac · 8.0% maint · 8.0% mgmt
Financing live
Cash to close
- Down payment
- $275,000
- Closing costs
- $33,000
- Reserves months
- —
- Total cash needed
- —
Loan-product check · same deal, 3 products live
Conventional
25% down · 7.5% · 30yr
- Down + closing
- —
- Monthly P&I
- —
- Monthly cashflow
- —
- DSCR
- —
- Eligible?
- —
Personal DTI + credit; lowest rate.
DSCR
20% down · 8.5% · 30yr
- Down + closing
- —
- Monthly P&I
- —
- Monthly cashflow
- —
- DSCR
- —
- Eligible?
- —
No personal income docs; deal must DSCR.
Hard money
10% down · 12.0% · 12mo
- Down + closing
- —
- Monthly P&I
- —
- Monthly cashflow
- —
- DSCR
- —
- Eligible?
- —
Short-term bridge; refi at stabilization.
Rent comps 1 comps
| Address | Beds | Baths | Sqft | Rent | $/sqft | DOM | Units | Dist |
|---|---|---|---|---|---|---|---|---|
| 164 Rossiter Ave Yonkers, NY | 5.0 | 3.0 | 3080 | $5,300 | $1.72 | 1d | 1 | 0.81mi |
Listing history 14 events
-
2026-06-18days on market $1,100,000 Active 71 DOM
-
2026-06-17days on market $1,100,000 Active 70 DOM
-
2026-06-16days on market $1,100,000 Active 69 DOM
-
2026-06-15days on market $1,100,000 Active 68 DOM
-
2026-06-13days on market $1,100,000 Active 66 DOM
-
2026-06-09days on market $1,100,000 Active 62 DOM
-
2026-06-08days on market $1,100,000 Active 61 DOM
-
2026-06-07days on market $1,100,000 Active 60 DOM
-
2026-06-04days on market $1,100,000 Active 57 DOM
-
2026-06-03days on market $1,100,000 Active 56 DOM
-
2026-06-02days on market $1,100,000 Active 55 DOM
-
2026-06-01days on market $1,100,000 Active 54 DOM
-
2026-05-31days on market $1,100,000 Active 53 DOM
-
2026-04-08$1,100,000 Active 245-char remark
Show marketing remark (245 chars)
A wonderful Investment opportunity three family private home comes with additional lot. home features 6 bedrooms, additional rooms,3 full bathrooms, walk out basement, garage, 6 cars parking space in the driveway and a beautiful landscape yard.
ⓘ Source: listings_history table (triggers on properties + properties_extension) + one-shot
backfill from property_details.listing_events for pre-trigger history.
Climate risk First Street
- Flood 1/10 Low FEMA zone X (unshaded) · 0% chance over 30 yrs
- Wildfire 1/10 Low
- Heat 6/10 Major 7 d/yr ≥99°F today · 16 d/yr by 30 yrs out
- Wind 6/10 Major 27% chance of damaging wind over 30 yrs
- Air quality 3/10 Moderate 3 unhealthy d/yr today · 4 by 30 yrs out
Nearby sold comps map
Loading sold comps map…
Walkable amenities ~0.75 mi
Loading nearby amenities…
Taxation est. · year 1
- Rental income
- $102,864
- − Mortgage interest
- −$61,617
- − Property taxes
- −$16,500
- − Insurance
- −$5,500
- − Repairs & maintenance
- −$8,229
- − Management
- −$8,229
- − Depreciation
- −$32,000
- Taxable loss
- −$29,211
- Est. tax savings @ 24.0%
- +$7,011
- After-tax cash flow
- $-2,949/yr
For passive investors: Depreciation is non-cash, so a rental often shows a tax loss while cash-flowing — sheltering income. Rental losses are passive: they offset passive income freely, and up to $25,000/yr can offset ordinary (W-2) income if you actively participate and your MAGI is under $100k (phasing out to $0 by $150k); unused losses carry forward. On sale, claimed depreciation is recaptured at up to 25%, and gains may owe capital-gains tax (a 1031 exchange can defer both). Figures are a year-1 estimate at your 24.0% rate — not tax advice; consult a CPA.
Schools (NCES district)
- District
- Yonkers City School District
- NCES district ID
- 3631920
- Math proficiency
- 41% ▼ -1.00%
- Reading proficiency
- 54% ▲ 14.00%
- Median HH income
- $58,042
- Composite
- 41.43/100
- National rank
- #3471
- State rank
- #413 of 590 in NY
Livability — Yonkers
- Score
- 68/100
- State rank
- #528
- US rank
- #9394
Category grades
Schools grade is shown separately in the Schools card above.
Census & demographics
- Census place
- Yonkers, NY
- County
- Westchester County · 709,332 people
- City population
- 212,407
- Metro
- New York-Newark-Jersey City, NY-NJ-PA
- Population (ZIP)
- 22,586
- Household income
- $89,773
- Rent vs Own
- Severe rent burden
- 1216.0
Population outlook (Westchester County) Hauer SSP2
- Today (2025)
- 1,028,035 people
- By 2030
- 1,051,636 · +2.3%
- By 2040
- 1,098,520 · +6.9%
- By 2050
- 1,136,044 · +10.5%
- By 2075
- 1,196,925 · +16.4%
- By 2100
- 1,175,147 · +14.3%
Race, ethnicity, and origin ACS 2023
- Neighborhood character
- Diverse neighborhood (Simpson 0.69)
- Race & ethnicity
- Hispanic / Latino 43% White 30% Black 19% Two or more races 16% Asian 5%
- Hispanic origin (detail)
- Mexican 5% Puerto Rican 9% Dominican 13%
- Common ancestry
- Romanian 4% Russian 2% Subsaharan African 1%
- Foreign-born
- 32% · Canada, Jamaica, China
- Languages at home
- 50% English-only · Spanish 37% Other Indo-European 5% Russian/Polish/Slavic 2%
Political lean MEDSL · Westchester
- 2024 margin
- Strong D (+26.3) · D 63.1% · R 36.9%
- 2008→2024 swing
- -1.3pp toward R · 2008: 27.6pp · 2024: 26.3pp
- All cycles
- 2024: D+26.3 2020: D+36.3 2016: D+32.8 2012: D+22.2 2008: D+27.6
Not yet ingested
- Civics
- —
Market trends
- HPI YoY
- ▼ -47.22%
- Current HPI
- 311.0396
- Rent YoY
- —
- Metro
- New York-Newark-Jersey City, NY-NJ-PA
- State GDP YoY
- ▲ 2.60%
- F500 in state
- 92
Industry mix (Fortune 500 HQ in NY)
| Industry | F500 HQs | Revenue |
|---|---|---|
| Financial Services | 10 | $950B |
|
||
| Consumer Goods | 9 | $162B |
|
||
| Insurance | 4 | $225B |
|
||
| Telecommunications | 2 | $144B |
|
||
| Pharmaceuticals | 2 | $112B |
|
||
| Media / Entertainment | 2 | $69B |
|
||
Price history
1 event — show timeline
- 2026-04-08 Listed $1,100,000 OneKey® MLS as Distributed by MLS Grid
Cash-flow waterfall
monthlySold comps — $/sqft
last 12 mo · ≤1 miLoading sold comps…