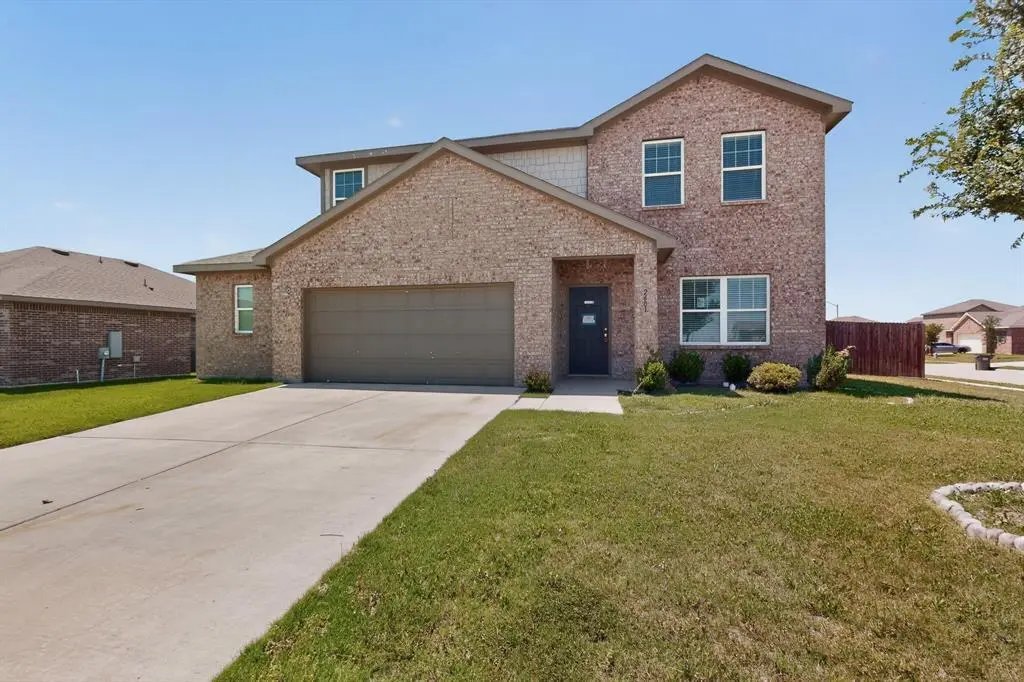
2601 Beech Creek Rd · Glenn Heights, TX
Flood risk 1/10 · Minimal
- FEMA flood zone
- X (unshaded)
- Chance of flooding over 30 yrs
- 0.0%
- Est. flood insurance / yr
- $507 – $1,088
Fire risk 4/10 · Minor
- Est. fire insurance / yr
- $1,222 – $2,270
Heat risk 7/10 · Major
- Hot days now (above 109°F)
- 7 days/yr
- Hot days in 30 yrs
- 24 days/yr
Wind risk 6/10 · Moderate
- Chance of severe wind over 30 yrs
- 27.0%
Air-quality risk 3/10 · Minor
- Unhealthy air days now
- 2 days/yr
- Unhealthy air days in 30 yrs
- 3 days/yr
Risk factors via First Street. Map © Google.
Why this score? — see what drove the D+ grade
The composite is a weighted blend of 9 inputs, each scored 0–100. Each bar is that input's sub-score; the figure is the points it added to the 100-point composite (weight × sub-score).
- Cash flow +13.0/30.0
- ARV discount +12.0/15.0
- 1% rule +4.6/10.0
- Condition / age +4.0/5.0
- DSCR +3.9/10.0
- Schools +3.5/10.0
- Rent growth +3.2/5.0
- Livability +3.0/5.0
- Appreciation +0.0/10.0
$295,750
🖨 Deal sheet (PDF) 📄 Offer letter ✓ Due diligence
Listing remarks
This well maintained, one owner home offers 2,148 square feet of functional living space with a versatile layout designed for everyday living. The interior features wood look flooring and a light filled open concept living area that connects seamlessly to the kitchen, creating a practical space for both daily use and entertaining. At the front of the home, a flexible bonus room provides options for a home office, secondary living area, or playroom. The kitchen includes stainless steel appliances, a center island, white cabinetry, and a walk in pantry, with a conveniently located half bath near the garage for guests. All bedrooms are located upstairs, allowing for separation between living a
Key facts
- Flexible bonus room
- Oversized shower
- Walk in pantry
Tags
Property features AI
Finance
- Other: Property listed as real estate owned (REO)
- Financial info: Listing accepts Conventional, FHA, and VA financing
- HOA & community: Mandatory HOA with annual fee (includes management fees); HOA managed by Vision Communities Management
Exterior
- Parking: Attached 2-car garage; 2 covered parking spaces; Garage faces front
- Utilities: City water; City sewer; Cable available
- Home design: Single-family residence; Two levels; Residential property
- Construction: Built in 2021; Brick and wood construction; Composition roof; Slab foundation
- Exterior features: Wood fencing; Lot less than 0.5 acre (approximately 0.223 acres)
Interior
- Kitchen: Dishwasher; Garbage disposal; Electric cooktop; Electric range; Pantry
- Bedrooms: Primary bedroom on level 2 with double shower, dual sinks and ensuite bath; Three additional bedrooms on level 2 (split-bedroom layout)
- Flooring: Carpet
- Bathrooms: 2 full bathrooms; 1 half bathroom
- Heating & cooling: Central heating (electric); Central air conditioning (electric)
- Interior features: Cable TV available; Pantry; Other
- Laundry & utility: Washer and dryer connections; Electric water heater
Neighborhood map
What this means for you Summary
Snapshot
- This is a 4-bed/2.5-bath single-family listed at $296k. Condition is rated good.
Deal economics
- At list price, monthly cash flow is $-16 ($-191/yr) — negative.
- To cash-flow at today's rent, offer at most $293k (1.0% below list).
- To meet the 1% rule (rent ≥ 1% of price), the offer needs to be $283k (4.2% below list).
- Recommended offer: $283k (4.2% below list) — sets the bar for 1% rule.
- Cap rate 6.2% vs local median 4.0% in Glenn Heights — top-decile yield for the area; either an underpriced asset or a hidden risk that comps aren't pricing in. Stress-test before assuming the spread holds.
Location & tenants
- Location reads 60/100 on livability (#1,051 in TX) — a middle-class / working-renter tenant base. Strengths: cost of living A+, housing A+, crime B+; Watch: amenities F, commute F, health & safety F.
- Red Oak ISD (suburban): math 40% / reading 36% proficiency, ranked #384 of 826 in TX (top 46%) — families likely to look elsewhere, expect single-tenant / working-renter base with shorter leases.
- Zoned schools: Shields El (math 34% / reading 36%, grade F, #1,965 of 4,322 statewide, top 46%, 563 students, 60% FRL); Red Oak Middle (math 38% / reading 32%, grade F, #842 of 1,662 statewide, top 51%, 1,546 students, 63% FRL); Red Oak H S (math 50% / reading 50%, grade D+, #495 of 1,632 statewide, top 30%, 2,160 students, 54% FRL) — zoned schools average 59% FRL vs 42% district-wide (18 pts higher); higher-poverty schools than district average — tighter screening recommended.
- Market conditions: Rents rising (+3.0%/yr); 575 active listings in the ZIP; 18 comparable units currently listed for rent nearby; rentals at typical pace (median 19d on market — plan ~3-4 weeks tenant-placement turnaround); solid renter incomes; 3,016 units permitted in Ellis County in 2024 (20 in 5+ unit buildings).
- This rent runs 34% of the median local income ($100k/yr) — at the standard rent-burdened threshold; future hikes will face affordability resistance.
Forward outlook
- Local home prices are declining (-3.0%/yr); year-one equity from $2k of loan paydown is wiped out by about $9k of value loss. Plan a longer hold.
- Ellis County population projected at +36% by 2050 — long-run rental-demand tailwind backs the buy-and-hold thesis.
Negotiation context
- It's been on market 15 days — a 2% lower offer ($291k) is reasonable based on typical stale-listing flexibility.
Risks & watch-outs
- Climate carrying-cost: major wind risk, 27% chance of damaging wind over 30y; extreme-heat days projected 7→24/yr by 2055 (HVAC capex compounding) — expect insurance premiums to compound above CPI over the hold.
Questions for the listing agent
- What do current leases actually rent for vs. the listed asking? Can we see a recent rent roll and the last 12 months of T-12 income?
- What does the HOA fee cover, when was the last increase, and are there any pending special assessments or reserve-fund shortfalls?
- Is there a deadline driving the sale (1031 exchange, divorce, estate, relocation)? That informs how much negotiation room exists.
- Schools are D-rated, which usually means shorter tenancies and higher turnover. Who's the typical renter profile here, and what's been the actual vacancy rate?
- The area grade is low — what's the realistic commute time and amenity access for the typical tenant pool here? Any planned neighborhood developments (good or bad) we should know about?
- What's the average days-on-market for RENTAL listings here right now (not sales)? A rising rental-DOM trend means longer vacancies and softer asking-rent achievability than the comps imply.
- What's the recent tenant-quality profile in this submarket — average credit score on applications, eviction rate, late-payment / NSF rate, and stable-employment percentage? A property-management company in the area should have these aggregated.
- How much new for-sale + rental construction is in the pipeline within 1–3 miles? Heavy new supply typically softens prices + rents 12–24 months out; constrained supply supports both.
Investment metrics
- 1% rule
- 0.96% ✗
- Cap rate
- 6.23%
- Cash-on-cash
- -0.23%
- DSCR
- 0.99
- GRM
- 8.7
CMA / ARV
- ARV (on-the-fly)
- $328,644
- Comps found
- 12
Show comp detail 12 sales within ~0.75 mi
| Address | Dist | Beds/Ba | Sqft | Sold | Price | $/sf | Match |
|---|---|---|---|---|---|---|---|
| 2430 Sagebrush Dr | 0.26mi | 4/2.5 | 2,100 (-2%) | 1mo | $340,000 | $162 | 83 |
| 2617 Sagebrush Dr | 0.12mi | 4/2.5 | 2,068 (-4%) | 7mo | $330,000 | $160 | 82 |
| 225 Pebblebrook Ln | 0.44mi | 4/2.5 | 2,125 (-1%) | 8mo | $325,000 | $153 | 71 |
| 305 Gypsum Ln | 0.24mi | 4/2.5 | 2,405 (+12%) | 2mo | $295,000 | $123 | 67 |
| 208 W Glen Meadow Dr | 0.54mi | 4/2.0 | 2,038 (-5%) | 3mo | $309,500 | $152 | 62 |
| 102 Hollywood Dr | 0.59mi | 3/2.0 (-1) | 2,135 (-1%) | 7mo | $249,000 | $117 | 58 |
| 404 Gypsum Ln | 0.27mi | 4/2.0 | 1,864 (-13%) | 9mo | $304,999 | $164 | 56 |
| 207 White Rock Ct | 0.38mi | 4/3.0 | 2,374 (+10%) | 10mo | $475,000 | $200 | 54 |
| 312 Stone Creek Blvd | 0.55mi | 3/2.5 (-1) | 2,008 (-6%) | 7mo | $289,900 | $144 | 53 |
| 114 Hollywood Dr | 0.67mi | 3/2.0 (-1) | 1,967 (-8%) | 1mo | $314,999 | $160 | 46 |
| 2615 Cannon Ct | 0.66mi | 4/2.5 | 2,371 (+10%) | 10mo | $340,000 | $143 | 44 |
| 2600 Centurion Rd | 0.63mi | 4/2.5 | 2,372 (+10%) | 12mo | $339,900 | $143 | 43 |
Match score weights: distance 35% · size 25% · config 20% · recency 20%. Top-matched comps best support the ARV.
Projected returns pro-forma
-3.0% appreciation · 2.99% rent growth · sell at horizon
- IRR
- -16.6%
- Equity multiple
- 0.41×
- Total profit
- $-48,795
- Equity at exit
- $44,097
- IRR
- -8.3%
- Equity multiple
- 0.48×
- Total profit
- $-43,216
- Equity at exit
- $25,571
Cash invested: $82,810 (down + closing). Projections, not guarantees.
Landlord ↔ Tenant lean methodology
- Overall (STATE)
- 87 Strongly Landlord-Friendly
- State Texas
- 87 Strongly Landlord-Friendly · R+5
- County
- — inherits STATE
- City
- — inherits STATE
ZIP-level market 75154
- Home prices YoY
- -18.5%
- Rents YoY
- 3.0%
- Active inventory
- 575
- Price-to-rent
- 8.7×
Monthly cashflow live
- Estimated rent
- $2,833 high interval (Pro) →
- Mortgage (P&I)
- −$1,551
- Tax from tax record
- −$542 /mo · $6,498/yr
- Insurance
- −$123
- HOA
- −$38
- Vacancy / Maint / Mgmt
- −$595
- Net cashflow
- $-16
Break-even live
Sensitivity live
| Price | -10% $151 | -5% $68 | +0% $-16 | +5% $-100 | +10% $-183 |
|---|---|---|---|---|---|
| Rent | -10% $-240 | -5% $-128 | +0% $-16 | +5% $96 | +10% $208 |
| Rate | -1.0pp $133 | -0.5pp $59 | base $-16 | +0.5pp $-93 | +1.0pp $-171 |
UW: 25.0% down · 7.5% · 30yr · 1.5% tax · 5.0% vac · 8.0% maint · 8.0% mgmt
Financing live
Cash to close
- Down payment
- $73,938
- Closing costs
- $8,872
- Reserves months
- —
- Total cash needed
- —
Loan-product check · same deal, 3 products live
Conventional
25% down · 7.5% · 30yr
- Down + closing
- —
- Monthly P&I
- —
- Monthly cashflow
- —
- DSCR
- —
- Eligible?
- —
Personal DTI + credit; lowest rate.
DSCR
20% down · 8.5% · 30yr
- Down + closing
- —
- Monthly P&I
- —
- Monthly cashflow
- —
- DSCR
- —
- Eligible?
- —
No personal income docs; deal must DSCR.
Hard money
10% down · 12.0% · 12mo
- Down + closing
- —
- Monthly P&I
- —
- Monthly cashflow
- —
- DSCR
- —
- Eligible?
- —
Short-term bridge; refi at stabilization.
Rent comps 18 comps
| Address | Beds | Baths | Sqft | Rent | $/sqft | DOM | Units | Dist |
|---|---|---|---|---|---|---|---|---|
| 2621 Sagebrush Dr Glenn Heights, TX | 5.0 | 3.0 | 2722 | $3,100 | $1.14 | 45d | 1 | 0.11mi |
| 2556 Sanders Creek Dr Glenn Heights, TX | 4.0 | 2.0 | 2095 | $2,545 | $1.21 | 45d | 1 | 0.14mi |
| 2636 Sagebrush Dr Glenn Heights, TX | 4.0 | 2.5 | 2136 | $2,995 | $1.40 | 0d | 1 | 0.15mi |
| 2609 Sanders Creek Dr Glenn Heights, TX | 4.0 | 2.5 | 2095 | $2,329 | $1.11 | 45d | 1 | 0.16mi |
| 2421 Frio River Rd Glenn Heights, TX | 4.0 | 2.0 | 1816 | $2,585 | $1.42 | 19d | 1 | 0.38mi |
| 317 W Glen Meadow Dr Glenn Heights, TX | 3.0 | 2.0 | 1433 | $2,070 | $1.44 | 26d | 1 | 0.54mi |
| 209 Wilshire Dr Glenn Heights, TX | 3.0 | 2.0 | 1433 | $2,355 | $1.64 | 7d | 1 | 0.72mi |
| 601 Shady Meadow Ln Glenn Heights, TX | 4.0 | 2.0 | 2162 | $2,545 | $1.18 | 22d | 1 | 0.90mi |
| 700 Shady Meadow Ln Glenn Heights, TX | 4.0 | 2.0 | 2135 | $2,595 | $1.22 | 0d | 1 | 0.91mi |
| 701 Shady Meadow Ln Glenn Heights, TX | 3.0 | 2.0 | 1797 | $2,350 | $1.31 | 0d | 1 | 0.94mi |
| 2521 Dunbarton Dr Red Oak, TX | 4.0 | 3.5 | 2830 | $3,280 | $1.16 | 1d | 1 | 0.95mi |
| 2521 Dunbarton Dr Red Oak, TX | 4.0 | 3.5 | 2830 | $3,280 | $1.16 | 13d | 1 | 0.95mi |
| 300 Clayton St Red Oak, TX | 4.0 | 3.0 | 2460 | $3,100 | $1.26 | 9d | 1 | 0.95mi |
| 417 W Milas Ln Glenn Heights, TX | 4.0 | 2.0 | 2480 | $3,850 | $1.55 | 45d | 1 | 1.06mi |
| 1957 S Westmoreland Rd Glenn Heights, TX | 3.0 | 1.0 | 1652 | $2,500 | $1.51 | 0d | 1 | 1.13mi |
| 1902 Purdue Dr Glenn Heights, TX | 4.0 | 2.0 | 2427 | $2,545 | $1.05 | 19d | 1 | 1.28mi |
| 631 Magnolia Ln Glenn Heights, TX | 3.0 | 2.5 | 2814 | $2,430 | $0.86 | 26d | 1 | 1.50mi |
| 631 Magnolia Ln Glenn Heights, TX | 3.0 | 2.5 | 2814 | $2,576 | $0.92 | 45d | 1 | 1.50mi |
HOA detail
- Monthly dues
- $38 · $456/yr
Listing history 4 events
-
2026-06-02status $295,750 Pending 15 DOM
-
2026-06-01days on market $295,750 Active 15 DOM
-
2026-05-31days on market $295,750 Active 14 DOM
-
2026-05-17$295,750 Active
ⓘ Source: listings_history table (triggers on properties + properties_extension) + one-shot
backfill from property_details.listing_events for pre-trigger history.
Tax reassessment forecast TX · Resets to sale price
- Current annual tax
- $6,498 · $542/mo
- Projected year-2 tax
- $6,498 · $542/mo
- Expected delta
- $0/yr ($0/mo · 0.0%)
ⓘ Screening estimate from a state-policy table — verify with the county assessor before closing.
Climate risk First Street
- Flood 1/10 Low FEMA zone X (unshaded) · 0% chance over 30 yrs
- Wildfire 4/10 Moderate
- Heat 7/10 Severe 7 d/yr ≥109°F today · 24 d/yr by 30 yrs out
- Wind 6/10 Major 27% chance of damaging wind over 30 yrs
- Air quality 3/10 Moderate 2 unhealthy d/yr today · 3 by 30 yrs out
Nearby sold comps map
Loading sold comps map…
Walkable amenities ~0.75 mi
Loading nearby amenities…
Taxation est. · year 1
- Rental income
- $33,992
- − Mortgage interest
- −$16,567
- − Property taxes
- −$6,498
- − Insurance
- −$1,479
- − Repairs & maintenance
- −$2,719
- − Management
- −$2,719
- − HOA
- −$456
- − Depreciation
- −$8,604
- Taxable loss
- −$5,050
- Est. tax savings @ 24.0%
- +$1,212
- After-tax cash flow
- $1,021/yr
For passive investors: Depreciation is non-cash, so a rental often shows a tax loss while cash-flowing — sheltering income. Rental losses are passive: they offset passive income freely, and up to $25,000/yr can offset ordinary (W-2) income if you actively participate and your MAGI is under $100k (phasing out to $0 by $150k); unused losses carry forward. On sale, claimed depreciation is recaptured at up to 25%, and gains may owe capital-gains tax (a 1031 exchange can defer both). Figures are a year-1 estimate at your 24.0% rate — not tax advice; consult a CPA.
Condition & rehab AI · 12 photos
This well-maintained, one-owner home offers a good condition with a good ROI potential for both resale and rental.
Value-add opportunities
- Both Paint exterior — Enhances curb appeal and value
- Both Replace carpet with hardwood — Improves aesthetics and increases value
- Both Install smart home devices — Enhances convenience and marketability
Renovation cost estimate screening
Value-add ROI direction
- Both Paint exterior — Enhances curb appeal and value ↑
- Both Replace carpet with hardwood — Improves aesthetics and increases value ↑
- Both Install smart home devices — Enhances convenience and marketability ↑
ⓘ Cost ranges are severity-bucket heuristics (US national rule-of-thumb). Get contractor quotes + a written scope before underwriting a rehab budget.
Schools (NCES district)
- District
- Red Oak ISD
- NCES district ID
- 4836660
- Math proficiency
- 40% ▼ -12.00%
- Reading proficiency
- 36% ▼ -9.00%
- Median HH income
- $71,110
- Composite
- 34.88/100
- National rank
- #5084
- State rank
- #384 of 826 in TX
Livability — Glenn Heights
- Score
- 60/100
- State rank
- #1051
- US rank
- #18686
Category grades
Schools grade is shown separately in the Schools card above.
Census & demographics
- Census place
- Glenn Heights, TX
- County
- Ellis County · 199,237 people
- Metro
- Dallas-Fort Worth-Arlington, TX
- Population (ZIP)
- 52,516
- Household income
- $100,388
- Rent vs Own
- Severe rent burden
- 1081.0
Population outlook (Ellis County) Hauer SSP2
- Today (2025)
- 194,556 people
- By 2030
- 209,679 · +7.8%
- By 2040
- 238,837 · +22.8%
- By 2050
- 265,451 · +36.4%
- By 2075
- 326,571 · +67.9%
- By 2100
- 362,156 · +86.1%
Race, ethnicity, and origin ACS 2023
- Neighborhood character
- Diverse neighborhood (Simpson 0.69)
- Race & ethnicity
- White 39% Black 30% Hispanic / Latino 27% Two or more races 12% Asian 1% Native American 1%
- Hispanic origin (detail)
- Mexican 25%
- Common ancestry
- Italian 2% Slovak 1%
- Foreign-born
- 9% · Canada, Jamaica
- Languages at home
- 80% English-only · Spanish 18%
Political lean MEDSL · Ellis
- 2024 margin
- Solid R (+31.1) · D 34.0% · R 65.1%
- 2008→2024 swing
- +11.2pp toward D · 2008: -42.2pp · 2024: -31.1pp
- All cycles
- 2024: R+31.1 2020: R+34.1 2016: R+45.4 2012: R+47.5 2008: R+42.2
Not yet ingested
- Civics
- —
Market trends
- HPI YoY
- ▼ -67.06%
- Current HPI
- 294.5836
- Rent YoY
- ▲ 2.99%
- Metro
- Dallas-Fort Worth-Arlington, TX
- State GDP YoY
- ▲ 3.95%
- F500 in state
- 110
Industry mix (Fortune 500 HQ in TX)
| Industry | F500 HQs | Revenue |
|---|---|---|
| Energy | 16 | $1,198B |
|
||
| Technology | 5 | $198B |
|
||
| Engineering / Construction | 4 | $72B |
|
||
| Energy Services | 3 | $60B |
|
||
| Utilities | 3 | $41B |
|
||
| Healthcare | 2 | $330B |
|
||
Price history
1 event — show timeline
- 2026-05-17 Listed $295,750 NTREIS
Property tax history
+78.6%/yrLatest (2025): $6,498 · -0.6% YoY. Source: county tax records.
Cash-flow waterfall
monthlySold comps — $/sqft
last 12 mo · ≤1 miLoading sold comps…