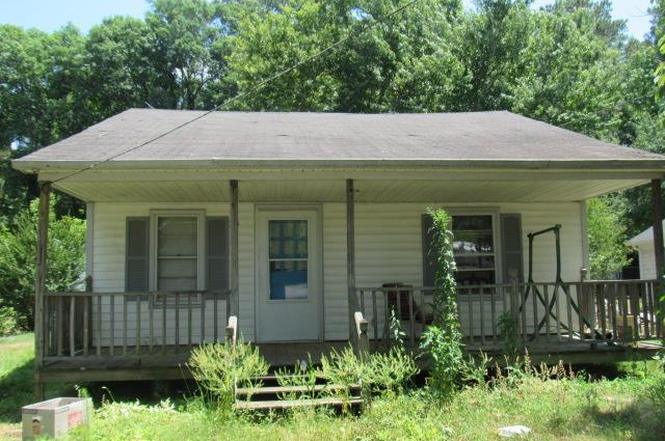
335 Millennium Rd · Aulander, NC
Flood risk 1/10 · Minimal
- FEMA flood zone
- X (unshaded)
- Chance of flooding over 30 yrs
- 0.0%
- Est. flood insurance / yr
- $507 – $1,088
Fire risk 5/10 · Moderate
- Est. fire insurance / yr
- $906 – $1,684
Heat risk 8/10 · Major
- Hot days now (above 106°F)
- 7 days/yr
- Hot days in 30 yrs
- 16 days/yr
Wind risk 7/10 · Major
- Chance of severe wind over 30 yrs
- 75.0%
Air-quality risk 1/10 · Minimal
- Unhealthy air days now
- 0 days/yr
- Unhealthy air days in 30 yrs
- 0 days/yr
Risk factors via First Street. Map © Google.
Why this score? — see what drove the B grade
The composite is a weighted blend of 9 inputs, each scored 0–100. Each bar is that input's sub-score; the figure is the points it added to the 100-point composite (weight × sub-score).
- Cash flow +30.0/30.0
- 1% rule +10.0/10.0
- DSCR +10.0/10.0
- ARV discount +7.5/15.0
- Appreciation +6.2/10.0
- Livability +2.8/5.0
- Rent growth +2.5/5.0
- Condition / age +2.5/5.0
- Schools +1.6/10.0
$39,900
🖨 Deal sheet (PDF) 📄 Offer letter ✓ Due diligence
Listing remarks
NEEDS SOME WORK. GREAT PROPERTY FOR A INVESTER.
Key facts
- 0.24 acre lot
- Built 1948
- Listed 3 days
Property features AI
Exterior
- Parking: Gravel parking
- Utilities: Private well water; Septic tank sewer
- Home design: Single-story residential property; Residential/Vacation subtype
- Construction: Vinyl siding; Composition roof; Built with a slab or unspecified foundation
- Exterior features: Front porch; Storage structure on property; Has a view
Interior
- Kitchen: Electric oven, electric range, refrigerator
- Flooring: Carpet; Vinyl
- Bathrooms: One full bathroom
- Heating & cooling: Heat pump; Geothermal heating; Central air conditioning
- Interior features: Electric oven, electric range, refrigerator; No fireplace; Five total rooms; No basement
Neighborhood map
What this means for you Summary
Snapshot
- This is a 2-bed/1.0-bath single-family listed at $40k.
Deal economics
- At list price, monthly cash flow is $372 ($4k/yr) — positive.
- The deal already cash-flows at list — no discount required.
- Meets the 1% rule at list price ($824 rent vs $40k).
Location & tenants
- Location reads 56/100 on livability (#623 in NC) — a working-class tenant base; expect higher turnover. Strengths: cost of living A+, housing B; Watch: crime F, amenities F, commute F.
- Hertford County Schools (town): math 14% / reading 26% proficiency, ranked #171 of 178 in NC (top 96%) — low school quality limits family demand, transient renter base, plan for 1-2y turnover; 74% free/reduced lunch — lower-income household profile, screen leases tightly.
- Zoned schools: Bearfield Primary (math 27% / reading 32%, grade F, #975 of 1,410 statewide, top 71%, 560 students, 100% FRL); Hertford County Middle (math 6% / reading 26%, grade F, #455 of 475 statewide, top 96%, 536 students, 99% FRL); Hertford County High (math 12% / reading 12%, grade F, #518 of 535 statewide, top 97%, 573 students, 100% FRL) — zoned schools average 99% FRL vs 74% district-wide (26 pts higher); higher-poverty schools than district average — tighter screening recommended.
- Market conditions: 7 active listings in the ZIP; 5 units permitted in Hertford County in 2024 (0 in 5+ unit buildings).
Forward outlook
- In year one you build about $1k of equity ($276 loan paydown + $993 appreciation (2.5% local appreciation)).
- Hertford County population projected at -15% by 2050 — secular population decline; favor cash flow + early exit over multi-decade hold.
- At projected returns (2.5% appreciation + 3.0% rent growth), your $11k cash investment doubles in ~2 years — after that, you're playing with house money.
Negotiation context
- Only 3 days on market — expect competitive offers; lowballing is unlikely to land.
Risks & watch-outs
- Watch-outs: built in 1948 — expect roof / HVAC / electrical / plumbing capex.
- Climate carrying-cost: major wind risk, 75% chance of damaging wind over 30y; moderate wildfire risk; extreme-heat days projected 7→16/yr by 2055 (HVAC capex compounding) — expect insurance premiums to compound above CPI over the hold.
Questions for the listing agent
- Built in 1948 — when were the roof, HVAC, electrical panel, plumbing, and water heater last replaced?
- Is there a deadline driving the sale (1031 exchange, divorce, estate, relocation)? That informs how much negotiation room exists.
- Schools are F-rated, which usually means shorter tenancies and higher turnover. Who's the typical renter profile here, and what's been the actual vacancy rate?
- Crime grade is F in this area — have there been break-ins, vandalism, or insurance claims at this property in the last 3 years? What carrier currently insures it and at what premium?
- What's the average days-on-market for RENTAL listings here right now (not sales)? A rising rental-DOM trend means longer vacancies and softer asking-rent achievability than the comps imply.
- What's the recent tenant-quality profile in this submarket — average credit score on applications, eviction rate, late-payment / NSF rate, and stable-employment percentage? A property-management company in the area should have these aggregated.
- How much new for-sale + rental construction is in the pipeline within 1–3 miles? Heavy new supply typically softens prices + rents 12–24 months out; constrained supply supports both.
Investment metrics
- 1% rule
- 2.07% ✓
- Cap rate
- 17.48%
- Cash-on-cash
- 39.95%
- DSCR
- 2.78
- GRM
- 4.0
CMA / ARV
No comps found within radius.
Projected returns pro-forma
2.49% appreciation · 3.0% rent growth · sell at horizon
- IRR
- 44.7%
- Equity multiple
- 3.46×
- Total profit
- $27,439
- Equity at exit
- $16,804
- IRR
- 45.0%
- Equity multiple
- 6.90×
- Total profit
- $65,867
- Equity at exit
- $25,045
Cash invested: $11,172 (down + closing). Projections, not guarantees.
Landlord ↔ Tenant lean methodology
- Overall (STATE)
- 85 Strongly Landlord-Friendly
- State North Carolina
- 85 Strongly Landlord-Friendly · R+3
- County
- — inherits STATE
- City
- — inherits STATE
ZIP-level market 27805
- Home prices YoY
- 1.8%
- Active inventory
- 7
- Price-to-rent
- 4.0×
Monthly cashflow live
- Estimated rent
- $824 medium interval (Pro) →
- Mortgage (P&I)
- −$209
- Tax from tax record
- −$53 /mo · $642/yr
- Insurance
- −$17
- HOA
- −$0
- Vacancy / Maint / Mgmt
- −$173
- Net cashflow
- $372
Break-even live
Sensitivity live
| Price | -10% $394 | -5% $383 | +0% $372 | +5% $361 | +10% $349 |
|---|---|---|---|---|---|
| Rent | -10% $307 | -5% $339 | +0% $372 | +5% $404 | +10% $437 |
| Rate | -1.0pp $392 | -0.5pp $382 | base $372 | +0.5pp $362 | +1.0pp $351 |
UW: 25.0% down · 7.5% · 30yr · 1.5% tax · 5.0% vac · 8.0% maint · 8.0% mgmt
Financing live
Cash to close
- Down payment
- $9,975
- Closing costs
- $1,197
- Reserves months
- —
- Total cash needed
- —
Loan-product check · same deal, 3 products live
Conventional
25% down · 7.5% · 30yr
- Down + closing
- —
- Monthly P&I
- —
- Monthly cashflow
- —
- DSCR
- —
- Eligible?
- —
Personal DTI + credit; lowest rate.
DSCR
20% down · 8.5% · 30yr
- Down + closing
- —
- Monthly P&I
- —
- Monthly cashflow
- —
- DSCR
- —
- Eligible?
- —
No personal income docs; deal must DSCR.
Hard money
10% down · 12.0% · 12mo
- Down + closing
- —
- Monthly P&I
- —
- Monthly cashflow
- —
- DSCR
- —
- Eligible?
- —
Short-term bridge; refi at stabilization.
Listing history 4 events
-
2026-06-18statusdays on market $39,900 Pending 3 DOM
-
2026-06-17days on market $39,900 Active 2 DOM
-
2026-06-16remarks 48-char remark
-
2026-06-16$39,900 Active 1 DOM
ⓘ Source: listings_history table (triggers on properties + properties_extension) + one-shot
backfill from property_details.listing_events for pre-trigger history.
Tax reassessment forecast NC · Resets to sale price
- Current annual tax
- $642 · $53/mo
- Projected year-2 tax
- $642 · $53/mo
- Expected delta
- $0/yr ($0/mo · 0.0%)
ⓘ Screening estimate from a state-policy table — verify with the county assessor before closing.
Climate risk First Street
- Flood 1/10 Low FEMA zone X (unshaded) · 0% chance over 30 yrs
- Wildfire 5/10 Major
- Heat 8/10 Severe 7 d/yr ≥106°F today · 16 d/yr by 30 yrs out
- Wind 7/10 Severe 75% chance of damaging wind over 30 yrs
- Air quality 1/10 Low 0 unhealthy d/yr today · 0 by 30 yrs out
Nearby sold comps map
Loading sold comps map…
Walkable amenities ~0.75 mi
Loading nearby amenities…
Taxation est. · year 1
- Rental income
- $9,892
- − Mortgage interest
- −$2,235
- − Property taxes
- −$642
- − Insurance
- −$200
- − Repairs & maintenance
- −$791
- − Management
- −$791
- − Depreciation
- −$1,161
- Taxable income
- $4,073
- Est. tax owed @ 24.0%
- −$977
- After-tax cash flow
- $3,485/yr
For passive investors: Depreciation is non-cash, so a rental often shows a tax loss while cash-flowing — sheltering income. Rental losses are passive: they offset passive income freely, and up to $25,000/yr can offset ordinary (W-2) income if you actively participate and your MAGI is under $100k (phasing out to $0 by $150k); unused losses carry forward. On sale, claimed depreciation is recaptured at up to 25%, and gains may owe capital-gains tax (a 1031 exchange can defer both). Figures are a year-1 estimate at your 24.0% rate — not tax advice; consult a CPA.
Schools (NCES district)
- District
- Hertford County Schools
- NCES district ID
- 3702160
- Math proficiency
- 14% ▼ -3.00%
- Reading proficiency
- 26% ▼ -1.00%
- Median HH income
- $33,467
- Composite
- 16.29/100
- National rank
- #9213
- State rank
- #171 of 178 in NC
Livability — Aulander
- Score
- 56/100
- State rank
- #623
- US rank
- #22650
Category grades
Schools grade is shown separately in the Schools card above.
Census & demographics
- Population (ZIP)
- 3,187
Population outlook (Hertford County) Hauer SSP2
- Today (2025)
- 23,401 people
- By 2030
- 22,708 · -3.0%
- By 2040
- 21,227 · -9.3%
- By 2050
- 19,942 · -14.8%
- By 2075
- 17,844 · -23.7%
- By 2100
- 15,148 · -35.3%
Race, ethnicity, and origin ACS 2023
- Neighborhood character
- Majority Black (61%)
- Race & ethnicity
- Black 61% White 37% Two or more races 2%
- Common ancestry
- Italian 1% Danish 1%
- Foreign-born
- 1% · Canada
Political lean MEDSL · Hertford
- 2024 margin
- Strong D (+26.8) · D 63.0% · R 36.3%
- 2008→2024 swing
- -14.8pp toward R · 2008: 41.5pp · 2024: 26.8pp
- All cycles
- 2024: D+26.8 2020: D+34.0 2016: D+37.7 2012: D+44.3 2008: D+41.5
Not yet ingested
- Civics
- —
Market trends
- HPI YoY
- ▲ 2.49%
- Current HPI
- 142.9672
- Rent YoY
- —
- Metro
- —
- State GDP YoY
- ▲ 3.28%
- F500 in state
- 26
Industry mix (Fortune 500 HQ in NC)
| Industry | F500 HQs | Revenue |
|---|---|---|
| Financial Services | 2 | $213B |
|
||
| Retail | 2 | $95B |
|
||
| Industrial Conglomerate | 1 | $38B |
|
||
| Metals / Steel | 1 | $35B |
|
||
| Utilities | 1 | $30B |
|
||
| Industrial Machinery | 1 | $19B |
|
||
Price history
1 event — show timeline
- 2026-06-15 Listed $39,900 RVLG
Property tax history
+7.5%/yrLatest (2025): $642 · +2.4% YoY. Source: county tax records.
Cash-flow waterfall
monthlySold comps — $/sqft
last 12 mo · ≤1 miLoading sold comps…