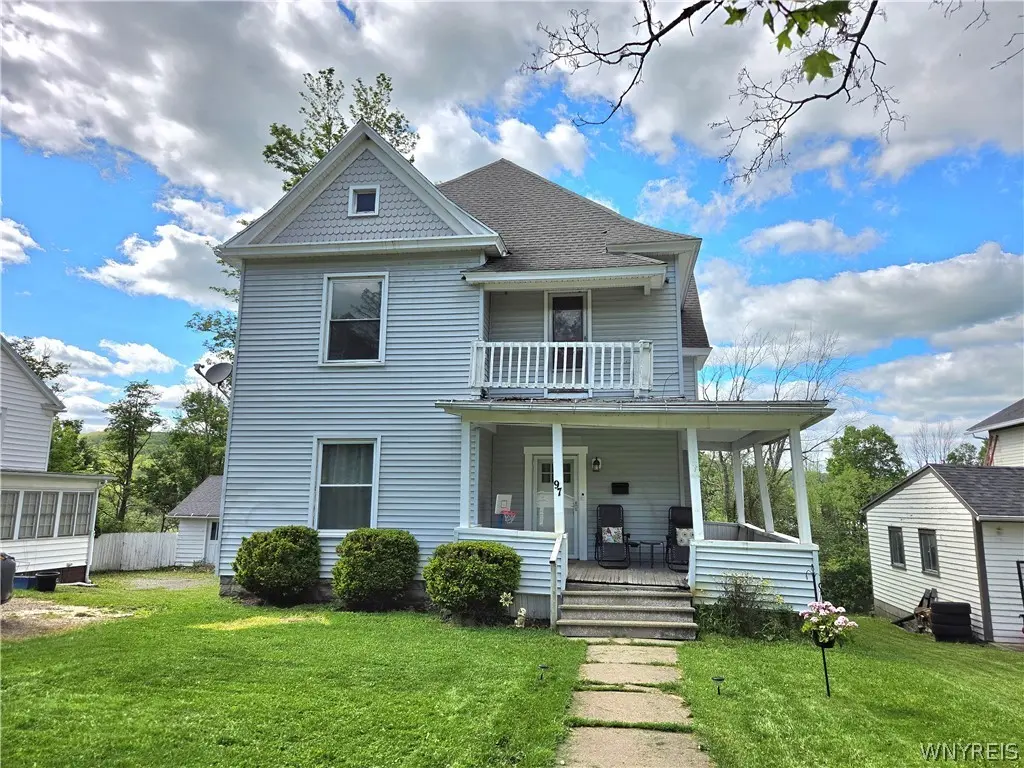
97 W Main St · Cuba, NY
Flood risk 1/10 · Minimal
- FEMA flood zone
- X
- Chance of flooding over 30 yrs
- 0.0%
- Est. flood insurance / yr
- $473 – $860
Fire risk 1/10 · Minimal
- Est. fire insurance / yr
- $691 – $1,283
Heat risk 2/10 · Minimal
- Hot days now (above 89°F)
- 7 days/yr
- Hot days in 30 yrs
- 17 days/yr
Wind risk 1/10 · Minimal
- Chance of severe wind over 30 yrs
- —
Air-quality risk 1/10 · Minimal
- Unhealthy air days now
- 0 days/yr
- Unhealthy air days in 30 yrs
- 0 days/yr
Risk factors via First Street. Map © Google.
Why this score? — see what drove the C- grade
The composite is a weighted blend of 9 inputs, each scored 0–100. Each bar is that input's sub-score; the figure is the points it added to the 100-point composite (weight × sub-score).
- ARV discount +15.0/15.0
- Appreciation +8.6/10.0
- Cash flow +7.8/30.0
- Schools +4.5/10.0
- 1% rule +3.8/10.0
- Livability +3.7/5.0
- Rent growth +2.5/5.0
- Condition / age +2.5/5.0
- DSCR +1.9/10.0
$145,000
🖨 Deal sheet 📄 Offer letter ✓ Due diligence
Listing remarks MLS
Four bedroom two full bath in the village. Beautiful casings, moldings, wainscot, pocket doors. This home was formerly a duplex and could easily be again if you choose the rent the upstairs and live on first floor. Second floor former kitchen has been plumbed for to become upstairs laundry. Some new windows, newer roof, vinyl siding new heating system and hot water heater. Beautiful hardwood floors have been professionally restored throughout this home. Newly remodeled kitchen and bath. Some more fresh paint and some finishing touches and this would be a lovely family home.
Key facts
- 0.3 acre lot
- Built 1900
- Listed 16 days
Property features AI
Exterior
- Parking: No garage
- Utilities: Public water connected; Sewer connected; Electric service (standard utilities)
- Home design: 2-story house; Existing property
- Construction: Vinyl siding; Stone foundation
- Exterior features: Dirt driveway; Gravel driveway; Rectangular residential lot; City street frontage
Interior
- Kitchen: Free-standing range; Gas oven; Gas range; Oven; Refrigerator
- Bedrooms: Total rooms: 8 (includes living and family rooms)
- Flooring: Hardwood; Vinyl; Varies
- Bathrooms: 2 full bathrooms; 1 bathroom on the main level
- Heating & cooling: Gas heating; Forced-air heating
- Interior features: Separate/formal dining room; Separate/formal living room; Galley kitchen; Full basement; One fireplace
- Laundry & utility: Gas water heater
Neighborhood map
What this means for you Summary
Snapshot
- This is a 4-bed/2.0-bath single-family listed at $145k.
Deal economics
- At list price, monthly cash flow is $-158 ($-2k/yr) — negative.
- To cash-flow at today's rent, offer at most $117k (19.3% below list).
- To meet the 1% rule (rent ≥ 1% of price), the offer needs to be $128k (11.9% below list).
- Recommended offer: $117k (19.3% below list) — sets the bar for cash-flow.
- Cap rate 5.0% vs local median 3.1% in Cuba — top-decile yield for the area; either an underpriced asset or a hidden risk that comps aren't pricing in. Stress-test before assuming the spread holds.
Location & tenants
- Location reads 73/100 on livability (#309 in NY) — a middle-class / working-renter tenant base. Strengths: cost of living A+, housing A+, health & safety A; Watch: employment D, amenities F, commute F.
- Cuba-Rushford Central School District (rural): math 44% / reading 61% proficiency, ranked #350 of 590 in NY (top 59%) — acceptable for families but not a draw, mixed tenant base, ~2y average lease.
- Market conditions: 42 active listings in the ZIP; 87 units permitted in Allegany County in 2024 (0 in 5+ unit buildings).
Forward outlook
- In year one you build about $11k of equity ($1k loan paydown + $10k appreciation (7.2% local appreciation)).
- Allegany County population projected at -26% by 2050 — secular population decline; favor cash flow + early exit over multi-decade hold.
- By year 4, paydown + projected appreciation supports a ~$39k cash-out refi (75% LTV) — recoverable capital for the next deal without selling this one.
Negotiation context
- It's been on market 16 days — a 2% lower offer ($143k) is reasonable based on typical stale-listing flexibility.
- 4 sale attempts since 5y ago with the ask held roughly flat each time — persistent listings suggest the price (not the market) is what's stuck; bring a comps-based counter.
- Current owner paid $72k; list at $145k implies a 101% gain — meaningful room to come down on a strong offer.
Risks & watch-outs
- Watch-outs: property tax is 2.9% of price; built in 1900 — expect roof / HVAC / electrical / plumbing capex.
Questions for the listing agent
- What do current leases actually rent for vs. the listed asking? Can we see a recent rent roll and the last 12 months of T-12 income?
- Built in 1900 — when were the roof, HVAC, electrical panel, plumbing, and water heater last replaced?
- Property tax is high relative to price — has the assessment been appealed recently, and will the sale trigger a re-assessment?
- Is there a deadline driving the sale (1031 exchange, divorce, estate, relocation)? That informs how much negotiation room exists.
- Schools are B-rated — typically a magnet for longer-tenancy family renters. What's the average tenant stay here, and is there a school-zone premium baked into asking?
- What's the average days-on-market for RENTAL listings here right now (not sales)? A rising rental-DOM trend means longer vacancies and softer asking-rent achievability than the comps imply.
- What's the recent tenant-quality profile in this submarket — average credit score on applications, eviction rate, late-payment / NSF rate, and stable-employment percentage? A property-management company in the area should have these aggregated.
- How much new for-sale + rental construction is in the pipeline within 1–3 miles? Heavy new supply typically softens prices + rents 12–24 months out; constrained supply supports both.
Investment metrics
- 1% rule
- 0.88% ✗
- Cap rate
- 4.98%
- Cash-on-cash
- -4.68%
- DSCR
- 0.79
- GRM
- 9.5
CMA / ARV
- ARV (on-the-fly)
- $180,072
- Comps found
- 2
Show comp detail 2 sales within ~0.75 mi
| Address | Dist | Beds/Ba | Sqft | Sold | Price | $/sf | Match |
|---|---|---|---|---|---|---|---|
| 7 Maple St | 0.36mi | 5/2.0 (+1) | 3,328 (+13%) | 2mo | $150,000 | $45 | 56 |
| 101 E Main St | 0.71mi | 4/2.5 | 2,524 (-14%) | 19mo | $154,000 | $61 | 25 |
Match score weights: distance 35% · size 25% · config 20% · recency 20%. Top-matched comps best support the ARV.
Projected returns pro-forma
7.17% appreciation · 3.0% rent growth · sell at horizon
- IRR
- 14.5%
- Equity multiple
- 2.04×
- Total profit
- $42,181
- Equity at exit
- $102,082
- IRR
- 14.5%
- Equity multiple
- 4.21×
- Total profit
- $130,252
- Equity at exit
- $195,377
Cash invested: $40,600 (down + closing). Projections, not guarantees.
Landlord ↔ Tenant lean methodology
- Overall (STATE)
- 15 Strongly Tenant-Friendly
- State New York
- 15 Strongly Tenant-Friendly · D+10
- County
- — inherits STATE
- City
- — inherits STATE
ZIP-level market 14727
- Home prices YoY
- 2.5%
- Active inventory
- 42
- Price-to-rent
- 9.5×
Monthly cashflow live
- Estimated rent
- $1,277 medium interval (Pro) →
- Mortgage (P&I)
- −$760
- Tax from tax record
- −$346 /mo · $4,158/yr
- Insurance
- −$60
- HOA
- −$0
- Vacancy / Maint / Mgmt
- −$268
- Net cashflow
- $-158
Break-even live
UW: 25.0% down · 7.5% · 30yr · 1.5% tax · 5.0% vac · 8.0% maint · 8.0% mgmt
Financing live
Cash to close
- Down payment
- $36,250
- Closing costs
- $4,350
- Reserves months
- —
- Total cash needed
- —
Loan-product check · same deal, 3 products live
Conventional
25% down · 7.5% · 30yr
- Down + closing
- —
- Monthly P&I
- —
- Monthly cashflow
- —
- DSCR
- —
- Eligible?
- —
Personal DTI + credit; lowest rate.
DSCR
20% down · 8.5% · 30yr
- Down + closing
- —
- Monthly P&I
- —
- Monthly cashflow
- —
- DSCR
- —
- Eligible?
- —
No personal income docs; deal must DSCR.
Hard money
10% down · 12.0% · 12mo
- Down + closing
- —
- Monthly P&I
- —
- Monthly cashflow
- —
- DSCR
- —
- Eligible?
- —
Short-term bridge; refi at stabilization.
Listing history 12 events
-
2026-06-18days on market $145,000 Active 16 DOM
-
2026-06-17days on market $145,000 Active 15 DOM
-
2026-06-16days on market $145,000 Active 14 DOM
-
2026-06-15days on market $145,000 Active 13 DOM
-
2026-06-13days on market $145,000 Active 11 DOM
-
2026-06-12days on market $145,000 Active 10 DOM
-
2026-06-09days on market $145,000 Active 7 DOM
-
2026-06-08days on market $145,000 Active 6 DOM
-
2026-06-07days on market $145,000 Active 5 DOM
-
2026-06-07days on market $145,000 Active 4 DOM
-
2026-06-02remarks 699-char remark
-
2026-06-02$145,000 Active 1 DOM
ⓘ Source: listings_history table (triggers on properties + properties_extension) + one-shot
backfill from property_details.listing_events for pre-trigger history.
Tax reassessment forecast NY · Partial reset (capped growth)
- Current annual tax
- $4,158 · $346/mo
- Projected year-2 tax
- $4,158 · $346/mo
- Expected delta
- $0/yr ($0/mo · 0.0%)
ⓘ Screening estimate from a state-policy table — verify with the county assessor before closing.
Climate risk First Street
- Flood 1/10 Low FEMA zone X · 0% chance over 30 yrs
- Wildfire 1/10 Low
- Heat 2/10 Low 7 d/yr ≥89°F today · 17 d/yr by 30 yrs out
- Wind 1/10 Low
- Air quality 1/10 Low 0 unhealthy d/yr today · 0 by 30 yrs out
Nearby sold comps map
Loading sold comps map…
Walkable amenities ~0.75 mi
Loading nearby amenities…
Taxation est. · year 1
- Rental income
- $15,328
- − Mortgage interest
- −$8,122
- − Property taxes
- −$4,158
- − Insurance
- −$725
- − Repairs & maintenance
- −$1,226
- − Management
- −$1,226
- − Depreciation
- −$4,218
- Taxable loss
- −$4,348
- Est. tax savings @ 24.0%
- +$1,044
- After-tax cash flow
- $-855/yr
For passive investors: Depreciation is non-cash, so a rental often shows a tax loss while cash-flowing — sheltering income. Rental losses are passive: they offset passive income freely, and up to $25,000/yr can offset ordinary (W-2) income if you actively participate and your MAGI is under $100k (phasing out to $0 by $150k); unused losses carry forward. On sale, claimed depreciation is recaptured at up to 25%, and gains may owe capital-gains tax (a 1031 exchange can defer both). Figures are a year-1 estimate at your 24.0% rate — not tax advice; consult a CPA.
Schools (NCES district)
- District
- Cuba-Rushford Central School District
- NCES district ID
- 3632010
- Math proficiency
- 44% ▼ -18.00%
- Reading proficiency
- 61% ▲ 5.00%
- Median HH income
- $47,256
- Composite
- 44.53/100
- National rank
- #2792
- State rank
- #350 of 590 in NY
Livability — Cuba
- Score
- 73/100
- State rank
- #309
- US rank
- #5131
Category grades
Schools grade is shown separately in the Schools card above.
Census & demographics
- Census place
- Cuba, NY
- Population (ZIP)
- 5,039
Population outlook (Allegany County) Hauer SSP2
- Today (2025)
- 45,362 people
- By 2030
- 43,078 · -5.0%
- By 2040
- 38,031 · -16.2%
- By 2050
- 33,634 · -25.9%
- By 2075
- 25,285 · -44.3%
- By 2100
- 18,902 · -58.3%
Race, ethnicity, and origin ACS 2023
- Neighborhood character
- Predominantly White (95%)
- Race & ethnicity
- White 95% Two or more races 2% Hispanic / Latino 2% Asian 1%
- Common ancestry
- Romanian 5% Iranian 3% Polish 2%
- Foreign-born
- 2% · Canada
- Languages at home
- 97% English-only · German/W. Germanic 2% Spanish 1%
Political lean MEDSL · Allegany
- 2024 margin
- Solid R (+43.2) · D 28.4% · R 71.6%
- 2008→2024 swing
- -21.5pp toward R · 2008: -21.7pp · 2024: -43.2pp
- All cycles
- 2024: R+43.2 2020: R+38.9 2016: R+42.3 2012: R+25.3 2008: R+21.7
Not yet ingested
- Civics
- —
Market trends
- HPI YoY
- ▲ 7.17%
- Current HPI
- 298.31
- Rent YoY
- —
- Metro
- —
- State GDP YoY
- ▲ 2.60%
- F500 in state
- 92
Industry mix (Fortune 500 HQ in NY)
| Industry | F500 HQs | Revenue |
|---|---|---|
| Financial Services | 10 | $950B |
|
||
| Consumer Goods | 9 | $162B |
|
||
| Insurance | 4 | $225B |
|
||
| Telecommunications | 2 | $144B |
|
||
| Pharmaceuticals | 2 | $112B |
|
||
| Media / Entertainment | 2 | $69B |
|
||
Price history
+101.4% since first listed9 events — show timeline
- 2026-06-02 Relisted — WNYREIS
- 2026-05-31 Listing Removed — WNYREIS
- 2026-05-29 Listed $145,000 WNYREIS
- 2021-06-11 Sold (MLS) $72,000 WNYREIS
- 2021-03-27 Pending — WNYREIS
- 2021-02-24 Contingent — WNYREIS
- 2021-01-29 Relisted — WNYREIS
- 2021-01-23 Contingent — WNYREIS
- 2021-01-06 Listed $72,000 WNYREIS
Property tax history
+1.3%/yrLatest (2025): $4,158 · +38.1% YoY. Source: county tax records.
Cash-flow waterfall
monthlySold comps — $/sqft
last 12 mo · ≤1 miLoading sold comps…