432 Larkspur Ln · Edmond, OK
Flood risk 1/10 · Minimal
- FEMA flood zone
- X (unshaded)
- Chance of flooding over 30 yrs
- 0.0%
- Est. flood insurance / yr
- $507 – $1,088
Fire risk 2/10 · Minimal
- Est. fire insurance / yr
- $2,463 – $4,575
Heat risk 6/10 · Moderate
- Hot days now (above 108°F)
- 7 days/yr
- Hot days in 30 yrs
- 19 days/yr
Wind risk 2/10 · Minimal
- Chance of severe wind over 30 yrs
- 4.0%
Air-quality risk 2/10 · Minimal
- Unhealthy air days now
- 2 days/yr
- Unhealthy air days in 30 yrs
- 2 days/yr
Risk factors via First Street. Map © Google.
Why this score? — see what drove the D grade
The composite is a weighted blend of 9 inputs, each scored 0–100. Each bar is that input's sub-score; the figure is the points it added to the 100-point composite (weight × sub-score).
- Cash flow +12.7/30.0
- ARV discount +10.1/15.0
- Livability +3.9/5.0
- DSCR +3.8/10.0
- Schools +3.6/10.0
- Rent growth +3.5/5.0
- 1% rule +3.2/10.0
- Condition / age +2.5/5.0
- Appreciation +0.0/10.0
$195,000
🖨 Deal sheet 📄 Offer letter ✓ Due diligence
Listing remarks MLS
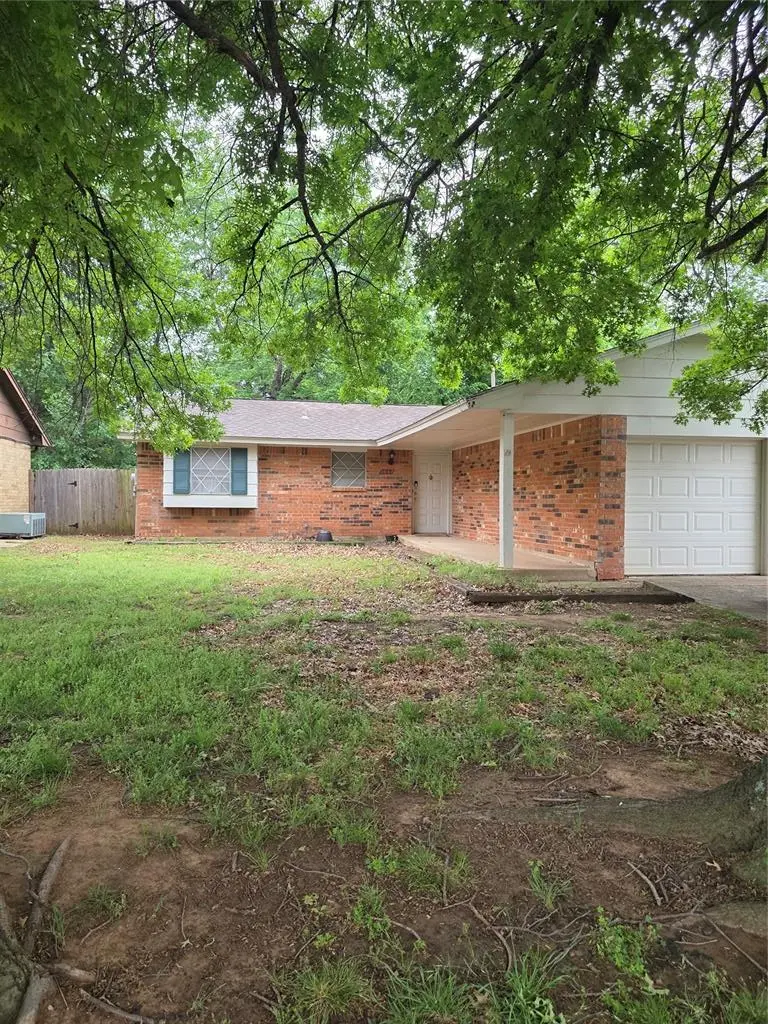
Ideal "fixer upper" located in the heart of Edmond. This 3 bed, 2 bath home is nestled in the Meadow Lakes addition and is just a block away from the neighborhood park. Laminate wood flooring throughout. This home is priced to be sold in it's current condition as the Seller will not be making any repairs/improvements. Buyer responsible to verify schools.
Key facts
- 6,669 sq ft lot
- 2 garage spots
- Built 1977
Neighborhood map
What this means for you Summary
Snapshot
- This is a 3-bed/2.0-bath single-family listed at $195k.
Deal economics
- At list price, monthly cash flow is $-21 ($-255/yr) — negative.
- To cash-flow at today's rent, offer at most $191k (1.9% below list).
- To meet the 1% rule (rent ≥ 1% of price), the offer needs to be $160k (18.2% below list).
- Recommended offer: $160k (18.2% below list) — sets the bar for 1% rule.
- Cap rate 6.2% vs local median 3.4% in Edmond — top-decile yield for the area; either an underpriced asset or a hidden risk that comps aren't pricing in. Stress-test before assuming the spread holds.
Location & tenants
- Location reads 78/100 on livability (#6 in OK, #2,383 nationally) — a middle-class / working-renter tenant base. Strengths: employment A+, housing A+, crime A-; Watch: health & safety C-, commute F.
- Edmond (suburban): math 38% / reading 40% proficiency, ranked #11 of 270 in OK (top 4%) — families likely to look elsewhere, expect single-tenant / working-renter base with shorter leases.
- Zoned schools: Ida Freeman Es (math 17% / reading 17%, grade F, #540 of 845 statewide, top 68%, 464 students, 0% FRL); North Hs (math 47% / reading 57%, grade D+, #1 of 447 statewide, top 0%, 2,555 students, 0% FRL) — zoned schools average 0% FRL vs 22% district-wide (22 pts lower); this property's tenant base skews higher-income than the district average.
- Market conditions: Rents rising (+3.9%/yr); 215 active listings in the ZIP; 40 comparable units currently listed for rent nearby; rentals at typical pace (median 15d on market — plan ~3-4 weeks tenant-placement turnaround); solid renter incomes; 5,365 units permitted in Oklahoma County in 2024 (569 in 5+ unit buildings).
Forward outlook
- Local home prices are declining (-3.0%/yr); year-one equity from $1k of loan paydown is wiped out by about $6k of value loss. Plan a longer hold.
- Oklahoma County population projected at +41% by 2050 — long-run rental-demand tailwind backs the buy-and-hold thesis.
Negotiation context
- Only 1 days on market — expect competitive offers; lowballing is unlikely to land.
- 2 sale attempts since 4y ago with the ask held roughly flat each time — persistent listings suggest the price (not the market) is what's stuck; bring a comps-based counter.
- Current owner paid $125k; list at $195k implies a 56% gain — meaningful room to come down on a strong offer.
Risks & watch-outs
- Climate carrying-cost: extreme-heat days projected 7→19/yr by 2055 (HVAC capex compounding) — expect insurance premiums to compound above CPI over the hold.
Questions for the listing agent
- What do current leases actually rent for vs. the listed asking? Can we see a recent rent roll and the last 12 months of T-12 income?
- Built in 1977 — when were the roof, HVAC, electrical panel, plumbing, and water heater last replaced?
- Is there a deadline driving the sale (1031 exchange, divorce, estate, relocation)? That informs how much negotiation room exists.
- Schools are A-rated — typically a magnet for longer-tenancy family renters. What's the average tenant stay here, and is there a school-zone premium baked into asking?
- The area grade is low — what's the realistic commute time and amenity access for the typical tenant pool here? Any planned neighborhood developments (good or bad) we should know about?
- What's the average days-on-market for RENTAL listings here right now (not sales)? A rising rental-DOM trend means longer vacancies and softer asking-rent achievability than the comps imply.
- What's the recent tenant-quality profile in this submarket — average credit score on applications, eviction rate, late-payment / NSF rate, and stable-employment percentage? A property-management company in the area should have these aggregated.
- How much new for-sale + rental construction is in the pipeline within 1–3 miles? Heavy new supply typically softens prices + rents 12–24 months out; constrained supply supports both.
Investment metrics
- 1% rule
- 0.82% ✗
- Cap rate
- 6.16%
- Cash-on-cash
- -0.47%
- DSCR
- 0.98
- GRM
- 10.2
CMA / ARV
- ARV (on-the-fly)
- $207,000
- Comps found
- 12
Show comp detail 12 sales within ~0.75 mi
| Address | Dist | Beds/Ba | Sqft | Sold | Price | $/sf | Match |
|---|---|---|---|---|---|---|---|
| 504 Gayclifee Ter | 0.13mi | 3/2.0 | 1,010 (-10%) | 1mo | $189,000 | $187 | 76 |
| 712 Willow Ridge Pl | 0.30mi | 3/1.5 | 1,080 (-4%) | 3mo | $199,500 | $185 | 74 |
| 824 Cedar Crest Dr | 0.17mi | 3/1.5 | 1,006 (-11%) | 2mo | $200,000 | $199 | 71 |
| 501 Meadow Lake Dr | 0.28mi | 3/1.0 | 1,058 (-6%) | 4mo | $200,000 | $189 | 69 |
| 1609 Apian Way | 0.56mi | 3/2.0 | 1,215 (+8%) | 4mo | $205,000 | $169 | 57 |
| 424 Victory Rd | 0.58mi | 3/2.0 | 1,242 (+10%) | 0mo | $210,000 | $169 | 55 |
| 15 S Walnut St | 0.63mi | 2/1.0 (-1) | 1,162 (+3%) | 1mo | $200,000 | $172 | 55 |
| 300 N Fretz Ave | 0.45mi | 4/1.5 (+1) | 1,248 (+11%) | 1mo | $230,000 | $184 | 53 |
| 637 N Broadway | 0.57mi | 3/1.0 | 1,263 (+12%) | 1mo | $182,000 | $144 | 48 |
| 713 Lapwing Rd | 0.71mi | 2/2.0 (-1) | 1,216 (+8%) | 2mo | $192,500 | $158 | 47 |
| 323 W 2nd St | 0.72mi | 2/1.0 (-1) | 1,071 (-5%) | 4mo | $150,000 | $140 | 46 |
| 94 Shirley Ln | 0.55mi | 2/1.0 (-1) | 990 (-12%) | 2mo | $190,000 | $192 | 44 |
Match score weights: distance 35% · size 25% · config 20% · recency 20%. Top-matched comps best support the ARV.
Projected returns pro-forma
-3.0% appreciation · 3.86% rent growth · sell at horizon
- IRR
- -16.2%
- Equity multiple
- 0.42×
- Total profit
- $-31,577
- Equity at exit
- $29,075
- IRR
- -6.5%
- Equity multiple
- 0.57×
- Total profit
- $-23,494
- Equity at exit
- $16,860
Cash invested: $54,600 (down + closing). Projections, not guarantees.
Landlord ↔ Tenant lean methodology
- Overall (STATE)
- 83 Strongly Landlord-Friendly
- State Oklahoma
- 83 Strongly Landlord-Friendly · R+20
- County
- — inherits STATE
- City
- — inherits STATE
ZIP-level market 73003
- Home prices YoY
- -31.2%
- Rents YoY
- 3.9%
- Active inventory
- 215
- Price-to-rent
- 10.2×
Monthly cashflow live
- Estimated rent
- $1,595 high interval (Pro) →
- Mortgage (P&I)
- −$1,023
- Tax from tax record
- −$178 /mo · $2,134/yr
- Insurance
- −$81
- HOA
- −$0
- Vacancy / Maint / Mgmt
- −$335
- Net cashflow
- $-21
Break-even live
UW: 25.0% down · 7.5% · 30yr · 1.5% tax · 5.0% vac · 8.0% maint · 8.0% mgmt
Financing live
Cash to close
- Down payment
- $48,750
- Closing costs
- $5,850
- Reserves months
- —
- Total cash needed
- —
Loan-product check · same deal, 3 products live
Conventional
25% down · 7.5% · 30yr
- Down + closing
- —
- Monthly P&I
- —
- Monthly cashflow
- —
- DSCR
- —
- Eligible?
- —
Personal DTI + credit; lowest rate.
DSCR
20% down · 8.5% · 30yr
- Down + closing
- —
- Monthly P&I
- —
- Monthly cashflow
- —
- DSCR
- —
- Eligible?
- —
No personal income docs; deal must DSCR.
Hard money
10% down · 12.0% · 12mo
- Down + closing
- —
- Monthly P&I
- —
- Monthly cashflow
- —
- DSCR
- —
- Eligible?
- —
Short-term bridge; refi at stabilization.
Rent comps 40 comps
| Address | Beds | Baths | Sqft | Rent | $/sqft | DOM | Units | Dist |
|---|---|---|---|---|---|---|---|---|
| 413 Meadow Lake Dr Edmond, OK | 4.0 | 2.0 | 1369 | $1,500 | $1.10 | 2d | 1 | 0.03mi |
| 320 Cedar Crest Dr Edmond, OK | 3.0 | 1.5 | 1051 | $1,295 | $1.23 | 2d | 1 | 0.11mi |
| 513 Sunnyside Pl Edmond, OK | 3.0 | 1.5 | 1130 | $1,350 | $1.19 | 4d | 1 | 0.12mi |
| 242 Barrett Pl Edmond, OK | 2.0 | 1.0 | 1029 | $1,150 | $1.12 | 21d | 1 | 0.18mi |
| 231 Barrett Pl Edmond, OK | 3.0 | 2.0 | 1175 | $1,295 | $1.10 | 23d | 1 | 0.22mi |
| 620 Winding Ln Edmond, OK | 3.0 | 2.0 | 1133 | $1,550 | $1.37 | 2d | 1 | 0.23mi |
| 211 Ashley Dr Edmond, OK | 3.0 | 2.0 | 1250 | $1,440 | $1.15 | 23d | 1 | 0.29mi |
| 1303 Fretz Ave Edmond, OK | 2.0 | 2.0 | 1007 | $1,295 | $1.29 | 4d | 1 | 0.30mi |
| 200 Ashley Dr Edmond, OK | 3.0 | 2.0 | 1225 | $1,375 | $1.12 | 23d | 1 | 0.31mi |
| 128 Ashley Dr Edmond, OK | 3.0 | 2.0 | 1250 | $1,455 | $1.16 | 23d | 1 | 0.32mi |
| 159 Barrett Pl Edmond, OK | 2.0 | 1.5 | 1175 | $1,175 | $1.00 | 23d | 1 | 0.32mi |
| 1225 Sequoyah Pl Edmond, OK | 2.0 | 1.5 | 1183 | $1,350 | $1.14 | 14d | 1 | 0.34mi |
| 437 Chalk Hill Ct Edmond, OK | 3.0 | 2.0 | 1216 | $1,595 | $1.31 | 23d | 1 | 0.39mi |
| 425 Chalk Hill Ct Edmond, OK | 3.0 | 2.0 | 1243 | $1,550 | $1.25 | 14d | 1 | 0.39mi |
| 436 Chalk Hill Ct Edmond, OK | 3.0 | 2.0 | 1274 | $2,850 | $2.24 | 21d | 1 | 0.41mi |
| 436 Chalk Hill Ct Edmond, OK | 3.0 | 2.0 | 1274 | $2,850 | $2.24 | 23d | 1 | 0.41mi |
| 412 Chalk Hill Ct Edmond, OK | 3.0 | 2.0 | 1216 | $1,565 | $1.29 | 14d | 1 | 0.43mi |
| 425 Sterling Pointe Way Unit 425 Edmond, OK | 2.0 | 2.0 | 1050 | $1,300 | $1.24 | 4d | 1 | 0.43mi |
| 1015 Swan Lake Ct Edmond, OK | 2.0 | 2.0 | 1200 | $1,295 | $1.08 | 23d | 1 | 0.46mi |
| 1015 Swan Lake Ct Edmond, OK | 2.0 | 2.0 | 1200 | $1,295 | $1.08 | 4d | 1 | 0.46mi |
| 714 W Hurd St Edmond, OK | 2.0 | 1.0 | 1000 | $1,150 | $1.15 | 23d | 1 | 0.55mi |
| 600 N Broadway Edmond, OK | 2.0 | 1.0 | 1062 | $1,325 | $1.25 | 2d | 1 | 0.59mi |
| 5 E Thatcher St Edmond, OK | 3.0 | 1.0 | 1144 | $1,550 | $1.35 | 23d | 1 | 0.60mi |
| 15 S Walnut St Edmond, OK | 2.0 | 1.0 | 1162 | $1,400 | $1.20 | 23d | 1 | 0.61mi |
| 105 W Hurd St Edmond, OK | 2.0 | 1.0 | 930 | $1,550 | $1.67 | 2d | 1 | 0.61mi |
| 101 W Main St Edmond, OK | 3.0 | 1.0–2.0 | 991 | $2,320 | $2.34 | 1d | 111 | 0.67mi |
| 733 Lapwing Rd Edmond, OK | 2.0 | 2.0 | 1216 | $1,450 | $1.19 | 23d | 1 | 0.72mi |
| 504 N Boulevard Edmond, OK | 3.0 | 2.0 | 1250 | $2,595 | $2.08 | 14d | 1 | 0.72mi |
| 612 W 2nd St Unit 100 Edmond, OK | 3.0 | 2.5 | 1414 | $1,895 | $1.34 | 21d | 1 | 0.74mi |
| 317 Dooley Creek Ln Edmond, OK | 3.0 | 2.0 | 1295 | $1,595 | $1.23 | 14d | 1 | 0.74mi |
| 313 Dooley Creek Ln Edmond, OK | 3.0 | 2.0 | 1295 | $1,595 | $1.23 | 23d | 1 | 0.75mi |
| 1129 Carpe Diem Ct Edmond, OK | 3.0 | 2.0 | 1250 | $1,595 | $1.28 | 4d | 1 | 0.75mi |
| 25 Creek View Dr Edmond, OK | 1.0–2.0 | 1.0–2.0 | 872 | $1,336 | $1.53 | 4d | 1 | 0.87mi |
| 320 E Edwards St Apt 12 Edmond, OK | 2.0 | 1.0 | 927 | $1,100 | $1.19 | 23d | 1 | 0.91mi |
| 301 N University Dr Unit 12 Edmond, OK | 2.0 | 1.0 | 990 | $1,000 | $1.01 | 14d | 1 | 0.91mi |
| 1201 Covell Village Dr Edmond, OK | 3.0 | 2.0 | 1265 | $1,872 | $1.48 | 14d | 1 | 1.09mi |
| 1201 Covell Village Dr Edmond, OK | 2.0 | 2.0 | 1090 | $1,641 | $1.51 | 11d | 1 | 1.09mi |
| 2500 Thomas Dr Edmond, OK | 1.0–3.0 | 1.0–2.0 | 879 | $1,395 | $1.59 | 1d | 6 | 1.17mi |
| 800 Chowning Ave Edmond, OK | 2.0 | 2.0 | 1008 | $1,129 | $1.12 | 4d | 1 | 1.22mi |
| 730 S Littler Ave Edmond, OK | 2.0 | 1.0 | 792 | $1,250 | $1.58 | 21d | 1 | 1.30mi |
Listing history 6 events
-
2026-04-22status Pending
-
2026-04-22$195,000 Active
-
2022-03-01soldstatus $125,000 Sold 370-char remark
Show marketing remark (370 chars)
Ideal "fixer upper" located in the heart of Edmond. This 3 bed, 2 bath home is nestled in the Meadow Lakes addition and is just a block away from the neighborhood park. Laminate wood flooring throughout. This home is priced to be sold in it's current condition as the Seller will not be making any repairs/improvements. Buyer responsible to verify schools.
-
2022-01-08status Pending 370-char remark
Show marketing remark (370 chars)
Ideal "fixer upper" located in the heart of Edmond. This 3 bed, 2 bath home is nestled in the Meadow Lakes addition and is just a block away from the neighborhood park. Laminate wood flooring throughout. This home is priced to be sold in it's current condition as the Seller will not be making any repairs/improvements. Buyer responsible to verify schools.
-
2022-01-06$128,000 Active 370-char remark
Show marketing remark (370 chars)
Ideal "fixer upper" located in the heart of Edmond. This 3 bed, 2 bath home is nestled in the Meadow Lakes addition and is just a block away from the neighborhood park. Laminate wood flooring throughout. This home is priced to be sold in it's current condition as the Seller will not be making any repairs/improvements. Buyer responsible to verify schools.
-
1992-10-21soldstatus $45,000
ⓘ Source: listings_history table (triggers on properties + properties_extension) + one-shot
backfill from property_details.listing_events for pre-trigger history.
Tax reassessment forecast OK · Resets to sale price
- Current annual tax
- $2,134 · $178/mo
- Projected year-2 tax
- $2,134 · $178/mo
- Expected delta
- $0/yr ($0/mo · 0.0%)
ⓘ Screening estimate from a state-policy table — verify with the county assessor before closing.
Climate risk First Street
- Flood 1/10 Low FEMA zone X (unshaded) · 0% chance over 30 yrs
- Wildfire 2/10 Low
- Heat 6/10 Major 7 d/yr ≥108°F today · 19 d/yr by 30 yrs out
- Wind 2/10 Low 4% chance of damaging wind over 30 yrs
- Air quality 2/10 Low 2 unhealthy d/yr today · 2 by 30 yrs out
Nearby sold comps map
Loading sold comps map…
Walkable amenities ~0.75 mi
Loading nearby amenities…
Taxation est. · year 1
- Rental income
- $19,146
- − Mortgage interest
- −$10,923
- − Property taxes
- −$2,134
- − Insurance
- −$975
- − Repairs & maintenance
- −$1,532
- − Management
- −$1,532
- − Depreciation
- −$5,673
- Taxable loss
- −$3,623
- Est. tax savings @ 24.0%
- +$869
- After-tax cash flow
- $614/yr
For passive investors: Depreciation is non-cash, so a rental often shows a tax loss while cash-flowing — sheltering income. Rental losses are passive: they offset passive income freely, and up to $25,000/yr can offset ordinary (W-2) income if you actively participate and your MAGI is under $100k (phasing out to $0 by $150k); unused losses carry forward. On sale, claimed depreciation is recaptured at up to 25%, and gains may owe capital-gains tax (a 1031 exchange can defer both). Figures are a year-1 estimate at your 24.0% rate — not tax advice; consult a CPA.
Schools (NCES district)
- District
- Edmond
- NCES district ID
- 4010590
- Math proficiency
- 38% ▼ -12.00%
- Reading proficiency
- 40% ▼ -12.00%
- Median HH income
- $73,212
- Composite
- 35.88/100
- National rank
- #4814
- State rank
- #11 of 270 in OK
Livability — Edmond
- Score
- 78/100
- State rank
- #6
- US rank
- #2383
Category grades
Schools grade is shown separately in the Schools card above.
Census & demographics
- Census place
- Edmond, OK
- County
- Oklahoma County · 771,644 people
- City population
- 177,083
- Metro
- Oklahoma City, OK
- Population (ZIP)
- 23,236
- Household income
- $78,149
- Rent vs Own
- Severe rent burden
- 988.0
Population outlook (Oklahoma County) Hauer SSP2
- Today (2025)
- 911,875 people
- By 2030
- 982,413 · +7.7%
- By 2040
- 1,130,468 · +24.0%
- By 2050
- 1,288,422 · +41.3%
- By 2075
- 1,711,482 · +87.7%
- By 2100
- 2,088,448 · +129.0%
Race, ethnicity, and origin ACS 2023
- Neighborhood character
- Predominantly White (69%)
- Race & ethnicity
- White 69% Two or more races 13% Black 9% Hispanic / Latino 9% Asian 3%
- Hispanic origin (detail)
- Mexican 7%
- Common ancestry
- Italian 2% Slovak 2% Lithuanian 1%
- Foreign-born
- 8% · Canada, China
- Languages at home
- 90% English-only · Spanish 5% Other Indo-European 2% Chinese 1%
Political lean MEDSL · Oklahoma
- 2024 margin
- Toss-up / Even · D 48.0% · R 49.7% · Other 2.3%
- 2008→2024 swing
- +15.1pp toward D · 2008: -16.8pp · 2024: -1.7pp
- All cycles
- 2024: R+1.7 2020: R+1.1 2016: R+10.5 2012: R+16.7 2008: R+16.8
Not yet ingested
- Civics
- —
Market trends
- HPI YoY
- ▼ -104.15%
- Current HPI
- 229.3899
- Rent YoY
- ▲ 3.86%
- Metro
- Oklahoma City, OK
- State GDP YoY
- ▲ 1.55%
- F500 in state
- 6
Industry mix (Fortune 500 HQ in OK)
| Industry | F500 HQs | Revenue |
|---|---|---|
| Energy | 3 | $48B |
|
||
Price history
+333.3% since first listed6 events — show timeline
- 2026-04-22 Pending — MLSOK
- 2026-04-22 Listed $195,000 MLSOK
- 2022-03-01 Sold (MLS) $125,000 MLSOK
- 2022-01-08 Pending — MLSOK
- 2022-01-06 Listed $128,000 MLSOK
- 1992-10-21 Sold (Public Records) $45,000 Public Records
Property tax history
+5.8%/yrLatest (2025): $2,134 · +3.2% YoY. Source: county tax records.
Cash-flow waterfall
monthlySold comps — $/sqft
last 12 mo · ≤1 miLoading sold comps…