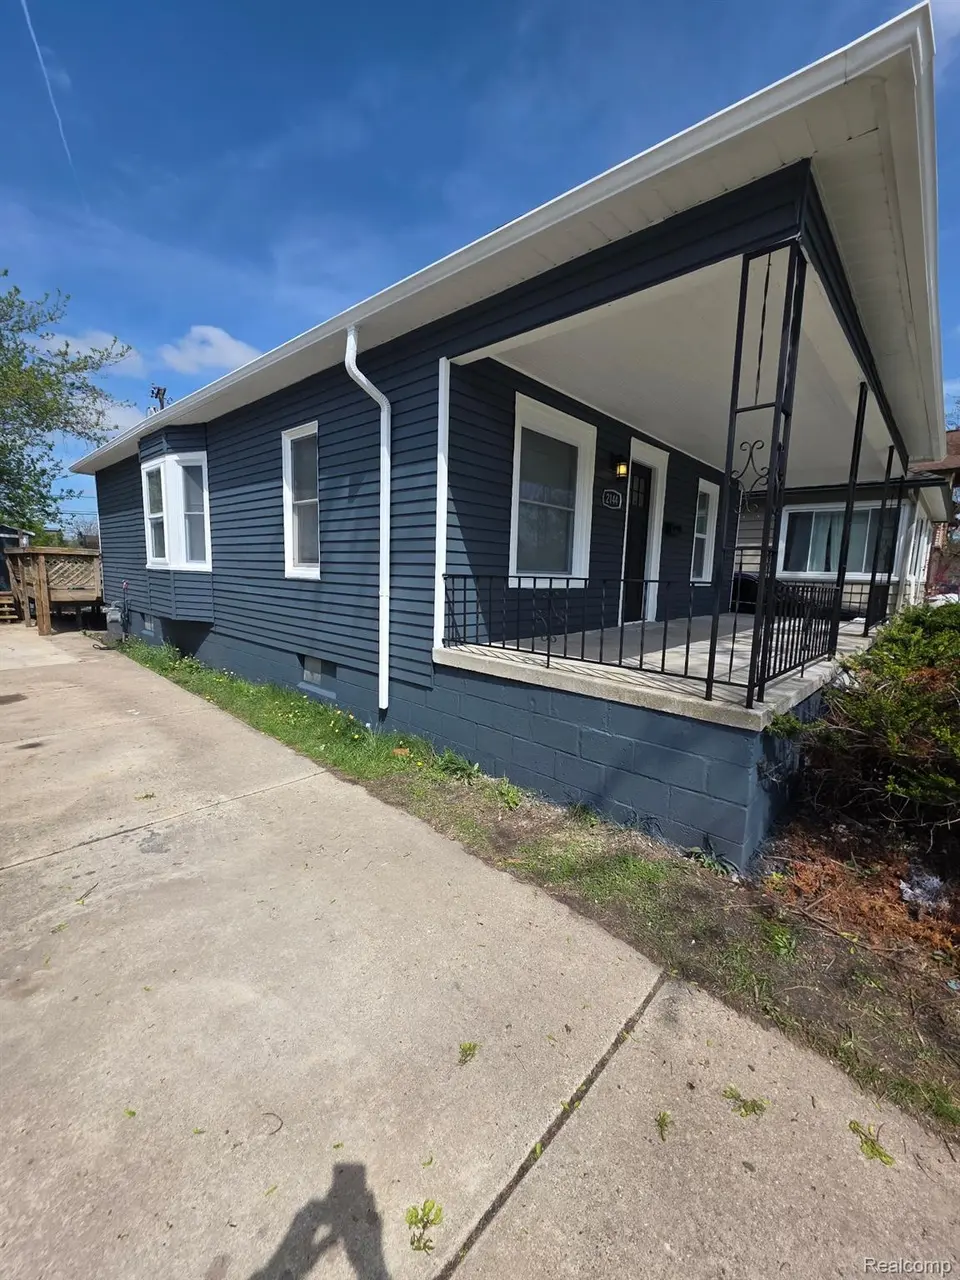
2144 4th St · Trenton, MI
Flood risk 1/10 · Minimal
- FEMA flood zone
- X (unshaded)
- Chance of flooding over 30 yrs
- 0.0%
- Est. flood insurance / yr
- $507 – $1,088
Fire risk 1/10 · Minimal
- Est. fire insurance / yr
- $784 – $1,456
Heat risk 3/10 · Minor
- Hot days now (above 97°F)
- 7 days/yr
- Hot days in 30 yrs
- 14 days/yr
Wind risk 2/10 · Minimal
- Chance of severe wind over 30 yrs
- —
Air-quality risk 2/10 · Minimal
- Unhealthy air days now
- 2 days/yr
- Unhealthy air days in 30 yrs
- 2 days/yr
Risk factors via First Street. Map © Google.
Why this score? — see what drove the C grade
The composite is a weighted blend of 9 inputs, each scored 0–100. Each bar is that input's sub-score; the figure is the points it added to the 100-point composite (weight × sub-score).
- Cash flow +18.0/30.0
- ARV discount +12.9/15.0
- DSCR +5.6/10.0
- 1% rule +5.2/10.0
- Livability +4.4/5.0
- Schools +4.2/10.0
- Rent growth +2.5/5.0
- Condition / age +2.5/5.0
- Appreciation +0.0/10.0
$155,000
🖨 Deal sheet 📄 Offer letter ✓ Due diligence
Listing remarks MLS
WOW, JUST WOW! This cute home has been fully refurbished and is just ready for its next owner. Not to mention the price! Finding a 3-bedroom home, this close to the water and in Trenton all for under 200K is insane! Property has too many updates to list. Brand new custom kitchen, custom spa-like bathroom, new roof, brand new furnace and tankless hot water, new flooring, paint throughout inside and out and much, much more! Good sized lot with nice shed in the back. Get over to this house now and put in your best offer, it won't last!!!
Key facts
- Custom kitchen
- New furnace
- Tankless hot water
Tags
Property features AI
Exterior
- Parking: No garage
- Utilities: Public water; Public sewer
- Home design: Single-family residence; One level; Ground-level entry with steps
- Construction: Aluminum siding
- Exterior features: Paved road access; Lot approximately 0.12 acres (40 x 129)
Interior
- Bathrooms: 1 full bathroom
- Heating & cooling: Forced air heating (natural gas); No central cooling
- Interior features: Crawl space basement; Total of 4 rooms
Neighborhood map
What this means for you Summary
Snapshot
- This is a 3-bed/1.0-bath single-family listed at $155k.
Deal economics
- At list price, monthly cash flow is $132 ($2k/yr) — positive.
- The deal already cash-flows at list — no discount required.
- Meets the 1% rule at list price ($2k rent vs $155k).
- Recommended offer: $150k (3.0% below list) — sets the bar for market timing.
- Cap rate 7.3% vs local median 4.1% in Trenton — top-decile yield for the area; either an underpriced asset or a hidden risk that comps aren't pricing in. Stress-test before assuming the spread holds.
Location & tenants
- Location reads 88/100 on livability (#15 in MI, #250 nationally) — a professional / high-income tenant draw. Strengths: crime A+, cost of living A+, housing A+.
- Trenton Public Schools (suburban): math 44% / reading 53% proficiency, ranked #109 of 540 in MI (top 20%) — families likely to look elsewhere, expect single-tenant / working-renter base with shorter leases.
- Market conditions: 171 active listings in the ZIP; 1 comparable units currently listed for rent nearby; solid renter incomes; 2,639 units permitted in Wayne County in 2024 (1,216 in 5+ unit buildings).
Forward outlook
- Local home prices are declining (-3.0%/yr); year-one equity from $1k of loan paydown is wiped out by about $5k of value loss. Plan a longer hold.
- Wayne County population projected at -17% by 2050 — secular population decline; favor cash flow + early exit over multi-decade hold.
Negotiation context
- It's been on market 52 days — a 3% lower offer ($150k) is reasonable based on typical stale-listing flexibility.
- 4 sale attempts since 14y ago; this cycle's ask has dropped $10k (6%) from the opening price — seller is motivated, your offer sets the floor, not the list.
Risks & watch-outs
- Watch-outs: built in 1923 — expect roof / HVAC / electrical / plumbing capex.
Questions for the listing agent
- It's been on market 52 days. Have you received any prior offers? Is the seller open to a 3% concession, seller financing, or rate buy-down credit?
- Built in 1923 — when were the roof, HVAC, electrical panel, plumbing, and water heater last replaced?
- Is there a deadline driving the sale (1031 exchange, divorce, estate, relocation)? That informs how much negotiation room exists.
- Schools are B-rated — typically a magnet for longer-tenancy family renters. What's the average tenant stay here, and is there a school-zone premium baked into asking?
- What's the average days-on-market for RENTAL listings here right now (not sales)? A rising rental-DOM trend means longer vacancies and softer asking-rent achievability than the comps imply.
- What's the recent tenant-quality profile in this submarket — average credit score on applications, eviction rate, late-payment / NSF rate, and stable-employment percentage? A property-management company in the area should have these aggregated.
- How much new for-sale + rental construction is in the pipeline within 1–3 miles? Heavy new supply typically softens prices + rents 12–24 months out; constrained supply supports both.
Investment metrics
- 1% rule
- 1.02% ✓
- Cap rate
- 7.32%
- Cash-on-cash
- 3.66%
- DSCR
- 1.16
- GRM
- 8.2
CMA / ARV
- ARV (median comp)
- $176,009
- List price
- $155,000
- Delta
- -11.94%
- Verdict
- UNDERPRICED
- Comps
- 20 within 1.0 mi
Show comp detail 7 sales within ~0.75 mi
| Address | Dist | Beds/Ba | Sqft | Sold | Price | $/sf | Match |
|---|---|---|---|---|---|---|---|
| 2217 Third St | 0.11mi | 3/1.0 | 918 (+6%) | 3mo | $180,000 | $196 | 83 |
| 2343 3rd St | 0.21mi | 2/1.0 (-1) | 912 (+5%) | 1mo | $184,500 | $202 | 76 |
| 2365 Dickinson St | 0.25mi | 3/1.5 | 861 (-1%) | 14mo | $149,900 | $174 | 73 |
| 2463 Dickinson St | 0.33mi | 3/1.0 | 879 (+1%) | 14mo | $65,000 | $74 | 72 |
| 2358 Superior St | 0.23mi | 2/1.0 (-1) | 830 (-5%) | 24mo | $150,000 | $181 | 56 |
| 2419 4th St | 0.25mi | 2/1.0 (-1) | 748 (-14%) | 16mo | $132,000 | $176 | 47 |
| 2341 Medford St | 0.55mi | 3/1.0 | 985 (+13%) | 15mo | $175,000 | $178 | 40 |
Match score weights: distance 35% · size 25% · config 20% · recency 20%. Top-matched comps best support the ARV.
Projected returns pro-forma
-3.0% appreciation · 3.0% rent growth · sell at horizon
- IRR
- -10.5%
- Equity multiple
- 0.62×
- Total profit
- $-16,630
- Equity at exit
- $23,111
- IRR
- -1.1%
- Equity multiple
- 0.92×
- Total profit
- $-3,416
- Equity at exit
- $13,402
Cash invested: $43,400 (down + closing). Projections, not guarantees.
Landlord ↔ Tenant lean methodology
- Overall (STATE)
- 62 Landlord-Friendly
- State Michigan
- 62 Landlord-Friendly · EVEN
- County
- — inherits STATE
- City
- — inherits STATE
ZIP-level market 48183
- Active inventory
- 171
- Price-to-rent
- 8.2×
Monthly cashflow live
- Estimated rent
- $1,577 medium interval (Pro) →
- Mortgage (P&I)
- −$813
- Tax from tax record
- −$236 /mo · $2,830/yr
- Insurance
- −$65
- HOA
- −$0
- Vacancy / Maint / Mgmt
- −$331
- Net cashflow
- $132
Break-even live
UW: 25.0% down · 7.5% · 30yr · 1.5% tax · 5.0% vac · 8.0% maint · 8.0% mgmt
Financing live
Cash to close
- Down payment
- $38,750
- Closing costs
- $4,650
- Reserves months
- —
- Total cash needed
- —
Loan-product check · same deal, 3 products live
Conventional
25% down · 7.5% · 30yr
- Down + closing
- —
- Monthly P&I
- —
- Monthly cashflow
- —
- DSCR
- —
- Eligible?
- —
Personal DTI + credit; lowest rate.
DSCR
20% down · 8.5% · 30yr
- Down + closing
- —
- Monthly P&I
- —
- Monthly cashflow
- —
- DSCR
- —
- Eligible?
- —
No personal income docs; deal must DSCR.
Hard money
10% down · 12.0% · 12mo
- Down + closing
- —
- Monthly P&I
- —
- Monthly cashflow
- —
- DSCR
- —
- Eligible?
- —
Short-term bridge; refi at stabilization.
Rent comps 1 comps
| Address | Beds | Baths | Sqft | Rent | $/sqft | DOM | Units | Dist |
|---|---|---|---|---|---|---|---|---|
| 2901 W Jefferson Ave Unit 2901 Trenton, MI | 2.0 | 1.0 | 850 | $1,650 | $1.94 | 1d | 1 | 0.74mi |
Listing history 19 events
-
2026-06-18days on market $155,000 Active 52 DOM
-
2026-06-17days on market $155,000 Active 51 DOM
-
2026-06-16days on market $155,000 Active 50 DOM
-
2026-06-15days on market $155,000 Active 49 DOM
-
2026-06-13days on market $155,000 Active 47 DOM
-
2026-06-09days on market $155,000 Active 43 DOM
-
2026-06-08days on market $155,000 Active 42 DOM
-
2026-06-07days on market $155,000 Active 41 DOM
-
2026-06-04pricedays on market $155,000 Active 38 DOM
-
2026-06-03days on market $165,000 Active 37 DOM
Show marketing remark (540 chars)
WOW, JUST WOW! This cute home has been fully refurbished and is just ready for its next owner. Not to mention the price! Finding a 3-bedroom home, this close to the water and in Trenton all for under 200K is insane! Property has too many updates to list. Brand new custom kitchen, custom spa-like bathroom, new roof, brand new furnace and tankless hot water, new flooring, paint throughout inside and out and much, much more! Good sized lot with nice shed in the back. Get over to this house now and put in your best offer, it won't last!!!
-
2026-06-02days on market $165,000 Active 36 DOM
-
2026-06-01days on market $165,000 Active 35 DOM
-
2026-05-31days on market $165,000 Active 34 DOM
-
2026-04-27$165,000 Active 540-char remark
Show marketing remark (540 chars)
WOW, JUST WOW! This cute home has been fully refurbished and is just ready for its next owner. Not to mention the price! Finding a 3-bedroom home, this close to the water and in Trenton all for under 200K is insane! Property has too many updates to list. Brand new custom kitchen, custom spa-like bathroom, new roof, brand new furnace and tankless hot water, new flooring, paint throughout inside and out and much, much more! Good sized lot with nice shed in the back. Get over to this house now and put in your best offer, it won't last!!!
-
2012-09-07historical
-
2012-09-07historical
-
2012-09-05$11,900
-
2012-09-05$11,900
ⓘ Source: listings_history table (triggers on properties + properties_extension) + one-shot
backfill from property_details.listing_events for pre-trigger history.
Tax reassessment forecast MI · Partial reset (capped growth)
- Current annual tax
- $2,830 · $236/mo
- Projected year-2 tax
- $2,830 · $236/mo
- Expected delta
- $0/yr ($0/mo · 0.0%)
ⓘ Screening estimate from a state-policy table — verify with the county assessor before closing.
Climate risk First Street
- Flood 1/10 Low FEMA zone X (unshaded) · 0% chance over 30 yrs
- Wildfire 1/10 Low
- Heat 3/10 Moderate 7 d/yr ≥97°F today · 14 d/yr by 30 yrs out
- Wind 2/10 Low
- Air quality 2/10 Low 2 unhealthy d/yr today · 2 by 30 yrs out
Nearby sold comps map
Loading sold comps map…
Walkable amenities ~0.75 mi
Loading nearby amenities…
Taxation est. · year 1
- Rental income
- $18,923
- − Mortgage interest
- −$8,682
- − Property taxes
- −$2,830
- − Insurance
- −$775
- − Repairs & maintenance
- −$1,514
- − Management
- −$1,514
- − Depreciation
- −$4,509
- Taxable loss
- −$902
- Est. tax savings @ 24.0%
- +$216
- After-tax cash flow
- $1,806/yr
For passive investors: Depreciation is non-cash, so a rental often shows a tax loss while cash-flowing — sheltering income. Rental losses are passive: they offset passive income freely, and up to $25,000/yr can offset ordinary (W-2) income if you actively participate and your MAGI is under $100k (phasing out to $0 by $150k); unused losses carry forward. On sale, claimed depreciation is recaptured at up to 25%, and gains may owe capital-gains tax (a 1031 exchange can defer both). Figures are a year-1 estimate at your 24.0% rate — not tax advice; consult a CPA.
Schools (NCES district)
- District
- Trenton Public Schools
- NCES district ID
- 2633900
- Math proficiency
- 44% ▼ -7.00%
- Reading proficiency
- 53% ▼ -2.00%
- Median HH income
- $55,947
- Composite
- 42.08/100
- National rank
- #3321
- State rank
- #109 of 540 in MI
Livability — Trenton
- Score
- 88/100
- State rank
- #15
- US rank
- #250
Category grades
Schools grade is shown separately in the Schools card above.
Census & demographics
- Census place
- Trenton, MI
- County
- Wayne County · 1,562,939 people
- Metro
- Detroit-Warren-Dearborn, MI
- Population (ZIP)
- 41,765
- Household income
- $83,508
- Rent vs Own
- Severe rent burden
- 836.0
Population outlook (Wayne County) Hauer SSP2
- Today (2025)
- 1,675,273 people
- By 2030
- 1,620,300 · -3.3%
- By 2040
- 1,502,341 · -10.3%
- By 2050
- 1,384,039 · -17.4%
- By 2075
- 1,124,592 · -32.9%
- By 2100
- 881,193 · -47.4%
Race, ethnicity, and origin ACS 2023
- Neighborhood character
- Predominantly White (82%)
- Race & ethnicity
- White 82% Hispanic / Latino 6% Black 5% Two or more races 5% Asian 2%
- Hispanic origin (detail)
- Mexican 4%
- Common ancestry
- Romanian 15% Lithuanian 4% Slovak 2%
- Foreign-born
- 4% · Canada
- Languages at home
- 94% English-only · Other Indo-European 3% Spanish 2%
Political lean MEDSL · Wayne
- 2024 margin
- Strong D (+29.0) · D 62.7% · R 33.7% · Other 3.6%
- 2008→2024 swing
- -20.5pp toward R · 2008: 49.5pp · 2024: 29.0pp
- All cycles
- 2024: D+29.0 2020: D+38.1 2016: D+37.3 2012: D+46.9 2008: D+49.5
Not yet ingested
- Civics
- —
Market trends
- HPI YoY
- ▼ -222.34%
- Current HPI
- 216.3623
- Rent YoY
- —
- Metro
- Detroit-Warren-Dearborn, MI
- State GDP YoY
- ▲ 1.37%
- F500 in state
- 28
Industry mix (Fortune 500 HQ in MI)
| Industry | F500 HQs | Revenue |
|---|---|---|
| Automotive Parts | 3 | $48B |
|
||
| Automotive | 2 | $372B |
|
||
| Chemicals | 1 | $45B |
|
||
| Automotive Retail | 1 | $29B |
|
||
| Healthcare / Medical Devices | 1 | $23B |
|
||
| Automotive Technology | 1 | $20B |
|
||
Price history
+1202.5% since first listed8 events — show timeline
- 2026-06-03 Price Changed $155,000 MiRealSource-MiMLS
- 2026-06-03 Price Changed $155,000 REALCOMP
- 2026-04-27 Listed $165,000 REALCOMP
- 2026-04-27 Listed $165,000 MiRealSource-MiMLS
- 2012-09-07 Listing Removed — MiRealSource-MiMLS
- 2012-09-07 Listing Removed — REALCOMP
- 2012-09-05 Listed $11,900 MiRealSource-MiMLS
- 2012-09-05 Listed $11,900 REALCOMP
Property tax history
+3.9%/yrLatest (2025): $2,830 · +8.8% YoY. Source: county tax records.
Cash-flow waterfall
monthlySold comps — $/sqft
last 12 mo · ≤1 miLoading sold comps…