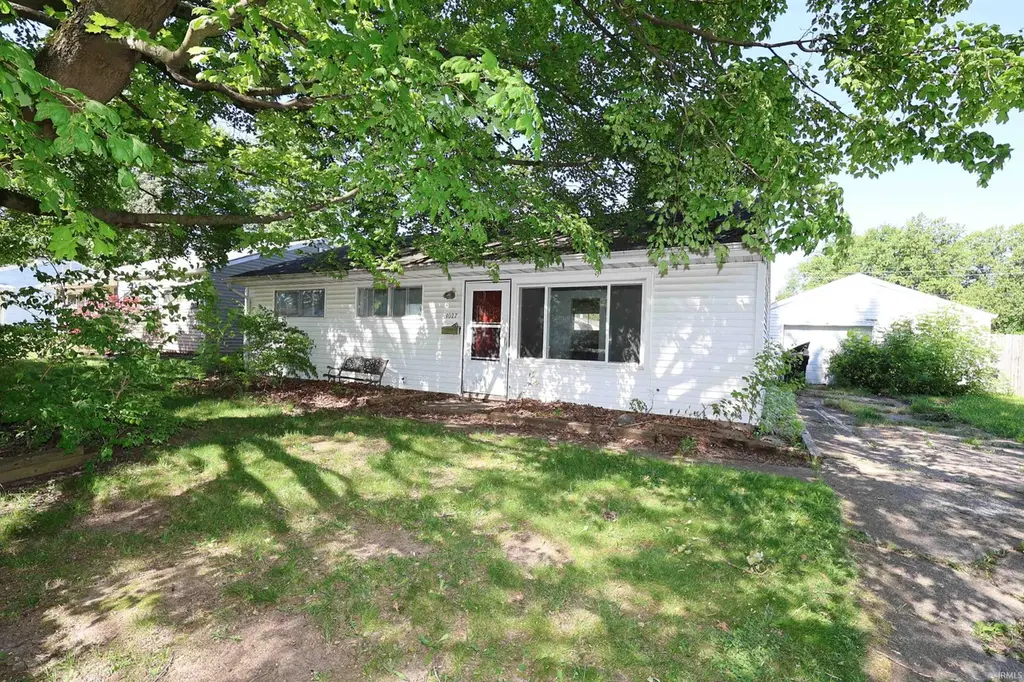
4027 Woodvale Dr · South Bend, IN
Flood risk 1/10 · Minimal
- FEMA flood zone
- X (unshaded)
- Chance of flooding over 30 yrs
- 0.0%
- Est. flood insurance / yr
- $507 – $1,088
Fire risk 1/10 · Minimal
- Est. fire insurance / yr
- $717 – $1,331
Heat risk 2/10 · Minimal
- Hot days now (above 98°F)
- 7 days/yr
- Hot days in 30 yrs
- 16 days/yr
Wind risk 2/10 · Minimal
- Chance of severe wind over 30 yrs
- —
Air-quality risk 2/10 · Minimal
- Unhealthy air days now
- 1 days/yr
- Unhealthy air days in 30 yrs
- 2 days/yr
Risk factors via First Street. Map © Google.
Why this score? — see what drove the B grade
The composite is a weighted blend of 9 inputs, each scored 0–100. Each bar is that input's sub-score; the figure is the points it added to the 100-point composite (weight × sub-score).
- Cash flow +28.9/30.0
- ARV discount +15.0/15.0
- DSCR +10.0/10.0
- 1% rule +8.0/10.0
- Livability +3.2/5.0
- Rent growth +2.5/5.0
- Condition / age +2.5/5.0
- Schools +1.4/10.0
- Appreciation +0.0/10.0
$99,900
🖨 Deal sheet (PDF) 📄 Offer letter ✓ Due diligence
Listing remarks
Investor Alert! Check out this low cost home with tons of upside potential. With some updates this could make a great flip, home to live in, or rental to add to your portfolio. House has a great floorplan with 3 nice sized bedrooms, large kitchen, main floor laundry, and bathroom. You will love the oversized 1 car garage with space for vehicle and storage/equipment. Nice large private backyard. Please note: Highest and best offers will be reviewed by 5 PM on Thursday, 6/11/26. The seller is accepting cash-only, AS-IS offers from buyers prepared to close quickly. The seller has never lived in the home and provides limited information—buyers and their agents are responsible for verifyin
Key facts
- Private backyard
- Main floor laundry
- Large kitchen
Tags
Property features AI
Finance
- Other: Tax amount listed separately (not included per instructions)
- Financial info: Financial details not provided
- HOA & community: HOA information not provided
Exterior
- Parking: Detached 1-car garage
- Security: Security features not provided
- Utilities: Public water; Public sewer
- Home design: Single-family residential, site-built home; Single-story
- Construction: Vinyl siding; Slab foundation; Built as site-built construction
- Exterior features: Shingle roof; Lot approximately 60 x 137 (0.21 acre); Subdivision: Broadmoor; Zoned SN1 Suburban Neighborhood
Interior
- Kitchen: Kitchen details not provided
- Bedrooms: Bedrooms not specified
- Flooring: Flooring details not provided
- Bathrooms: One full bathroom on the main level
- Heating & cooling: Natural gas forced-air heating; Central air conditioning
- Interior features: 11 total rooms
- Laundry & utility: Laundry on the main level
Neighborhood map
What this means for you Summary
Snapshot
- This is a 3-bed/1.0-bath single-family listed at $100k.
Deal economics
- At list price, monthly cash flow is $340 ($4k/yr) — positive.
- The deal already cash-flows at list — no discount required.
- Meets the 1% rule at list price ($1k rent vs $100k).
- Cap rate 10.4% vs local median 4.4% in South Bend — top-decile yield for the area; either an underpriced asset or a hidden risk that comps aren't pricing in. Stress-test before assuming the spread holds.
Location & tenants
- Location reads 64/100 on livability (#365 in IN) — a middle-class / working-renter tenant base. Strengths: cost of living A+, housing A+, health & safety A+; Watch: amenities D, employment D, crime F.
- South Bend Community School Corporation (urban): math 12% / reading 21% proficiency, ranked #284 of 301 in IN (top 94%) — low school quality limits family demand, transient renter base, plan for 1-2y turnover; 66% free/reduced lunch — lower-income household profile, screen leases tightly.
- Zoned schools: Marshall Traditional School (math 27% / reading 27%, grade F, #737 of 994 statewide, top 76%, 397 students, 59% FRL); Jackson Middle School (math 3% / reading 8%, grade F, #326 of 330 statewide, top 99%, 528 students, 82% FRL); Riley High School (math 19% / reading 46%, grade F, #293 of 369 statewide, top 80%, 992 students, 67% FRL) — zoned schools at 70% FRL track the district average.
- Market conditions: 190 active listings in the ZIP; 10 comparable units currently listed for rent nearby; rentals lingering (median 45d on market — plan ~5-8 weeks vacancy on turnover, expect pricing pressure); 50% of comp listings sitting > 30 days — soft ceiling on asking rent; 754 units permitted in St. Joseph County in 2024 (460 in 5+ unit buildings).
Forward outlook
- Local home prices are declining (-3.0%/yr); year-one equity from $691 of loan paydown is wiped out by about $3k of value loss. Plan a longer hold.
- At projected returns (-3.0% appreciation + 3.0% rent growth), your $28k cash investment doubles in ~9 years — after that, you're playing with house money.
Negotiation context
- Only 9 days on market — expect competitive offers; lowballing is unlikely to land.
- Current owner paid $50k; list at $100k implies a 100% gain — meaningful room to come down on a strong offer.
Risks & watch-outs
- Watch-outs: built in 1954 — expect roof / HVAC / electrical / plumbing capex.
Questions for the listing agent
- Built in 1954 — when were the roof, HVAC, electrical panel, plumbing, and water heater last replaced?
- Is there a deadline driving the sale (1031 exchange, divorce, estate, relocation)? That informs how much negotiation room exists.
- Schools are F-rated, which usually means shorter tenancies and higher turnover. Who's the typical renter profile here, and what's been the actual vacancy rate?
- Crime grade is F in this area — have there been break-ins, vandalism, or insurance claims at this property in the last 3 years? What carrier currently insures it and at what premium?
- What's the average days-on-market for RENTAL listings here right now (not sales)? A rising rental-DOM trend means longer vacancies and softer asking-rent achievability than the comps imply.
- What's the recent tenant-quality profile in this submarket — average credit score on applications, eviction rate, late-payment / NSF rate, and stable-employment percentage? A property-management company in the area should have these aggregated.
- How much new for-sale + rental construction is in the pipeline within 1–3 miles? Heavy new supply typically softens prices + rents 12–24 months out; constrained supply supports both.
Investment metrics
- 1% rule
- 1.30% ✓
- Cap rate
- 10.38%
- Cash-on-cash
- 14.59%
- DSCR
- 1.65
- GRM
- 6.4
CMA / ARV
- ARV (on-the-fly)
- $165,984
- Comps found
- 12
Show comp detail 12 sales within ~0.75 mi
| Address | Dist | Beds/Ba | Sqft | Sold | Price | $/sf | Match |
|---|---|---|---|---|---|---|---|
| 4108 Woodvale Dr | 0.05mi | 3/1.0 | 988 (0%) | 1mo | $170,000 | $172 | 97 |
| 4120 Woodvale Dr | 0.07mi | 3/1.0 | 988 (0%) | 7mo | $158,000 | $160 | 91 |
| 4106 Brookton Dr | 0.06mi | 3/1.0 | 1,014 (+3%) | 9mo | $178,000 | $176 | 86 |
| 4039 Coral Dr | 0.25mi | 3/1.0 | 1,008 (+2%) | 8mo | $175,000 | $174 | 78 |
| 1010 Lancaster Dr | 0.51mi | 3/1.0 | 1,008 (+2%) | 0mo | $139,000 | $138 | 72 |
| 1349 Catherwood Dr | 0.18mi | 3/1.0 | 1,114 (+13%) | 9mo | $175,000 | $157 | 63 |
| 912 Ridgedale Rd | 0.64mi | 3/1.0 | 1,000 (+1%) | 7mo | $171,000 | $171 | 62 |
| 1022 Amhurst Ave | 0.41mi | 3/1.0 | 864 (-13%) | 6mo | $135,000 | $156 | 55 |
| 1031 Chippewa Ave | 0.48mi | 3/1.0 | 864 (-13%) | 4mo | $164,000 | $190 | 54 |
| 1001 Lancaster Dr | 0.54mi | 3/1.0 | 1,116 (+13%) | 1mo | $188,000 | $168 | 52 |
| 803 Dover Dr | 0.65mi | 3/1.0 | 864 (-13%) | 1mo | $144,000 | $167 | 48 |
| 3515 Woldhaven Dr | 0.61mi | 3/1.0 | 864 (-13%) | 3mo | $138,000 | $160 | 48 |
Match score weights: distance 35% · size 25% · config 20% · recency 20%. Top-matched comps best support the ARV.
Projected returns pro-forma
-3.0% appreciation · 3.0% rent growth · sell at horizon
- IRR
- 5.1%
- Equity multiple
- 1.20×
- Total profit
- $5,491
- Equity at exit
- $14,895
- IRR
- 14.5%
- Equity multiple
- 2.17×
- Total profit
- $32,747
- Equity at exit
- $8,638
Cash invested: $27,972 (down + closing). Projections, not guarantees.
Landlord ↔ Tenant lean methodology
- Overall (STATE)
- 90 Strongly Landlord-Friendly
- State Indiana
- 90 Strongly Landlord-Friendly · R+11
- County
- — inherits STATE
- City
- — inherits STATE
ZIP-level market 46614
- Home prices YoY
- -32.0%
- Active inventory
- 190
- Price-to-rent
- 6.4×
Monthly cashflow live
- Estimated rent
- $1,301 high interval (Pro) →
- Mortgage (P&I)
- −$524
- Tax from tax record
- −$122 /mo · $1,466/yr
- Insurance
- −$42
- HOA
- −$0
- Vacancy / Maint / Mgmt
- −$273
- Net cashflow
- $340
Break-even live
Sensitivity live
| Price | -10% $397 | -5% $368 | +0% $340 | +5% $312 | +10% $284 |
|---|---|---|---|---|---|
| Rent | -10% $237 | -5% $289 | +0% $340 | +5% $391 | +10% $443 |
| Rate | -1.0pp $390 | -0.5pp $366 | base $340 | +0.5pp $314 | +1.0pp $288 |
UW: 25.0% down · 7.5% · 30yr · 1.5% tax · 5.0% vac · 8.0% maint · 8.0% mgmt
Financing live
Cash to close
- Down payment
- $24,975
- Closing costs
- $2,997
- Reserves months
- —
- Total cash needed
- —
Loan-product check · same deal, 3 products live
Conventional
25% down · 7.5% · 30yr
- Down + closing
- —
- Monthly P&I
- —
- Monthly cashflow
- —
- DSCR
- —
- Eligible?
- —
Personal DTI + credit; lowest rate.
DSCR
20% down · 8.5% · 30yr
- Down + closing
- —
- Monthly P&I
- —
- Monthly cashflow
- —
- DSCR
- —
- Eligible?
- —
No personal income docs; deal must DSCR.
Hard money
10% down · 12.0% · 12mo
- Down + closing
- —
- Monthly P&I
- —
- Monthly cashflow
- —
- DSCR
- —
- Eligible?
- —
Short-term bridge; refi at stabilization.
Rent comps 10 comps
| Address | Beds | Baths | Sqft | Rent | $/sqft | DOM | Units | Dist |
|---|---|---|---|---|---|---|---|---|
| 1471 E Ireland Rd South Bend, IN | 3.0 | 2.0 | 1073 | $1,350 | $1.26 | 45d | 1 | 0.37mi |
| 922 Ridgedale Rd South Bend, IN | 2.0 | 1.0 | 864 | $1,200 | $1.39 | 15d | 1 | 0.61mi |
| 2032 Southern Vw Unit 1a South Bend, IN | 2.0 | 1.0 | 1000 | $1,200 | $1.20 | 15d | 1 | 0.65mi |
| 4245 Irish Hills Dr South Bend, IN | 1.0–2.0 | 1.0–1.5 | 739 | $1,436 | $1.94 | 15d | 77 | 1.01mi |
| 4005 Addison St South Bend, IN | 3.0 | 1.0 | 900 | $1,250 | $1.39 | 45d | 1 | 1.02mi |
| 1213 E Donald St South Bend, IN | 2.0 | 1.0 | 648 | $1,050 | $1.62 | 22d | 1 | 1.32mi |
| 2114 High St South Bend, IN | 3.0 | 1.0 | 949 | $1,300 | $1.37 | 45d | 1 | 1.36mi |
| 237 E Victoria St South Bend, IN | 3.0 | 1.0 | 840 | $995 | $1.18 | 45d | 1 | 1.38mi |
| 1701 E Donald St South Bend, IN | 2.0 | 1.0 | 720 | $1,075 | $1.49 | 45d | 1 | 1.38mi |
| 214 Altgeld St South Bend, IN | 2.0 | 1.0 | 950 | $1,200 | $1.26 | 22d | 1 | 1.43mi |
Listing history 7 events
-
2026-06-13statusdays on market $99,900 Pending 9 DOM
-
2026-06-10days on market $99,900 Active 8 DOM
-
2026-06-09days on market $99,900 Active 7 DOM
-
2026-06-08days on market $99,900 Active 6 DOM
-
2026-06-07days on market $99,900 Active 5 DOM
-
2026-06-03remarks 693-char remark
-
2026-06-03$99,900 Active 1 DOM
ⓘ Source: listings_history table (triggers on properties + properties_extension) + one-shot
backfill from property_details.listing_events for pre-trigger history.
Tax reassessment forecast IN · Partial reset (capped growth)
- Current annual tax
- $1,466 · $122/mo
- Projected year-2 tax
- $1,466 · $122/mo
- Expected delta
- $0/yr ($0/mo · 0.0%)
ⓘ Screening estimate from a state-policy table — verify with the county assessor before closing.
Climate risk First Street
- Flood 1/10 Low FEMA zone X (unshaded) · 0% chance over 30 yrs
- Wildfire 1/10 Low
- Heat 2/10 Low 7 d/yr ≥98°F today · 16 d/yr by 30 yrs out
- Wind 2/10 Low
- Air quality 2/10 Low 1 unhealthy d/yr today · 2 by 30 yrs out
Nearby sold comps map
Loading sold comps map…
Walkable amenities ~0.75 mi
Loading nearby amenities…
Taxation est. · year 1
- Rental income
- $15,612
- − Mortgage interest
- −$5,596
- − Property taxes
- −$1,466
- − Insurance
- −$500
- − Repairs & maintenance
- −$1,249
- − Management
- −$1,249
- − Depreciation
- −$2,906
- Taxable income
- $2,646
- Est. tax owed @ 24.0%
- −$635
- After-tax cash flow
- $3,446/yr
For passive investors: Depreciation is non-cash, so a rental often shows a tax loss while cash-flowing — sheltering income. Rental losses are passive: they offset passive income freely, and up to $25,000/yr can offset ordinary (W-2) income if you actively participate and your MAGI is under $100k (phasing out to $0 by $150k); unused losses carry forward. On sale, claimed depreciation is recaptured at up to 25%, and gains may owe capital-gains tax (a 1031 exchange can defer both). Figures are a year-1 estimate at your 24.0% rate — not tax advice; consult a CPA.
Schools (NCES district)
- District
- South Bend Community School Corporation
- NCES district ID
- 1810290
- Math proficiency
- 12% ▼ -10.00%
- Reading proficiency
- 21% ▼ -6.00%
- Median HH income
- $41,935
- Composite
- 14.21/100
- National rank
- #9452
- State rank
- #284 of 301 in IN
Livability — South Bend
- Score
- 64/100
- State rank
- #365
- US rank
- #13730
Category grades
Schools grade is shown separately in the Schools card above.
Census & demographics
- Census place
- South Bend, IN
- County
- Saint Joseph County · 189,048 people
- City population
- 99,767
- Metro
- South Bend-Mishawaka, IN-MI
- Population (ZIP)
- 29,602
- Household income
- $74,153
- Rent vs Own
- Severe rent burden
- 496.0
Population outlook (St. Joseph County) Hauer SSP2
- Today (2025)
- 273,186 people
- By 2030
- 273,594 · +0.1%
- By 2040
- 271,641 · -0.6%
- By 2050
- 269,187 · -1.5%
- By 2075
- 263,136 · -3.7%
- By 2100
- 245,659 · -10.1%
Race, ethnicity, and origin ACS 2023
- Neighborhood character
- Predominantly White (71%)
- Race & ethnicity
- White 71% Black 13% Two or more races 10% Hispanic / Latino 9% Asian 2%
- Hispanic origin (detail)
- Mexican 7%
- Common ancestry
- Romanian 8% Italian 2% Iranian 2%
- Foreign-born
- 5% · Canada, South Korea, Jamaica
- Languages at home
- 92% English-only · Spanish 4%
Political lean MEDSL · St. Joseph
- 2024 margin
- Toss-up / Even · D 50.0% · R 48.5% · Other 1.5%
- 2008→2024 swing
- -15.6pp toward R · 2008: 17.1pp · 2024: 1.5pp
- All cycles
- 2024: D+1.5 2020: D+5.8 2016: D+0.2 2012: D+3.5 2008: D+17.1
Not yet ingested
- Civics
- —
Market trends
- HPI YoY
- ▼ -100.12%
- Current HPI
- 212.2634
- Rent YoY
- —
- Metro
- South Bend-Mishawaka, IN-MI
- State GDP YoY
- ▲ 2.90%
- F500 in state
- 18
Industry mix (Fortune 500 HQ in IN)
| Industry | F500 HQs | Revenue |
|---|---|---|
| Industrial Machinery | 2 | $37B |
|
||
| Healthcare | 1 | $177B |
|
||
| Pharmaceuticals | 1 | $45B |
|
||
| Metals / Steel | 1 | $18B |
|
||
| Agriculture | 1 | $17B |
|
||
| Packaging | 1 | $12B |
|
||
Price history
+99.8% since first listed2 events — show timeline
- 2026-06-02 Listed $99,900 IRMLS
- 2026-04-30 Sold (Public Records) $50,000 Public Records
Property tax history
+6.2%/yrLatest (2024): $1,466 · +4.9% YoY. Source: county tax records.
Cash-flow waterfall
monthlySold comps — $/sqft
last 12 mo · ≤1 miLoading sold comps…