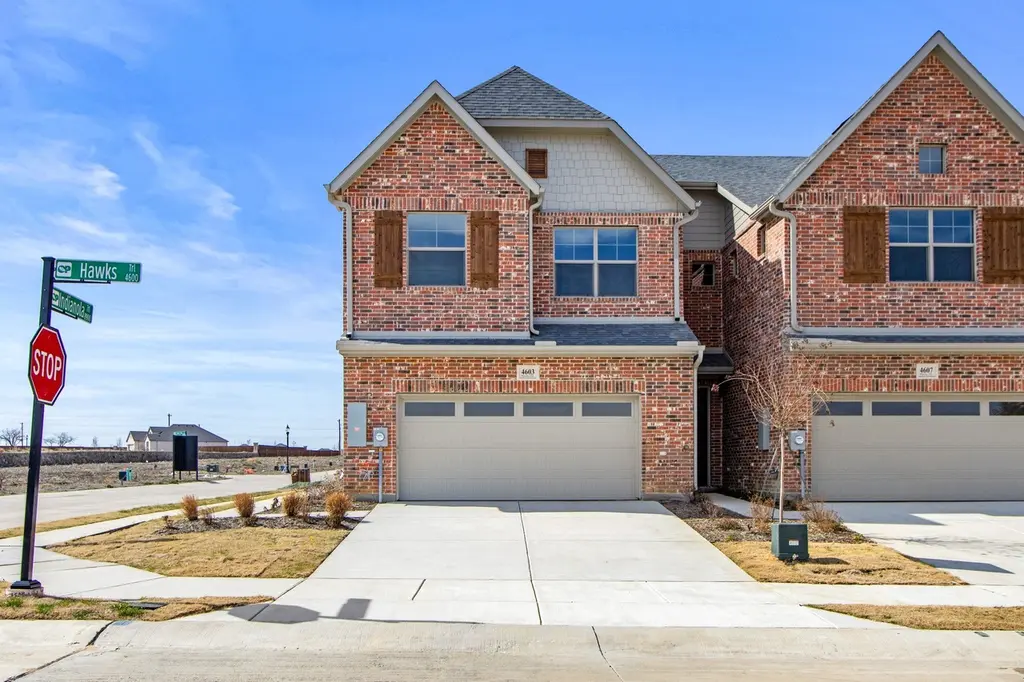
4603 Hawks Trl · Oak Point, TX
Flood risk 1/10 · Minimal
- FEMA flood zone
- X (unshaded)
- Chance of flooding over 30 yrs
- 0.0%
- Est. flood insurance / yr
- $507 – $1,088
Fire risk 4/10 · Minor
- Est. fire insurance / yr
- $1,222 – $2,270
Heat risk 7/10 · Major
- Hot days now (above 109°F)
- 7 days/yr
- Hot days in 30 yrs
- 23 days/yr
Wind risk 5/10 · Moderate
- Chance of severe wind over 30 yrs
- 26.0%
Air-quality risk 4/10 · Minor
- Unhealthy air days now
- 4 days/yr
- Unhealthy air days in 30 yrs
- 5 days/yr
Risk factors via First Street. Map © Google.
Why this score? — see what drove the D- grade
The composite is a weighted blend of 9 inputs, each scored 0–100. Each bar is that input's sub-score; the figure is the points it added to the 100-point composite (weight × sub-score).
- ARV discount +15.0/15.0
- Cash flow +7.9/30.0
- Schools +3.5/10.0
- Livability +3.2/5.0
- 1% rule +2.9/10.0
- Condition / age +2.5/5.0
- Rent growth +2.1/5.0
- DSCR +2.0/10.0
- Appreciation +0.0/10.0
$314,900
🖨 Deal sheet 📄 Offer letter ✓ Due diligence
Listing remarks
MLS# 21258028 - Built by Grenadier Investments - Ready Now! ~ STARTING MAY 1st. .. . Wildridge Townhomes is announcing NEW and IMPROVED ONLINE PRICING, PLUS $15,000 Flex Cash on ALL MOVE IN READY HOMES!!! Buyers can choose how to use the $15,000 Flex Cash—Buyers can deduct the $15,000 directly from the online price of the home, towards closing costs, to buy the interest rate down, or Any Combination of the three. The online price of this home has the $15,000 already deducted as an example. Brand-new lock-and-leave luxury from Grenadier Homes in the sought-after Wildridge neighborhood. Three beds, two-and-a-half baths, 1,863 sq ft of smart-sized design with large two-car garage: open k
Key facts
- Stainless appliances
- Energy-efficient
- $108 HOA
Tags
Property features AI
Finance
- Other: Community amenities include clubhouse, community pool, community dock, fishing, greenbelt, jogging/bike paths, lake, park, playground, sidewalks, and community sprinkler
- Financial info: No second mortgage
- HOA & community: Mandatory association with monthly fee (managed by CCMC); Association fee includes insurance, grounds and structure maintenance, management fees, and full use of facilities
Exterior
- Parking: 2-car garage with garage door opener; 2 covered parking spaces
- Security: Smoke detectors; Carbon monoxide detector(s); Fire sprinkler system; Firewalls; Wireless security features; Other security features
- Utilities: City water and city sewer; Electricity available and connected; Individual gas meter and individual water meter; Community mailbox; Sidewalks and curbs; Underground utilities
- Home design: Townhouse (attached); Two levels; New construction completed in 2025; Smart home features included; Planned development: Wildridge
- Construction: Brick and stucco exterior; Composition/shingle roof; Slab foundation; Year built 2025
- Exterior features: Private yard with outdoor living center; Private entrance; Playground; Gutters; Back yard and front yard fencing (full) with gate; wood and wrought iron options; Large backyard grass, landscaped with few trees; Sprinkler system; Tank/pond and water/lake view; Corner lot; Subdivision setting
Interior
- Kitchen: Dishwasher; Disposal; Electric oven; Microwave; Vented exhaust fan; Granite countertops; Kitchen island; Eat-in kitchen
- Bedrooms: 3 bedrooms (primary bedroom on level 2, additional bedrooms on level 2)
- Flooring: Carpet; Ceramic tile; Luxury vinyl plank; Tile
- Bathrooms: 2 full bathrooms and 1 half bathroom
- Heating & cooling: Central heating; Central air
- Interior features: Open floorplan with vaulted ceilings; Decorative lighting; Flat screen wiring and wired for data; Cable TV and high-speed internet available; Granite counters; Kitchen island; Pantry; Double vanity; Walk-in closet(s)
- Laundry & utility: Full-size washer/dryer area; Washer hookup; Electric dryer hookup; Utility room; Electric water heater
Neighborhood map
What this means for you Summary
Snapshot
- This is a 3-bed/2.5-bath townhouse listed at $315k.
Deal economics
- At list price, monthly cash flow is $-331 ($-4k/yr) — negative.
- To cash-flow at today's rent, offer at most $267k (15.2% below list).
- To meet the 1% rule (rent ≥ 1% of price), the offer needs to be $247k (21.5% below list).
- Recommended offer: $247k (21.5% below list) — sets the bar for 1% rule.
- Cap rate 5.0% vs local median 3.4% in Oak Point — top-decile yield for the area; either an underpriced asset or a hidden risk that comps aren't pricing in. Stress-test before assuming the spread holds.
Location & tenants
- Location reads 63/100 on livability (#887 in TX) — a middle-class / working-renter tenant base. Strengths: crime A+, employment A+, housing A+; Watch: cost of living D+, amenities F, commute F.
- Denton ISD (urban): math 36% / reading 43% proficiency, ranked #383 of 826 in TX (top 46%) — families likely to look elsewhere, expect single-tenant / working-renter base with shorter leases.
- Market conditions: Rents soft (-1.5%/yr); 1306 active listings in the ZIP; 40 comparable units currently listed for rent nearby; rentals at typical pace (median 19d on market — plan ~3-4 weeks tenant-placement turnaround); high-income renter base; 10,531 units permitted in Denton County in 2024 (2,713 in 5+ unit buildings).
Forward outlook
- Local home prices are declining (-3.0%/yr); year-one equity from $2k of loan paydown is wiped out by about $9k of value loss. Plan a longer hold.
- Denton County population projected at +66% by 2050 — long-run rental-demand tailwind backs the buy-and-hold thesis.
Negotiation context
- It's been on market 34 days — a 3% lower offer ($305k) is reasonable based on typical stale-listing flexibility.
Risks & watch-outs
- Climate carrying-cost: moderate wind risk, 26% chance of damaging wind over 30y; extreme-heat days projected 7→23/yr by 2055 (HVAC capex compounding) — expect insurance premiums to compound above CPI over the hold.
Questions for the listing agent
- What do current leases actually rent for vs. the listed asking? Can we see a recent rent roll and the last 12 months of T-12 income?
- It's been on market 34 days. Have you received any prior offers? Is the seller open to a 21% concession, seller financing, or rate buy-down credit?
- What does the HOA fee cover, when was the last increase, and are there any pending special assessments or reserve-fund shortfalls?
- Is there a deadline driving the sale (1031 exchange, divorce, estate, relocation)? That informs how much negotiation room exists.
- The area grade is low — what's the realistic commute time and amenity access for the typical tenant pool here? Any planned neighborhood developments (good or bad) we should know about?
- What's the average days-on-market for RENTAL listings here right now (not sales)? A rising rental-DOM trend means longer vacancies and softer asking-rent achievability than the comps imply.
- What's the recent tenant-quality profile in this submarket — average credit score on applications, eviction rate, late-payment / NSF rate, and stable-employment percentage? A property-management company in the area should have these aggregated.
- How much new for-sale + rental construction is in the pipeline within 1–3 miles? Heavy new supply typically softens prices + rents 12–24 months out; constrained supply supports both.
Investment metrics
- 1% rule
- 0.79% ✗
- Cap rate
- 5.03%
- Cash-on-cash
- -4.51%
- DSCR
- 0.80
- GRM
- 10.6
CMA / ARV
- ARV (median comp)
- $384,900
- List price
- $314,900
- Delta
- -18.19%
- Verdict
- UNDERPRICED
- Comps
- 4 within 1.0 mi
Show comp detail 1 sale within ~0.75 mi
| Address | Dist | Beds/Ba | Sqft | Sold | Price | $/sf | Match |
|---|---|---|---|---|---|---|---|
| 4622 White Buffalo Trl | 0.09mi | 3/2.5 | 1,820 (+3%) | 2mo | $389,900 | $214 | 89 |
Match score weights: distance 35% · size 25% · config 20% · recency 20%. Top-matched comps best support the ARV.
Projected returns pro-forma
-3.0% appreciation · 0.0% rent growth · sell at horizon
- IRR
- -27.5%
- Equity multiple
- 0.10×
- Total profit
- $-79,252
- Equity at exit
- $46,953
- IRR
- -42.8%
- Equity multiple
- -0.40×
- Total profit
- $-123,739
- Equity at exit
- $27,227
Cash invested: $88,172 (down + closing). Projections, not guarantees.
Landlord ↔ Tenant lean methodology
- Overall (STATE)
- 87 Strongly Landlord-Friendly
- State Texas
- 87 Strongly Landlord-Friendly · R+5
- County
- — inherits STATE
- City
- — inherits STATE
ZIP-level market 75068
- Home prices YoY
- -25.5%
- Rents YoY
- -1.5%
- Active inventory
- 1306
- Price-to-rent
- 10.6×
Monthly cashflow live
- Estimated rent
- $2,472 high interval (Pro) →
- Mortgage (P&I)
- −$1,651
- Tax est. 1.5%
- −$394 /mo · $4,724/yr
- Insurance
- −$131
- HOA
- −$108
- Vacancy / Maint / Mgmt
- −$519
- Net cashflow
- $-331
Break-even live
UW: 25.0% down · 7.5% · 30yr · 1.5% tax · 5.0% vac · 8.0% maint · 8.0% mgmt
Financing live
Cash to close
- Down payment
- $78,725
- Closing costs
- $9,447
- Reserves months
- —
- Total cash needed
- —
Loan-product check · same deal, 3 products live
Conventional
25% down · 7.5% · 30yr
- Down + closing
- —
- Monthly P&I
- —
- Monthly cashflow
- —
- DSCR
- —
- Eligible?
- —
Personal DTI + credit; lowest rate.
DSCR
20% down · 8.5% · 30yr
- Down + closing
- —
- Monthly P&I
- —
- Monthly cashflow
- —
- DSCR
- —
- Eligible?
- —
No personal income docs; deal must DSCR.
Hard money
10% down · 12.0% · 12mo
- Down + closing
- —
- Monthly P&I
- —
- Monthly cashflow
- —
- DSCR
- —
- Eligible?
- —
Short-term bridge; refi at stabilization.
Rent comps 40 comps
| Address | Beds | Baths | Sqft | Rent | $/sqft | DOM | Units | Dist |
|---|---|---|---|---|---|---|---|---|
| 4123 Windy Point Rd Oak Point, TX | 4.0 | 3.0 | 2249 | $2,999 | $1.33 | 12d | 1 | 0.24mi |
| 8905 Deadwood Ln Aubrey, TX | 3.0 | 2.0 | 1403 | $2,290 | $1.63 | 15d | 1 | 0.58mi |
| 8924 Whirlwind Trl Aubrey, TX | 3.0 | 2.0 | 1433 | $1,995 | $1.39 | 17d | 1 | 0.61mi |
| 3140 Brazoria Dr Little Elm, TX | 4.0 | 3.0 | 1809 | $2,895 | $1.60 | 3d | 1 | 0.64mi |
| 9105 Buckeye Bnd Little Elm, TX | 3.0 | 2.0 | 1858 | $2,565 | $1.38 | 20d | 1 | 0.68mi |
| 9225 Buckeye Bnd Little Elm, TX | 4.0 | 3.0 | 1854 | $2,600 | $1.40 | 12d | 1 | 0.68mi |
| 8732 Whirlwind Trl Aubrey, TX | 3.0 | 2.0 | 1861 | $2,095 | $1.13 | 43d | 1 | 0.70mi |
| 1108 Cheyenne Dr Aubrey, TX | 3.0 | 2.0 | 1609 | $1,950 | $1.21 | 4d | 1 | 0.80mi |
| 8824 Sagebrush Trl Cross Roads, TX | 4.0 | 2.0 | 1959 | $2,100 | $1.07 | 3d | 1 | 0.83mi |
| 1108 Longhorn Dr Aubrey, TX | 3.0 | 2.0 | 1666 | $2,450 | $1.47 | 43d | 1 | 0.84mi |
| 9011 King Ranch Dr Cross Roads, TX | 4.0 | 2.5 | 2251 | $2,600 | $1.16 | 43d | 1 | 0.85mi |
| 8748 Sagebrush Trl Cross Roads, TX | 3.0 | 2.0 | 1881 | $2,195 | $1.17 | 18d | 1 | 0.88mi |
| 9620 Oxbow Ln Little Elm, TX | 4.0 | 3.0 | 2268 | $2,795 | $1.23 | 6d | 1 | 0.89mi |
| 8908 Wagon Trl Cross Roads, TX | 4.0 | 2.5 | 2353 | $2,172 | $0.92 | 5d | 1 | 0.91mi |
| 571 Lloyd's Rd Little Elm, TX | 1.0–4.0 | 1.0–4.0 | 1751 | $2,719 | $1.55 | 1d | 32 | 0.92mi |
| 8820 Wagon Trl Cross Roads, TX | 3.0 | 2.5 | 2400 | $2,000 | $0.83 | 7d | 1 | 0.93mi |
| 832 Cheyenne Dr Aubrey, TX | 3.0 | 2.0 | 1421 | $2,300 | $1.62 | 24d | 1 | 0.99mi |
| 579 Lloyd's Rd Unit 1102A Little Elm, TX | 3.0 | 3.0 | 1968 | $2,795 | $1.42 | 43d | 1 | 1.00mi |
| 9916 Echo Summit Dr Little Elm, TX | 3.0 | 2.0 | 2246 | $2,550 | $1.14 | 5d | 1 | 1.01mi |
| 8113 Spitfire Trl Aubrey, TX | 3.0 | 2.0 | 2337 | $2,400 | $1.03 | 43d | 1 | 1.01mi |
| 8720 Chisholm Trl Cross Roads, TX | 4.0 | 2.0 | 1881 | $1,950 | $1.04 | 43d | 1 | 1.03mi |
| 8821 Tumbleweed Dr Cross Roads, TX | 3.0 | 2.0 | 1378 | $1,950 | $1.42 | 18d | 1 | 1.05mi |
| 3609 Sabine Dr Little Elm, TX | 4.0 | 2.0 | 2033 | $2,395 | $1.18 | 10d | 1 | 1.05mi |
| 8621 Wagon Trl Cross Roads, TX | 3.0 | 2.0 | 1881 | $1,995 | $1.06 | 22d | 1 | 1.07mi |
| 8621 Wagon Trl Cross Roads, TX | 3.0 | 2.0 | 1881 | $1,995 | $1.06 | 43d | 1 | 1.07mi |
| 609 Racine Dr Little Elm, TX | 3.0 | 2.0 | 1862 | $2,600 | $1.40 | 43d | 1 | 1.07mi |
| 8404 Sioux Trl Aubrey, TX | 4.0 | 2.5 | 2573 | $2,800 | $1.09 | 24d | 1 | 1.10mi |
| 8621 Chisholm Trl Cross Roads, TX | 3.0 | 2.0 | 1374 | $1,795 | $1.31 | 43d | 1 | 1.11mi |
| 9005 Holliday Ln Aubrey, TX | 4.0 | 2.0 | 1557 | $2,100 | $1.35 | 11d | 1 | 1.13mi |
| 529 Cheyenne Dr Aubrey, TX | 3.0 | 2.0 | 1510 | $1,979 | $1.31 | 2d | 1 | 1.14mi |
| 436 Northbrook Ave Little Elm, TX | 3.0 | 2.0 | 1519 | $2,095 | $1.38 | 43d | 1 | 1.14mi |
| 608 Pawnee St Aubrey, TX | 4.0 | 2.0 | 2184 | $2,550 | $1.17 | 4d | 1 | 1.17mi |
| 9220 Stewart St Cross Roads, TX | 3.0 | 2.5 | 1888 | $2,400 | $1.27 | 12d | 1 | 1.18mi |
| 9016 Stewart St Cross Roads, TX | 3.0 | 2.0 | 1281 | $1,795 | $1.40 | 7d | 1 | 1.21mi |
| 608 Crazy Horse Dr Aubrey, TX | 3.0 | 2.0 | 1334 | $2,155 | $1.62 | 43d | 1 | 1.29mi |
| 213 Kistler Dr Little Elm, TX | 4.0 | 2.5 | 2470 | $2,495 | $1.01 | 22d | 1 | 1.30mi |
| 9201 Remington Dr Aubrey, TX | 3.0 | 2.0 | 1888 | $1,895 | $1.00 | 24d | 1 | 1.32mi |
| 3876 Lyndhurst Ave Little Elm, TX | 4.0 | 3.0 | 2471 | $2,500 | $1.01 | 43d | 1 | 1.32mi |
| 508 Crazy Horse Dr Aubrey, TX | 3.0 | 2.0 | 1820 | $2,579 | $1.42 | 2d | 1 | 1.33mi |
| 3837 Pennington Ave Little Elm, TX | 4.0 | 3.0 | 2431 | $2,650 | $1.09 | 2d | 1 | 1.33mi |
HOA detail
- Monthly dues
- $108 · $1,296/yr
Listing history 14 events
-
2026-06-07statusdays on market $314,900 Pending 34 DOM
-
2026-06-04days on market $314,900 Active 33 DOM
-
2026-06-03days on market $314,900 Active 32 DOM
-
2026-06-02days on market $314,900 Active 31 DOM
-
2026-06-01days on market $314,900 Active 30 DOM
-
2026-05-31days on market $314,900 Active 29 DOM
-
2026-05-06price $314,900 1561-char remark
-
2026-05-04price $329,900 1561-char remark
-
2026-05-02$314,900 Active 1561-char remark
-
2026-05-01price $329,900 1030-char remark
-
2026-04-03price $359,900 1030-char remark
-
2026-03-14price $374,900 1030-char remark
-
2026-01-08price $369,900 1030-char remark
-
2025-12-05$389,900 Active 1030-char remark
ⓘ Source: listings_history table (triggers on properties + properties_extension) + one-shot
backfill from property_details.listing_events for pre-trigger history.
Climate risk First Street
- Flood 1/10 Low FEMA zone X (unshaded) · 0% chance over 30 yrs
- Wildfire 4/10 Moderate
- Heat 7/10 Severe 7 d/yr ≥109°F today · 23 d/yr by 30 yrs out
- Wind 5/10 Major 26% chance of damaging wind over 30 yrs
- Air quality 4/10 Moderate 4 unhealthy d/yr today · 5 by 30 yrs out
Nearby sold comps map
Loading sold comps map…
Walkable amenities ~0.75 mi
Loading nearby amenities…
Taxation est. · year 1
- Rental income
- $29,669
- − Mortgage interest
- −$17,639
- − Property taxes
- −$4,724
- − Insurance
- −$1,574
- − Repairs & maintenance
- −$2,373
- − Management
- −$2,373
- − HOA
- −$1,296
- − Depreciation
- −$9,161
- Taxable loss
- −$9,472
- Est. tax savings @ 24.0%
- +$2,273
- After-tax cash flow
- $-1,699/yr
For passive investors: Depreciation is non-cash, so a rental often shows a tax loss while cash-flowing — sheltering income. Rental losses are passive: they offset passive income freely, and up to $25,000/yr can offset ordinary (W-2) income if you actively participate and your MAGI is under $100k (phasing out to $0 by $150k); unused losses carry forward. On sale, claimed depreciation is recaptured at up to 25%, and gains may owe capital-gains tax (a 1031 exchange can defer both). Figures are a year-1 estimate at your 24.0% rate — not tax advice; consult a CPA.
Schools (NCES district)
- District
- Denton ISD
- NCES district ID
- 4816740
- Math proficiency
- 36% ▼ -18.00%
- Reading proficiency
- 43% ▼ -9.00%
- Median HH income
- $58,913
- Composite
- 34.91/100
- National rank
- #5075
- State rank
- #383 of 826 in TX
Livability — Oak Point
- Score
- 63/100
- State rank
- #887
- US rank
- #15941
Category grades
Schools grade is shown separately in the Schools card above.
Census & demographics
- Census place
- Oak Point, TX
- County
- Denton County · 901,654 people
- Metro
- Dallas-Fort Worth-Arlington, TX
- Population (ZIP)
- 72,710
- Household income
- $126,635
- Rent vs Own
- Severe rent burden
- 829.0
Population outlook (Denton County) Hauer SSP2
- Today (2025)
- 1,053,010 people
- By 2030
- 1,192,269 · +13.2%
- By 2040
- 1,472,920 · +39.9%
- By 2050
- 1,746,506 · +65.9%
- By 2075
- 2,358,497 · +124.0%
- By 2100
- 2,779,183 · +163.9%
Race, ethnicity, and origin ACS 2023
- Neighborhood character
- Highly diverse neighborhood (Simpson 0.74)
- Race & ethnicity
- White 40% Hispanic / Latino 23% Black 19% Two or more races 15% Asian 12% Native American 1%
- Hispanic origin (detail)
- Mexican 17%
- Common ancestry
- Lithuanian 2% Italian 2% Slovak 1%
- Foreign-born
- 19% · Canada, South Korea, China
- Languages at home
- 71% English-only · Spanish 15% Other Asian/Pacific 5% Other Indo-European 4%
Political lean MEDSL · Denton
- 2024 margin
- R (+13.2) · D 42.7% · R 55.8% · Other 1.5%
- 2008→2024 swing
- +11.0pp toward D · 2008: -24.2pp · 2024: -13.2pp
- All cycles
- 2024: R+13.2 2020: R+8.1 2016: R+20.2 2012: R+31.7 2008: R+24.2
Not yet ingested
- Civics
- —
Market trends
- HPI YoY
- ▼ -85.41%
- Current HPI
- 249.755
- Rent YoY
- ▼ -1.50%
- Metro
- Dallas-Fort Worth-Arlington, TX
- State GDP YoY
- ▲ 3.95%
- F500 in state
- 110
Industry mix (Fortune 500 HQ in TX)
| Industry | F500 HQs | Revenue |
|---|---|---|
| Energy | 16 | $1,198B |
|
||
| Technology | 5 | $198B |
|
||
| Engineering / Construction | 4 | $72B |
|
||
| Energy Services | 3 | $60B |
|
||
| Utilities | 3 | $41B |
|
||
| Healthcare | 2 | $330B |
|
||
Price history
+0.0% since first listed6 events — show timeline
- 2026-06-05 Pending — NTREIS
- 2026-05-29 Price Changed $314,900 NTREIS
- 2026-05-27 Price Changed $329,900 NTREIS
- 2026-05-06 Price Changed $314,900 NTREIS
- 2026-05-04 Price Changed $329,900 NTREIS
- 2026-05-02 Listed $314,900 NTREIS
Cash-flow waterfall
monthlySold comps — $/sqft
last 12 mo · ≤1 miLoading sold comps…