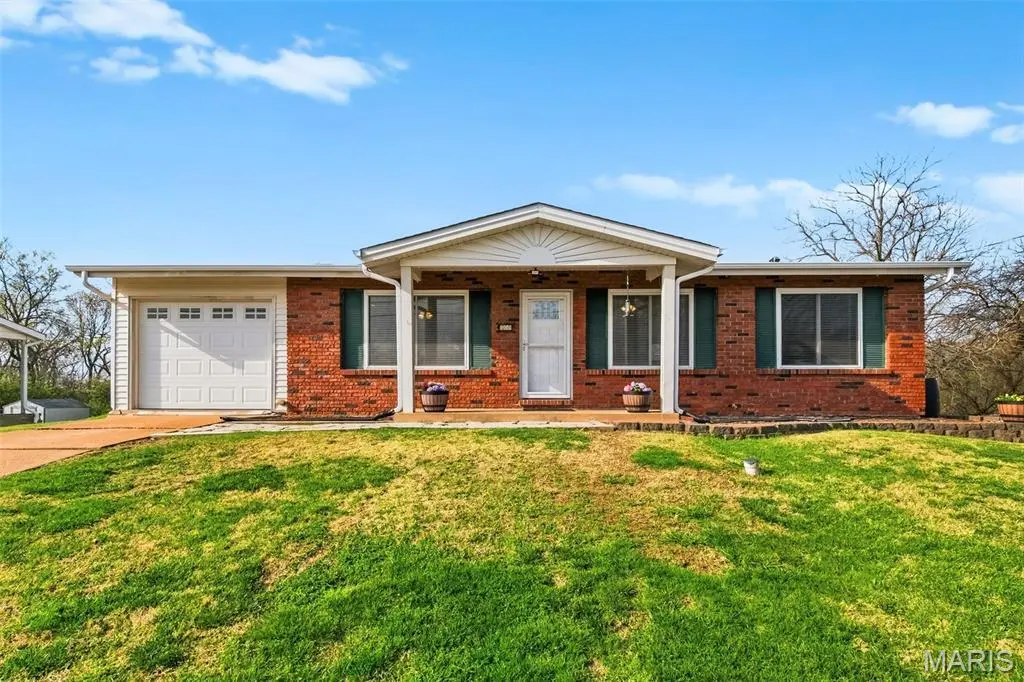
5248 Elaine Dr · Arnold, MO
Flood risk 1/10 · Minimal
- FEMA flood zone
- X (unshaded)
- Chance of flooding over 30 yrs
- 0.0%
- Est. flood insurance / yr
- $507 – $1,088
Fire risk 2/10 · Minimal
- Est. fire insurance / yr
- $1,054 – $1,958
Heat risk 4/10 · Minor
- Hot days now (above 106°F)
- 7 days/yr
- Hot days in 30 yrs
- 20 days/yr
Wind risk 2/10 · Minimal
- Chance of severe wind over 30 yrs
- 1.0%
Air-quality risk 3/10 · Minor
- Unhealthy air days now
- 1 days/yr
- Unhealthy air days in 30 yrs
- 4 days/yr
Risk factors via First Street. Map © Google.
Why this score? — see what drove the F grade
The composite is a weighted blend of 9 inputs, each scored 0–100. Each bar is that input's sub-score; the figure is the points it added to the 100-point composite (weight × sub-score).
- Cash flow +9.6/30.0
- ARV discount +7.5/15.0
- Schools +3.8/10.0
- Livability +3.1/5.0
- DSCR +2.7/10.0
- Rent growth +2.5/5.0
- Condition / age +2.5/5.0
- 1% rule +2.1/10.0
- Appreciation +0.0/10.0
$220,000
🖨 Deal sheet 📄 Offer letter ✓ Due diligence
Listing remarks
Welcome to 5248 Elaine! This charming ranch home is sure to steal your heart. Step inside to an open floor plan featuring beautiful wood floors throughout. The spacious living room flows seamlessly into the dining area and kitchen—perfect for large family gatherings or entertaining. The kitchen will impress any home chef with ample storage, a center island, and plenty of natural light. From here, step out onto the large deck—an ideal spot to enjoy your morning coffee or watch the kids play in the expansive backyard. Down the hall, you’ll find three nicely sized bedrooms, a full bath, and a convenient half bath in the primary suite. The partially finished basement offers ad
Key facts
- 0.32 acre lot
- Garage
- Built 1968
Property features AI
Finance
- Other: Owner-occupied tax designation; Lease not considered
- HOA & community: Randolph Hills Improvement Association, Inc.; Annual association fee of $200; Association provides common ground, grounds maintenance, common area maintenance, and snow removal
Exterior
- Parking: Attached garage with garage door opener (garage faces front); Driveway; Total parking for 3 vehicles; 1 garage space
- Security: Smoke detector(s)
- Utilities: Public water; Public sewer; Electric service by Ameren; Cable available; Natural gas available; Phone available; Electricity connected; Sewer connected; Water connected
- Home design: Single-family residence; Private ownership; Updated/remodeled condition; One level; House structure; Concrete road frontage on a city street
- Construction: Concrete construction; Architectural shingle roof; Concrete perimeter foundation; Built/area information from public records
- Exterior features: Covered patio/porch areas; Deck; Front porch; Back yard; Fenced yard with gate; Shed(s); French doors, sliding doors, panel and storm doors
Interior
- Kitchen: Stainless steel appliances; Dishwasher; Microwave; Electric range; Electric oven; Refrigerator; Ice maker; Vented exhaust fan
- Bedrooms: 3 bedrooms on the main level; Bedroom 2 on main level; Bedroom 3 on main level
- Flooring: Ceramic tile; Hardwood
- Bathrooms: 1 full bath (main level); 1 half bath (main level)
- Heating & cooling: Electric forced air heating; Central air conditioning; Ceiling fans; Electric cooling
- Interior features: Breakfast bar; Ceiling fans; Eat-in kitchen; Kitchen island; Kitchen/dining room combo; Open floorplan; Pantry; Smart thermostat; Blinds; Double-pane windows; Smoke detectors
- Laundry & utility: Washer; Dryer; Electric water heater
Neighborhood map
What this means for you Summary
Snapshot
- This is a 3-bed/1.5-bath other listed at $220k.
Deal economics
- At list price, monthly cash flow is $-148 ($-2k/yr) — negative.
- To cash-flow at today's rent, offer at most $194k (11.9% below list).
- To meet the 1% rule (rent ≥ 1% of price), the offer needs to be $156k (29.1% below list).
- Recommended offer: $156k (29.1% below list) — sets the bar for 1% rule.
- Cap rate 5.5% vs local median 4.1% in Arnold — top-decile yield for the area; either an underpriced asset or a hidden risk that comps aren't pricing in. Stress-test before assuming the spread holds.
Location & tenants
- Location reads 62/100 on livability (#396 in MO) — a middle-class / working-renter tenant base. Strengths: cost of living A+, housing A+, employment B; Watch: crime D+, amenities F, commute F.
- Fox C-6 (suburban): math 35% / reading 50% proficiency, ranked #103 of 324 in MO (top 32%) — families likely to look elsewhere, expect single-tenant / working-renter base with shorter leases.
- Zoned schools: Fox Elem. (math 33% / reading 39%, grade F, #662 of 1,115 statewide, top 60%, 380 students, 40% FRL); Fox Sr. High (math 12% / reading 57%, grade F, #321 of 521 statewide, top 67%, 1,742 students, 28% FRL).
- Market conditions: 151 active listings in the ZIP; 2 comparable units currently listed for rent nearby; solid renter incomes; 807 units permitted in Jefferson County in 2024 (104 in 5+ unit buildings).
Forward outlook
- Local home prices are declining (-3.0%/yr); year-one equity from $2k of loan paydown is wiped out by about $7k of value loss. Plan a longer hold.
Negotiation context
- Only 5 days on market — expect competitive offers; lowballing is unlikely to land.
- Current owner paid $99k; list at $220k implies a 122% gain — meaningful room to come down on a strong offer.
Questions for the listing agent
- What do current leases actually rent for vs. the listed asking? Can we see a recent rent roll and the last 12 months of T-12 income?
- Built in 1968 — when were the roof, HVAC, electrical panel, plumbing, and water heater last replaced?
- What does the HOA fee cover, when was the last increase, and are there any pending special assessments or reserve-fund shortfalls?
- Is there a deadline driving the sale (1031 exchange, divorce, estate, relocation)? That informs how much negotiation room exists.
- Schools are D-rated, which usually means shorter tenancies and higher turnover. Who's the typical renter profile here, and what's been the actual vacancy rate?
- Crime grade is D in this area — have there been break-ins, vandalism, or insurance claims at this property in the last 3 years? What carrier currently insures it and at what premium?
- The area grade is low — what's the realistic commute time and amenity access for the typical tenant pool here? Any planned neighborhood developments (good or bad) we should know about?
- What's the average days-on-market for RENTAL listings here right now (not sales)? A rising rental-DOM trend means longer vacancies and softer asking-rent achievability than the comps imply.
- What's the recent tenant-quality profile in this submarket — average credit score on applications, eviction rate, late-payment / NSF rate, and stable-employment percentage? A property-management company in the area should have these aggregated.
- How much new for-sale + rental construction is in the pipeline within 1–3 miles? Heavy new supply typically softens prices + rents 12–24 months out; constrained supply supports both.
Investment metrics
- 1% rule
- 0.71% ✗
- Cap rate
- 5.49%
- Cash-on-cash
- -2.88%
- DSCR
- 0.87
- GRM
- 11.8
CMA / ARV
No comps found within radius.
Projected returns pro-forma
-3.0% appreciation · 3.0% rent growth · sell at horizon
- IRR
- -21.1%
- Equity multiple
- 0.27×
- Total profit
- $-45,124
- Equity at exit
- $32,803
- IRR
- -14.7%
- Equity multiple
- 0.16×
- Total profit
- $-51,669
- Equity at exit
- $19,022
Cash invested: $61,600 (down + closing). Projections, not guarantees.
Landlord ↔ Tenant lean methodology
- Overall (STATE)
- 81 Strongly Landlord-Friendly
- State Missouri
- 81 Strongly Landlord-Friendly · R+10
- County
- — inherits STATE
- City
- — inherits STATE
ZIP-level market 63010
- Active inventory
- 151
- Price-to-rent
- 11.8×
Monthly cashflow live
- Estimated rent
- $1,559 medium interval (Pro) →
- Mortgage (P&I)
- −$1,154
- Tax from tax record
- −$117 /mo · $1,403/yr
- Insurance
- −$92
- HOA
- −$17
- Vacancy / Maint / Mgmt
- −$327
- Net cashflow
- $-148
Break-even live
UW: 25.0% down · 7.5% · 30yr · 1.5% tax · 5.0% vac · 8.0% maint · 8.0% mgmt
Financing live
Cash to close
- Down payment
- $55,000
- Closing costs
- $6,600
- Reserves months
- —
- Total cash needed
- —
Loan-product check · same deal, 3 products live
Conventional
25% down · 7.5% · 30yr
- Down + closing
- —
- Monthly P&I
- —
- Monthly cashflow
- —
- DSCR
- —
- Eligible?
- —
Personal DTI + credit; lowest rate.
DSCR
20% down · 8.5% · 30yr
- Down + closing
- —
- Monthly P&I
- —
- Monthly cashflow
- —
- DSCR
- —
- Eligible?
- —
No personal income docs; deal must DSCR.
Hard money
10% down · 12.0% · 12mo
- Down + closing
- —
- Monthly P&I
- —
- Monthly cashflow
- —
- DSCR
- —
- Eligible?
- —
Short-term bridge; refi at stabilization.
Rent comps 2 comps
| Address | Beds | Baths | Sqft | Rent | $/sqft | DOM | Units | Dist |
|---|---|---|---|---|---|---|---|---|
| 8 E Rock Creek Mnr Arnold, MO | 2.0 | 1.0 | 850 | $995 | $1.17 | 43d | 1 | 0.13mi |
| 3815 Treebrook Dr Imperial, MO | 2.0 | 1.5 | 900 | $1,095 | $1.22 | 2d | 1 | 1.35mi |
HOA detail
- Monthly dues
- $17 · $204/yr
Listing history 7 events
-
2026-04-14status Pending
-
2026-04-10$220,000 Active
-
2026-04-08historical $220,000
-
2007-12-31soldstatus
-
2007-12-31soldstatus
-
2003-07-14soldstatus
-
1999-11-30soldstatus $99,000
ⓘ Source: listings_history table (triggers on properties + properties_extension) + one-shot
backfill from property_details.listing_events for pre-trigger history.
Tax reassessment forecast MO · Resets to sale price
- Current annual tax
- $1,403 · $117/mo
- Projected year-2 tax
- $2,134 · $178/mo
- Expected delta
- +$731/yr (+$61/mo · 52.1%)
ⓘ Screening estimate from a state-policy table — verify with the county assessor before closing.
Climate risk First Street
- Flood 1/10 Low FEMA zone X (unshaded) · 0% chance over 30 yrs
- Wildfire 2/10 Low
- Heat 4/10 Moderate 7 d/yr ≥106°F today · 20 d/yr by 30 yrs out
- Wind 2/10 Low 100% chance of damaging wind over 30 yrs
- Air quality 3/10 Moderate 1 unhealthy d/yr today · 4 by 30 yrs out
Nearby sold comps map
Loading sold comps map…
Walkable amenities ~0.75 mi
Loading nearby amenities…
Taxation est. · year 1
- Rental income
- $18,706
- − Mortgage interest
- −$12,323
- − Property taxes
- −$1,403
- − Insurance
- −$1,100
- − Repairs & maintenance
- −$1,497
- − Management
- −$1,497
- − HOA
- −$204
- − Depreciation
- −$6,400
- Taxable loss
- −$5,717
- Est. tax savings @ 24.0%
- +$1,372
- After-tax cash flow
- $-401/yr
For passive investors: Depreciation is non-cash, so a rental often shows a tax loss while cash-flowing — sheltering income. Rental losses are passive: they offset passive income freely, and up to $25,000/yr can offset ordinary (W-2) income if you actively participate and your MAGI is under $100k (phasing out to $0 by $150k); unused losses carry forward. On sale, claimed depreciation is recaptured at up to 25%, and gains may owe capital-gains tax (a 1031 exchange can defer both). Figures are a year-1 estimate at your 24.0% rate — not tax advice; consult a CPA.
Schools (NCES district)
- District
- Fox C-6
- NCES district ID
- 2912300
- Math proficiency
- 35% ▼ -11.00%
- Reading proficiency
- 50% ▼ -4.00%
- Median HH income
- $60,849
- Composite
- 37.54/100
- National rank
- #4392
- State rank
- #103 of 324 in MO
Livability — Arnold
- Score
- 62/100
- State rank
- #396
- US rank
- #17082
Category grades
Schools grade is shown separately in the Schools card above.
Census & demographics
- County
- Jefferson County · 108,544 people
- City population
- 34,478
- Metro
- St. Louis, MO-IL
- Population (ZIP)
- 34,478
- Household income
- $79,784
- Rent vs Own
- Severe rent burden
- 422.0
Population outlook (Jefferson County) Hauer SSP2
- Today (2025)
- 235,088 people
- By 2030
- 238,365 · +1.4%
- By 2040
- 240,156 · +2.2%
- By 2050
- 234,651 · -0.2%
- By 2075
- 214,569 · -8.7%
- By 2100
- 179,697 · -23.6%
Race, ethnicity, and origin ACS 2023
- Neighborhood character
- Predominantly White (90%)
- Race & ethnicity
- White 90% Two or more races 6% Hispanic / Latino 2% Asian 1%
- Common ancestry
- Lithuanian 4% American 3% Romanian 2%
- Foreign-born
- 5% · Canada, China
- Languages at home
- 93% English-only · Russian/Polish/Slavic 3% Spanish 1% Chinese 1%
Political lean MEDSL · Jefferson
- 2024 margin
- Solid R (+36.7) · D 31.0% · R 67.7% · Other 1.3%
- 2008→2024 swing
- -39.3pp toward R · 2008: 2.5pp · 2024: -36.7pp
- All cycles
- 2024: R+36.7 2020: R+33.9 2016: R+35.3 2012: R+12.7 2008: D+2.5
Not yet ingested
- Civics
- —
Market trends
- HPI YoY
- ▼ -258.53%
- Current HPI
- 190.586
- Rent YoY
- —
- Metro
- St. Louis, MO-IL
- State GDP YoY
- ▲ 1.84%
- F500 in state
- 20
Industry mix (Fortune 500 HQ in MO)
| Industry | F500 HQs | Revenue |
|---|---|---|
| Healthcare | 1 | $163B |
|
||
| Insurance | 1 | $21B |
|
||
| Industrial Technology | 1 | $17B |
|
||
| Retail | 1 | $16B |
|
||
| Industrial Distribution | 1 | $10B |
|
||
| Utilities | 1 | $9B |
|
||
Price history
+122.2% since first listed7 events — show timeline
- 2026-04-14 Pending — MARIS as Distributed by MLS Grid
- 2026-04-10 Listed $220,000 MARIS as Distributed by MLS Grid
- 2026-04-08 Coming Soon $220,000 MARIS as Distributed by MLS Grid
- 2007-12-31 Sold (Public Records) — Public Records
- 2007-12-31 Sold (Public Records) — Public Records
- 2003-07-14 Sold (Public Records) — Public Records
- 1999-11-30 Sold (Public Records) $99,000 Public Records
Property tax history
+3.6%/yrLatest (2025): $1,403 · +8.6% YoY. Source: county tax records.
Cash-flow waterfall
monthlySold comps — $/sqft
last 12 mo · ≤1 miLoading sold comps…