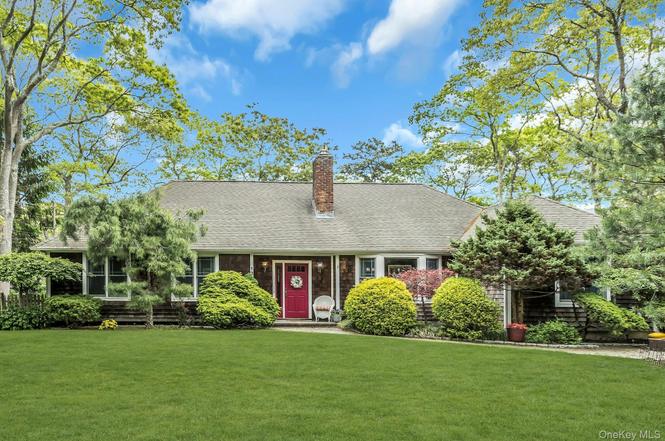
13 Delacey Ave · East Quogue, NY
Flood risk 4/10 · Minor
- FEMA flood zone
- X (unshaded)
- Chance of flooding over 30 yrs
- 0.2%
- Est. flood insurance / yr
- $473 – $860
Fire risk 2/10 · Minimal
- Est. fire insurance / yr
- $691 – $1,283
Heat risk 4/10 · Minor
- Hot days now (above 90°F)
- 7 days/yr
- Hot days in 30 yrs
- 19 days/yr
Wind risk 8/10 · Major
- Chance of severe wind over 30 yrs
- 80.0%
Air-quality risk 3/10 · Minor
- Unhealthy air days now
- 2 days/yr
- Unhealthy air days in 30 yrs
- 3 days/yr
Risk factors via First Street. Map © Google.
Why this score? — see what drove the B- grade
The composite is a weighted blend of 9 inputs, each scored 0–100. Each bar is that input's sub-score; the figure is the points it added to the 100-point composite (weight × sub-score).
- Cash flow +30.0/30.0
- 1% rule +10.0/10.0
- DSCR +10.0/10.0
- ARV discount +5.8/15.0
- Schools +5.0/10.0
- Livability +3.1/5.0
- Rent growth +2.5/5.0
- Condition / age +2.5/5.0
- Appreciation +0.0/10.0
$929,000
🖨 Deal sheet 📄 Offer letter ✓ Due diligence
Listing remarks
Welcome to Hamptons Living! You Must See This Charming, Lovingly Maintained, 4-Bedroom, 2.5 Bath, Ranch Home Nestled in Private Oakwood Estates in Wonderful East Quogue. This Gem, Situated on a Lovely . 40 Acre Parcel, Features Hardwood Floors, Recessed Lighting, Ceiling and Floor Moldings and a Brick Fireplace in the Living Room. Enjoy the Fireplace While Relaxing in the Living Room or While Taking Pleasure in a Lovely Meal Served in the Dining Room. The Well-Appointed, Eat-In-Kitchen Makes Cooking a Breeze. Granite Counters, Comfortable Wood Floors and Plenty of Cabinetry, as well as a Pantry Closet. The Extension Consists of a Wonderful Den and the Spacious Primary Bedroom With Walk-In C
Key facts
- Eat-in-kitchen
- Brick fireplace
- Recessed lighting
Tags
Neighborhood map
What this means for you Summary
Snapshot
- This is a 3-bed/2.0-bath single-family listed at $929k.
Deal economics
- At list price, monthly cash flow is $21k ($253k/yr) — positive.
- The deal already cash-flows at list — no discount required.
- Meets the 1% rule at list price ($34k rent vs $929k).
- Recommended offer: $818k (12.0% below list) — sets the bar for market timing.
- Cap rate 33.5% vs local median 10.6% in East Quogue — top-decile yield for the area; either an underpriced asset or a hidden risk that comps aren't pricing in. Stress-test before assuming the spread holds.
Location & tenants
- Location reads 61/100 on livability (#943 in NY) — a middle-class / working-renter tenant base. Strengths: crime A+, employment A+; Watch: amenities F, commute F, cost of living F.
- East Quogue Union Free School District (suburban): math 55% / reading 50% proficiency, ranked #342 of 755 in NY (top 45%) — acceptable for families but not a draw, mixed tenant base, ~2y average lease; only 15% free/reduced lunch — higher-income household profile.
- Market conditions: 75 active listings in the ZIP; 5 comparable units currently listed for rent nearby; rentals at typical pace (median 25d on market — plan ~3-4 weeks tenant-placement turnaround); 1,366 units permitted in Suffolk County in 2024 (216 in 5+ unit buildings).
Forward outlook
- Local home prices are declining (-3.0%/yr); year-one equity from $6k of loan paydown is wiped out by about $28k of value loss. Plan a longer hold.
- Suffolk County population projected to shrink 5% by 2050 — rents likely to lag national; underwrite the cash flow, not the appreciation.
- At projected returns (-3.0% appreciation + 3.0% rent growth), your $260k cash investment doubles in ~2 years — after that, you're playing with house money.
Negotiation context
- It's been on market 302 days — a 12% lower offer ($818k) is reasonable based on typical stale-listing flexibility.
- 2 sale attempts since 22y ago; this cycle's ask has dropped $70k (7%) from the opening price — seller is motivated, your offer sets the floor, not the list.
- Current owner paid $575k; list at $929k implies a 62% gain — meaningful room to come down on a strong offer.
Risks & watch-outs
- Climate carrying-cost: severe wind risk, 80% chance of damaging wind over 30y — expect insurance premiums to compound above CPI over the hold.
Questions for the listing agent
- It's been on market 302 days. Have you received any prior offers? Is the seller open to a 12% concession, seller financing, or rate buy-down credit?
- Built in 1974 — when were the roof, HVAC, electrical panel, plumbing, and water heater last replaced?
- Why hasn't it sold? Are there any deal-killer items the seller is aware of (foundation, flood, title, zoning, code violations)?
- Is there a deadline driving the sale (1031 exchange, divorce, estate, relocation)? That informs how much negotiation room exists.
- Schools are B-rated — typically a magnet for longer-tenancy family renters. What's the average tenant stay here, and is there a school-zone premium baked into asking?
- What's the average days-on-market for RENTAL listings here right now (not sales)? A rising rental-DOM trend means longer vacancies and softer asking-rent achievability than the comps imply.
- What's the recent tenant-quality profile in this submarket — average credit score on applications, eviction rate, late-payment / NSF rate, and stable-employment percentage? A property-management company in the area should have these aggregated.
- How much new for-sale + rental construction is in the pipeline within 1–3 miles? Heavy new supply typically softens prices + rents 12–24 months out; constrained supply supports both.
Investment metrics
- 1% rule
- 3.65% ✓
- Cap rate
- 33.50%
- Cash-on-cash
- 97.17%
- DSCR
- 5.32
- GRM
- 2.3
CMA / ARV
- ARV (on-the-fly)
- $895,500
- Comps found
- 1
Show comp detail 1 sale within ~0.75 mi
| Address | Dist | Beds/Ba | Sqft | Sold | Price | $/sf | Match |
|---|---|---|---|---|---|---|---|
| 13 Delacey Ave | 0.00mi | 4/2.5 (+1) | 1,800 (+0%) | 1mo | $900,000 | $500 | 92 |
Match score weights: distance 35% · size 25% · config 20% · recency 20%. Top-matched comps best support the ARV.
Projected returns pro-forma
-3.0% appreciation · 3.0% rent growth · sell at horizon
- IRR
- 98.1%
- Equity multiple
- 5.58×
- Total profit
- $1,191,093
- Equity at exit
- $138,517
- IRR
- —
- Equity multiple
- 11.63×
- Total profit
- $2,764,957
- Equity at exit
- $80,323
Cash invested: $260,120 (down + closing). Projections, not guarantees.
Landlord ↔ Tenant lean methodology
- Overall (STATE)
- 15 Strongly Tenant-Friendly
- State New York
- 15 Strongly Tenant-Friendly · D+10
- County
- — inherits STATE
- City
- — inherits STATE
ZIP-level market 11942
- Home prices YoY
- -25.0%
- Active inventory
- 75
- Price-to-rent
- 2.3×
Monthly cashflow live
- Estimated rent
- $33,891 high interval (Pro) →
- Mortgage (P&I)
- −$4,872
- Tax from tax record
- −$452 /mo · $5,420/yr
- Insurance
- −$387
- HOA
- −$0
- Vacancy / Maint / Mgmt
- −$7,117
- Net cashflow
- $21,064
Break-even live
UW: 25.0% down · 7.5% · 30yr · 1.5% tax · 5.0% vac · 8.0% maint · 8.0% mgmt
Financing live
Cash to close
- Down payment
- $232,250
- Closing costs
- $27,870
- Reserves months
- —
- Total cash needed
- —
Loan-product check · same deal, 3 products live
Conventional
25% down · 7.5% · 30yr
- Down + closing
- —
- Monthly P&I
- —
- Monthly cashflow
- —
- DSCR
- —
- Eligible?
- —
Personal DTI + credit; lowest rate.
DSCR
20% down · 8.5% · 30yr
- Down + closing
- —
- Monthly P&I
- —
- Monthly cashflow
- —
- DSCR
- —
- Eligible?
- —
No personal income docs; deal must DSCR.
Hard money
10% down · 12.0% · 12mo
- Down + closing
- —
- Monthly P&I
- —
- Monthly cashflow
- —
- DSCR
- —
- Eligible?
- —
Short-term bridge; refi at stabilization.
Rent comps 5 comps
| Address | Beds | Baths | Sqft | Rent | $/sqft | DOM | Units | Dist |
|---|---|---|---|---|---|---|---|---|
| 30 Lewis Rd East Quogue, NY | 4.0 | 4.0 | 1592 | $30,000 | $18.84 | 43d | 1 | 0.96mi |
| 32 Lewis Rd East Quogue, NY | 4.0 | 2.0 | 1666 | $30,000 | $18.01 | 24d | 1 | 0.98mi |
| 73 Spinney Rd East Quogue, NY | 3.0 | 2.5 | 2400 | $25,000 | $10.42 | 19d | 1 | 1.32mi |
| 1 Whippoorwill Ln East Quogue, NY | 4.0 | 4.0 | 2483 | $29,000 | $11.68 | 5d | 1 | 1.37mi |
| 588 Pleasure Dr Riverhead, NY | 4.0 | 4.0 | 2225 | $60,000 | $26.97 | 24d | 1 | 1.41mi |
Listing history 9 events
-
2026-03-19status Pending
-
2025-10-22price $929,000
-
2025-08-11price $959,000
-
2025-05-16$999,000 Active
-
2005-06-21soldstatus $575,000
-
2005-03-21historical
-
2004-09-27$575,000
-
2003-02-04soldstatus $275,000
-
1989-10-19soldstatus $147,500
ⓘ Source: listings_history table (triggers on properties + properties_extension) + one-shot
backfill from property_details.listing_events for pre-trigger history.
Tax reassessment forecast NY · Partial reset (capped growth)
- Current annual tax
- $5,420 · $452/mo
- Projected year-2 tax
- $10,560 · $880/mo
- Expected delta
- +$5,140/yr (+$428/mo · 94.8%)
ⓘ Screening estimate from a state-policy table — verify with the county assessor before closing.
Climate risk First Street
- Flood 4/10 Moderate FEMA zone X (unshaded) · 20% chance over 30 yrs
- Wildfire 2/10 Low
- Heat 4/10 Moderate 7 d/yr ≥90°F today · 19 d/yr by 30 yrs out
- Wind 8/10 Severe 80% chance of damaging wind over 30 yrs
- Air quality 3/10 Moderate 2 unhealthy d/yr today · 3 by 30 yrs out
Nearby sold comps map
Loading sold comps map…
Walkable amenities ~0.75 mi
Loading nearby amenities…
Taxation est. · year 1
- Rental income
- $406,696
- − Mortgage interest
- −$52,038
- − Property taxes
- −$5,420
- − Insurance
- −$4,645
- − Repairs & maintenance
- −$32,536
- − Management
- −$32,536
- − Depreciation
- −$27,025
- Taxable income
- $252,496
- Est. tax owed @ 24.0%
- −$60,599
- After-tax cash flow
- $192,165/yr
For passive investors: Depreciation is non-cash, so a rental often shows a tax loss while cash-flowing — sheltering income. Rental losses are passive: they offset passive income freely, and up to $25,000/yr can offset ordinary (W-2) income if you actively participate and your MAGI is under $100k (phasing out to $0 by $150k); unused losses carry forward. On sale, claimed depreciation is recaptured at up to 25%, and gains may owe capital-gains tax (a 1031 exchange can defer both). Figures are a year-1 estimate at your 24.0% rate — not tax advice; consult a CPA.
Schools (NCES district)
- District
- East Quogue Union Free School District
- NCES district ID
- 3609900
- Math proficiency
- 55% ▬ 0.00%
- Reading proficiency
- 50% ▲ 5.00%
- Median HH income
- $81,457
- Composite
- 49.79/100
- National rank
- #4207
- State rank
- #342 of 755 in NY
Livability — East Quogue
- Score
- 61/100
- State rank
- #943
- US rank
- #18348
Category grades
Schools grade is shown separately in the Schools card above.
Census & demographics
- Census place
- East Quogue, NY
- City population
- 5,871
- Population (ZIP)
- 5,871
Population outlook (Suffolk County) Hauer SSP2
- Today (2025)
- 1,505,262 people
- By 2030
- 1,498,318 · -0.5%
- By 2040
- 1,471,101 · -2.3%
- By 2050
- 1,424,848 · -5.3%
- By 2075
- 1,337,157 · -11.2%
- By 2100
- 1,217,720 · -19.1%
Race, ethnicity, and origin ACS 2023
- Neighborhood character
- Predominantly White (80%)
- Race & ethnicity
- White 80% Hispanic / Latino 16% Asian 2% Two or more races 2%
- Hispanic origin (detail)
- Mexican 3%
- Common ancestry
- Romanian 6% Scotch-Irish 3% Lithuanian 3%
- Foreign-born
- 13% · Canada, Jamaica, Guatemala
- Languages at home
- 80% English-only · Spanish 12% Other Indo-European 2% Russian/Polish/Slavic 2%
Political lean MEDSL · Suffolk
- 2024 margin
- Lean R (+10.0) · D 45.0% · R 55.0%
- 2008→2024 swing
- -16.0pp toward R · 2008: 6.0pp · 2024: -10.0pp
- All cycles
- 2024: R+10.0 2020: R+0.0 2016: R+8.2 2012: D+2.9 2008: D+6.0
Not yet ingested
- Civics
- —
Market trends
- HPI YoY
- ▼ -145.33%
- Current HPI
- 435.8017
- Rent YoY
- —
- Metro
- —
- State GDP YoY
- ▲ 2.60%
- F500 in state
- 92
Industry mix (Fortune 500 HQ in NY)
| Industry | F500 HQs | Revenue |
|---|---|---|
| Financial Services | 10 | $950B |
|
||
| Consumer Goods | 9 | $162B |
|
||
| Insurance | 4 | $225B |
|
||
| Telecommunications | 2 | $144B |
|
||
| Pharmaceuticals | 2 | $112B |
|
||
| Media / Entertainment | 2 | $69B |
|
||
Price history
+529.8% since first listed9 events — show timeline
- 2026-03-19 Pending — OneKey® MLS as Distributed by MLS Grid
- 2025-10-22 Price Changed $929,000 OneKey® MLS as Distributed by MLS Grid
- 2025-08-11 Price Changed $959,000 OneKey® MLS as Distributed by MLS Grid
- 2025-05-16 Listed $999,000 OneKey® MLS as Distributed by MLS Grid
- 2005-06-21 Sold (Public Records) $575,000 Public Records
- 2005-03-21 Listing Removed — OneKey® MLS as Distributed by MLS Grid
- 2004-09-27 Listed $575,000 OneKey® MLS as Distributed by MLS Grid
- 2003-02-04 Sold (Public Records) $275,000 Public Records
- 1989-10-19 Sold (Public Records) $147,500 Public Records
Property tax history
+0.7%/yrLatest (2022): $5,420 · +0.0% YoY. Source: county tax records.
Cash-flow waterfall
monthlySold comps — $/sqft
last 12 mo · ≤1 miLoading sold comps…