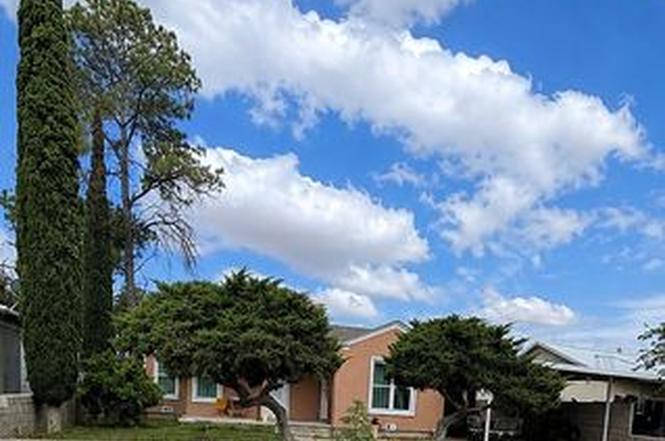
926 Myer Ln · Kermit, TX
Flood risk 7/10 · Major
- FEMA flood zone
- —
- Chance of flooding over 30 yrs
- 0.94%
- Est. flood insurance / yr
- —
Fire risk 9/10 · Severe
- Est. fire insurance / yr
- $1,222 – $2,270
Heat risk 6/10 · Moderate
- Hot days now (above 103°F)
- 5 days/yr
- Hot days in 30 yrs
- 16 days/yr
Wind risk 2/10 · Minimal
- Chance of severe wind over 30 yrs
- 1.0%
Air-quality risk 1/10 · Minimal
- Unhealthy air days now
- 0 days/yr
- Unhealthy air days in 30 yrs
- 0 days/yr
Risk factors via First Street. Map © Google.
Why this score? — see what drove the B- grade
The composite is a weighted blend of 9 inputs, each scored 0–100. Each bar is that input's sub-score; the figure is the points it added to the 100-point composite (weight × sub-score).
- Cash flow +24.1/30.0
- Appreciation +10.0/10.0
- DSCR +7.8/10.0
- ARV discount +7.5/15.0
- 1% rule +5.3/10.0
- Livability +3.1/5.0
- Schools +2.6/10.0
- Rent growth +2.5/5.0
- Condition / age +2.5/5.0
$175,000
🖨 Deal sheet 📄 Offer letter ✓ Due diligence
Listing remarks MLS
This cozy home features 3 bedrooms, 1 bath and a beautifully landscaped yard. Fresh paint, new roof, new fence, new fixtures, new windows and so many more updates. This home is move-in ready! Your family and loved ones will also enjoy the spacious backyard, which is perfect for family gatherings! Don't contemplate any longer and call your favorite realtor to schedule a showing today!
Key facts
- Exterior insulation
- New stucco
- Newer a/c unit
Tags
Neighborhood map
What this means for you Summary
Snapshot
- This is a 3-bed/1.0-bath single-family listed at $175k.
Deal economics
- At list price, monthly cash flow is $347 ($4k/yr) — positive.
- The deal already cash-flows at list — no discount required.
- Meets the 1% rule at list price ($2k rent vs $175k).
Location & tenants
- Location reads 62/100 on livability (#925 in TX) — a middle-class / working-renter tenant base. Strengths: crime A+, cost of living A+, housing A+; Watch: health & safety C-, schools F, amenities F.
- Kermit ISD (town): math 31% / reading 30% proficiency, ranked #602 of 826 in TX (top 73%) — families likely to look elsewhere, expect single-tenant / working-renter base with shorter leases.
- Market conditions: 19 active listings in the ZIP; 1 comparable units currently listed for rent nearby.
Forward outlook
- In year one you build about $19k of equity ($1k loan paydown + $18k appreciation (10.0% local appreciation)).
- Winkler County population projected at +67% by 2050 — long-run rental-demand tailwind backs the buy-and-hold thesis.
- At projected returns (10.0% appreciation + 3.0% rent growth), your $49k cash investment doubles in ~3 years — after that, you're playing with house money.
- By year 2, paydown + projected appreciation supports a ~$30k cash-out refi (75% LTV) — recoverable capital for the next deal without selling this one.
Negotiation context
- Only 4 days on market — expect competitive offers; lowballing is unlikely to land.
- 4 sale attempts since 6y ago with the ask held roughly flat each time — persistent listings suggest the price (not the market) is what's stuck; bring a comps-based counter.
Risks & watch-outs
- Watch-outs: built in 1953 — expect roof / HVAC / electrical / plumbing capex.
- Climate carrying-cost: major flood risk; severe wildfire risk; extreme-heat days projected 5→16/yr by 2055 (HVAC capex compounding) — expect insurance premiums to compound above CPI over the hold.
Questions for the listing agent
- Built in 1953 — when were the roof, HVAC, electrical panel, plumbing, and water heater last replaced?
- Is there a deadline driving the sale (1031 exchange, divorce, estate, relocation)? That informs how much negotiation room exists.
- Schools are F-rated, which usually means shorter tenancies and higher turnover. Who's the typical renter profile here, and what's been the actual vacancy rate?
- What's the average days-on-market for RENTAL listings here right now (not sales)? A rising rental-DOM trend means longer vacancies and softer asking-rent achievability than the comps imply.
- What's the recent tenant-quality profile in this submarket — average credit score on applications, eviction rate, late-payment / NSF rate, and stable-employment percentage? A property-management company in the area should have these aggregated.
- How much new for-sale + rental construction is in the pipeline within 1–3 miles? Heavy new supply typically softens prices + rents 12–24 months out; constrained supply supports both.
Investment metrics
- 1% rule
- 1.03% ✓
- Cap rate
- 8.67%
- Cash-on-cash
- 8.50%
- DSCR
- 1.38
- GRM
- 8.1
CMA / ARV
No comps found within radius.
Projected returns pro-forma
10.0% appreciation · 3.0% rent growth · sell at horizon
- IRR
- 30.5%
- Equity multiple
- 3.40×
- Total profit
- $117,363
- Equity at exit
- $157,654
- IRR
- 26.4%
- Equity multiple
- 7.70×
- Total profit
- $328,117
- Equity at exit
- $339,987
Cash invested: $49,000 (down + closing). Projections, not guarantees.
Landlord ↔ Tenant lean methodology
- Overall (STATE)
- 87 Strongly Landlord-Friendly
- State Texas
- 87 Strongly Landlord-Friendly · R+5
- County
- — inherits STATE
- City
- — inherits STATE
ZIP-level market 79745
- Home prices YoY
- 4.7%
- Active inventory
- 19
- Price-to-rent
- 8.1×
Monthly cashflow live
- Estimated rent
- $1,800 medium interval (Pro) →
- Mortgage (P&I)
- −$918
- Tax from tax record
- −$84 /mo · $1,011/yr
- Insurance
- −$73
- HOA
- −$0
- Vacancy / Maint / Mgmt
- −$378
- Net cashflow
- $347
Break-even live
UW: 25.0% down · 7.5% · 30yr · 1.5% tax · 5.0% vac · 8.0% maint · 8.0% mgmt
Financing live
Cash to close
- Down payment
- $43,750
- Closing costs
- $5,250
- Reserves months
- —
- Total cash needed
- —
Loan-product check · same deal, 3 products live
Conventional
25% down · 7.5% · 30yr
- Down + closing
- —
- Monthly P&I
- —
- Monthly cashflow
- —
- DSCR
- —
- Eligible?
- —
Personal DTI + credit; lowest rate.
DSCR
20% down · 8.5% · 30yr
- Down + closing
- —
- Monthly P&I
- —
- Monthly cashflow
- —
- DSCR
- —
- Eligible?
- —
No personal income docs; deal must DSCR.
Hard money
10% down · 12.0% · 12mo
- Down + closing
- —
- Monthly P&I
- —
- Monthly cashflow
- —
- DSCR
- —
- Eligible?
- —
Short-term bridge; refi at stabilization.
Rent comps 1 comps
| Address | Beds | Baths | Sqft | Rent | $/sqft | DOM | Units | Dist |
|---|---|---|---|---|---|---|---|---|
| 452 North Avenue B Unit B Kermit, TX | 3.0 | 1.5 | 1220 | $1,800 | $1.48 | 43d | 1 | 1.07mi |
Listing history 5 events
-
2026-06-19days on market $175,000 Active 4 DOM
-
2026-06-18days on market $175,000 Active 3 DOM
-
2026-06-17days on market $175,000 Active 2 DOM
-
2026-06-16remarks 423-char remark
-
2026-06-16$175,000 Active 1 DOM
ⓘ Source: listings_history table (triggers on properties + properties_extension) + one-shot
backfill from property_details.listing_events for pre-trigger history.
Tax reassessment forecast TX · Resets to sale price
- Current annual tax
- $1,011 · $84/mo
- Projected year-2 tax
- $3,202 · $267/mo
- Expected delta
- +$2,192/yr (+$183/mo · 216.8%)
ⓘ Screening estimate from a state-policy table — verify with the county assessor before closing.
Climate risk First Street
- Flood 7/10 Severe 94% chance over 30 yrs
- Wildfire 9/10 Extreme
- Heat 6/10 Major 5 d/yr ≥103°F today · 16 d/yr by 30 yrs out
- Wind 2/10 Low 100% chance of damaging wind over 30 yrs
- Air quality 1/10 Low 0 unhealthy d/yr today · 0 by 30 yrs out
Nearby sold comps map
Loading sold comps map…
Walkable amenities ~0.75 mi
Loading nearby amenities…
Taxation est. · year 1
- Rental income
- $21,600
- − Mortgage interest
- −$9,803
- − Property taxes
- −$1,011
- − Insurance
- −$875
- − Repairs & maintenance
- −$1,728
- − Management
- −$1,728
- − Depreciation
- −$5,091
- Taxable income
- $1,364
- Est. tax owed @ 24.0%
- −$327
- After-tax cash flow
- $3,838/yr
For passive investors: Depreciation is non-cash, so a rental often shows a tax loss while cash-flowing — sheltering income. Rental losses are passive: they offset passive income freely, and up to $25,000/yr can offset ordinary (W-2) income if you actively participate and your MAGI is under $100k (phasing out to $0 by $150k); unused losses carry forward. On sale, claimed depreciation is recaptured at up to 25%, and gains may owe capital-gains tax (a 1031 exchange can defer both). Figures are a year-1 estimate at your 24.0% rate — not tax advice; consult a CPA.
Schools (NCES district)
- District
- Kermit ISD
- NCES district ID
- 4825560
- Math proficiency
- 31% ▲ 12.00%
- Reading proficiency
- 30% ▲ 8.00%
- Median HH income
- $48,332
- Composite
- 26.47/100
- National rank
- #7215
- State rank
- #602 of 826 in TX
Livability — Kermit
- Score
- 62/100
- State rank
- #925
- US rank
- #16453
Category grades
Schools grade is shown separately in the Schools card above.
Census & demographics
- Census place
- Kermit, TX
- Population (ZIP)
- 6,160
Population outlook (Winkler County) Hauer SSP2
- Today (2025)
- 10,019 people
- By 2030
- 11,177 · +11.6%
- By 2040
- 13,746 · +37.2%
- By 2050
- 16,734 · +67.0%
- By 2075
- 24,573 · +145.3%
- By 2100
- 30,264 · +202.1%
Race, ethnicity, and origin ACS 2023
- Neighborhood character
- Predominantly Hispanic (71%)
- Race & ethnicity
- Hispanic / Latino 71% White 23% Two or more races 21% Black 4% Native American 3%
- Hispanic origin (detail)
- Mexican 65% Cuban 2%
- Common ancestry
- Lithuanian 2%
- Foreign-born
- 17% · Canada
- Languages at home
- 45% English-only · Spanish 55%
Political lean MEDSL · Winkler
- 2024 margin
- Solid R (+70.5) · D 14.7% · R 85.2%
- 2008→2024 swing
- -18.8pp toward R · 2008: -51.8pp · 2024: -70.5pp
- All cycles
- 2024: R+70.5 2020: R+65.6 2016: R+52.5 2012: R+53.5 2008: R+51.8
Not yet ingested
- Civics
- —
Market trends
- HPI YoY
- ▲ 10.52%
- Current HPI
- 233.1436
- Rent YoY
- —
- Metro
- —
- State GDP YoY
- ▲ 3.95%
- F500 in state
- 110
Industry mix (Fortune 500 HQ in TX)
| Industry | F500 HQs | Revenue |
|---|---|---|
| Energy | 16 | $1,198B |
|
||
| Technology | 5 | $198B |
|
||
| Engineering / Construction | 4 | $72B |
|
||
| Energy Services | 3 | $60B |
|
||
| Utilities | 3 | $41B |
|
||
| Healthcare | 2 | $330B |
|
||
Price history
+89.2% since first listed9 events — show timeline
- 2026-06-16 Listed $175,000 FSBO.com
- 2022-12-29 Sold (Public Records) — Public Records
- 2022-12-22 Sold (MLS) — ODMLS
- 2022-12-02 Pending — ODMLS
- 2022-11-01 Relisted — ODMLS
- 2022-10-05 Listed $125,000 ODMLS
- 2021-01-13 Sold (Public Records) — Public Records
- 2021-01-11 Sold (MLS) — ODMLS
- 2020-07-25 Listed $92,500 ODMLS
Property tax history
+4.2%/yrLatest (2025): $1,011 · +20.2% YoY. Source: county tax records.
Cash-flow waterfall
monthlySold comps — $/sqft
last 12 mo · ≤1 miLoading sold comps…