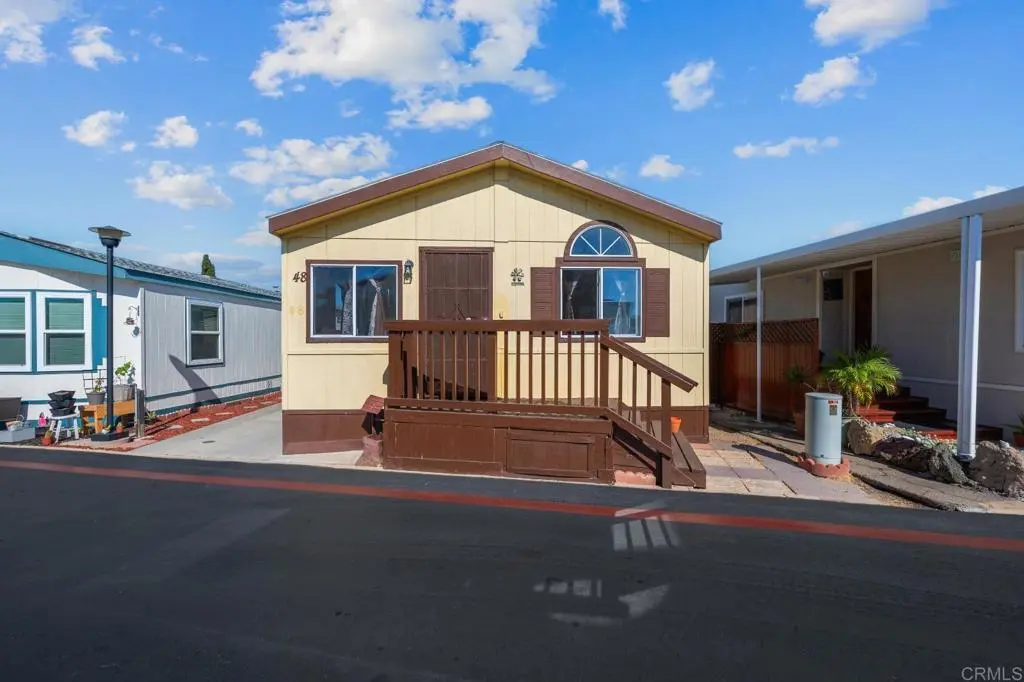
1600 Palm Ave Spc 48 · San Diego, CA
Flood risk 1/10 · Minimal
- FEMA flood zone
- X
- Chance of flooding over 30 yrs
- 0.0%
- Est. flood insurance / yr
- $507 – $1,088
Fire risk 2/10 · Minimal
- Est. fire insurance / yr
- $659 – $1,223
Heat risk 4/10 · Minor
- Hot days now (above 86°F)
- 7 days/yr
- Hot days in 30 yrs
- 19 days/yr
Wind risk 1/10 · Minimal
- Chance of severe wind over 30 yrs
- —
Air-quality risk 1/10 · Minimal
- Unhealthy air days now
- 0 days/yr
- Unhealthy air days in 30 yrs
- 0 days/yr
Risk factors via First Street. Map © Google.
Why this score? — see what drove the B- grade
The composite is a weighted blend of 9 inputs, each scored 0–100. Each bar is that input's sub-score; the figure is the points it added to the 100-point composite (weight × sub-score).
- Cash flow +30.0/30.0
- DSCR +10.0/10.0
- 1% rule +9.5/10.0
- ARV discount +7.5/15.0
- Schools +3.9/10.0
- Livability +3.8/5.0
- Condition / age +2.5/5.0
- Rent growth +2.4/5.0
- Appreciation +0.0/10.0
$199,999
🖨 Deal sheet 📄 Offer letter ✓ Due diligence
Listing remarks
Located in an ALL AGES community, residents enjoy amenities such as a pool and the convenience of additional storage, mobile home located in the desirable 1600 Palm Ave Mobile Home Park. This home features a functional layout with generous living space and includes 2 assigned parking spaces plus an additional extra spot a rare find (total 3 parking spaces) Ideally situated near major freeways (5 & 905) and just approximately 10 minutes from the beach, offering both accessibility and coastal lifestyle. While not remodeled, the home is competitively priced, providing an excellent opportunity to customize and add value. Low space rent makes this a great value.
Key facts
- Major freeways
- Pool
- Functional layout
Tags
Property features AI
Finance
- Other: Lot size recorded from public records (0–1 unit/acre)
- Financial info: Land lease of $1,237 per month
Exterior
- Parking: 2 uncovered parking spaces (2 total)
- Utilities: Public sewer
- Home design: Manufactured/mobile home; One story; Front entry
- Construction: Mobile home dimensions approximately 48 ft by 20 ft; Single-story structure
- Exterior features: Community pool; Curbs in the neighborhood
Interior
- Bedrooms: All bedrooms on the ground level
- Bathrooms: 2 full bathrooms
- Interior features: Front entry; Single-story home
- Laundry & utility: Laundry inside the home
Neighborhood map
What this means for you Summary
Snapshot
- This is a 3-bed/2.0-bath manufactured listed at $200k.
Deal economics
- At list price, monthly cash flow is $916 ($11k/yr) — positive.
- The deal already cash-flows at list — no discount required.
- Meets the 1% rule at list price ($3k rent vs $200k).
- Recommended offer: $188k (6.0% below list) — sets the bar for market timing.
- Cap rate 11.8% vs local median 2.0% in San Diego — top-decile yield for the area; either an underpriced asset or a hidden risk that comps aren't pricing in. Stress-test before assuming the spread holds.
Location & tenants
- Location reads 75/100 on livability (#123 in CA, #4,206 nationally) — a middle-class / working-renter tenant base. Strengths: amenities A+, commute A+, employment A+; Watch: health & safety C-, crime D+, cost of living F.
- Sweetwater Union High (suburban): math 36% / reading 52% proficiency, ranked #187 of 517 in CA (top 36%) — families likely to look elsewhere, expect single-tenant / working-renter base with shorter leases.
- Market conditions: Rents soft (-0.5%/yr); 210 active listings in the ZIP; 40 comparable units currently listed for rent nearby; rentals leasing fast (median 2d on market — plan ~1-2 weeks tenant-placement turnaround); solid renter incomes; 11,759 units permitted in San Diego County in 2024 (7,244 in 5+ unit buildings).
- This rent runs 37% of the median local income ($95k/yr) — at the standard rent-burdened threshold; future hikes will face affordability resistance.
Forward outlook
- Local home prices are declining (-3.0%/yr); year-one equity from $1k of loan paydown is wiped out by about $6k of value loss. Plan a longer hold.
- San Diego County population projected at +20% by 2050 — long-run rental-demand tailwind backs the buy-and-hold thesis.
- At projected returns (-3.0% appreciation + 0.0% rent growth), your $56k cash investment doubles in ~8 years — after that, you're playing with house money.
Negotiation context
- It's been on market 86 days — a 6% lower offer ($188k) is reasonable based on typical stale-listing flexibility.
- 3 sale attempts since 15y ago with the ask held roughly flat each time — persistent listings suggest the price (not the market) is what's stuck; bring a comps-based counter.
Questions for the listing agent
- It's been on market 86 days. Have you received any prior offers? Is the seller open to a 6% concession, seller financing, or rate buy-down credit?
- Why hasn't it sold? Are there any deal-killer items the seller is aware of (foundation, flood, title, zoning, code violations)?
- Is there a deadline driving the sale (1031 exchange, divorce, estate, relocation)? That informs how much negotiation room exists.
- Schools are B-rated — typically a magnet for longer-tenancy family renters. What's the average tenant stay here, and is there a school-zone premium baked into asking?
- Crime grade is D in this area — have there been break-ins, vandalism, or insurance claims at this property in the last 3 years? What carrier currently insures it and at what premium?
- What's the average days-on-market for RENTAL listings here right now (not sales)? A rising rental-DOM trend means longer vacancies and softer asking-rent achievability than the comps imply.
- What's the recent tenant-quality profile in this submarket — average credit score on applications, eviction rate, late-payment / NSF rate, and stable-employment percentage? A property-management company in the area should have these aggregated.
- How much new for-sale + rental construction is in the pipeline within 1–3 miles? Heavy new supply typically softens prices + rents 12–24 months out; constrained supply supports both.
Investment metrics
- 1% rule
- 1.45% ✓
- Cap rate
- 11.79%
- Cash-on-cash
- 19.62%
- DSCR
- 1.87
- GRM
- 5.7
CMA / ARV
No comps found within radius.
Projected returns pro-forma
-3.0% appreciation · 0.0% rent growth · sell at horizon
- IRR
- 8.2%
- Equity multiple
- 1.31×
- Total profit
- $17,432
- Equity at exit
- $29,821
- IRR
- 14.7%
- Equity multiple
- 2.03×
- Total profit
- $57,512
- Equity at exit
- $17,292
Cash invested: $56,000 (down + closing). Projections, not guarantees.
Landlord ↔ Tenant lean methodology
- Overall (STATE)
- 18 Strongly Tenant-Friendly
- State California
- 18 Strongly Tenant-Friendly · D+13
- County
- — inherits STATE
- City
- — inherits STATE
ZIP-level market 92154
- Rents YoY
- -0.5%
- Active inventory
- 210
- Price-to-rent
- 5.7×
Monthly cashflow live
- Estimated rent
- $2,909 high interval (Pro) →
- Mortgage (P&I)
- −$1,049
- Tax est. 1.5%
- −$250 /mo · $3,000/yr
- Insurance
- −$83
- HOA
- −$0
- Vacancy / Maint / Mgmt
- −$611
- Net cashflow
- $916
Break-even live
UW: 25.0% down · 7.5% · 30yr · 1.5% tax · 5.0% vac · 8.0% maint · 8.0% mgmt
Financing live
Cash to close
- Down payment
- $50,000
- Closing costs
- $6,000
- Reserves months
- —
- Total cash needed
- —
Loan-product check · same deal, 3 products live
Conventional
25% down · 7.5% · 30yr
- Down + closing
- —
- Monthly P&I
- —
- Monthly cashflow
- —
- DSCR
- —
- Eligible?
- —
Personal DTI + credit; lowest rate.
DSCR
20% down · 8.5% · 30yr
- Down + closing
- —
- Monthly P&I
- —
- Monthly cashflow
- —
- DSCR
- —
- Eligible?
- —
No personal income docs; deal must DSCR.
Hard money
10% down · 12.0% · 12mo
- Down + closing
- —
- Monthly P&I
- —
- Monthly cashflow
- —
- DSCR
- —
- Eligible?
- —
Short-term bridge; refi at stabilization.
Rent comps 40 comps
| Address | Beds | Baths | Sqft | Rent | $/sqft | DOM | Units | Dist |
|---|---|---|---|---|---|---|---|---|
| 736 18th St San Diego, CA | 2.0 | 1.0 | 880 | $3,400 | $3.86 | 19d | 1 | 0.31mi |
| 933 15th St San Diego, CA | 3.0 | 2.0 | 1050 | $3,350 | $3.19 | 1d | 1 | 0.37mi |
| 924 Georgia St Imperial Beach, CA | 3.0 | 2.0 | 1083 | $3,295 | $3.04 | 1d | 1 | 0.44mi |
| 1910 Avenida del Mexico #205 San Diego, CA | 2.0 | 2.0 | 885 | $2,595 | $2.93 | 1d | 1 | 0.46mi |
| 1042 15th St Unit Del Coronado Villas San Diego, CA | 2.0 | 1.0 | 1000 | $2,300 | $2.30 | 1d | 1 | 0.50mi |
| 1042 15th St San Diego, CA | 1.0–2.0 | 1.0 | 850 | $2,300 | $2.71 | 4d | 2 | 0.51mi |
| 966 13th St Imperial Beach, CA | 2.0 | 1.0 | 900 | $2,850 | $3.17 | 17d | 1 | 0.51mi |
| 812 12th St Imperial Beach, CA | 2.0 | 2.0 | 816 | $2,770 | $3.39 | 1d | 2 | 0.55mi |
| 1184 Elm Ave Unit 1186 Imperial Beach, CA | 2.0 | 1.0 | 780 | $2,300 | $2.95 | 22d | 1 | 0.57mi |
| 1055 Georgia St Imperial Beach, CA | 2.0 | 1.0 | 770 | $2,150 | $2.79 | 10d | 4 | 0.58mi |
| 2055 Avenida Del Mexico Apt 208 San Diego, CA | 2.0 | 2.0 | 960 | $2,300 | $2.40 | 16d | 1 | 0.59mi |
| 1070 Georgia St Unit D Imperial Beach, CA | 2.0 | 2.0 | 850 | $2,600 | $3.06 | 1d | 1 | 0.61mi |
| 1063 18th St San Diego, CA | 2.0 | 1.0 | 1050 | $3,100 | $2.95 | 1d | 1 | 0.62mi |
| 931 Florida St Unit 931 Imperial Beach, CA | 2.0 | 1.0 | 650 | $2,300 | $3.54 | 1d | 1 | 0.63mi |
| 931 Florida St Unit 933 Imperial Beach, CA | 2.0 | 1.0 | 650 | $2,300 | $3.54 | 10d | 1 | 0.63mi |
| 560 11th St Unit 1 Imperial Beach, CA | 2.0 | 2.0 | 1089 | $3,395 | $3.12 | 1d | 1 | 0.65mi |
| 1031 12th St Imperial Beach, CA | 2.0 | 1.0 | 850 | $3,500 | $4.12 | 2d | 1 | 0.66mi |
| 1086 Florence St Unit L Imperial Beach, CA | 2.0 | 1.0 | 800 | $2,095 | $2.62 | 1d | 1 | 0.71mi |
| 1150 13th St Unit 202 Imperial Beach, CA | 2.0 | 1.5 | 1000 | $2,300 | $2.30 | 1d | 1 | 0.75mi |
| 566 Emory St Unit 566 Imperial Beach, CA | 2.0 | 1.0 | 800 | $2,475 | $3.09 | 1d | 1 | 0.79mi |
| 615 9th St Imperial Beach, CA | 2.0 | 1.0 | 837 | $3,574 | $4.27 | 1d | 1 | 0.80mi |
| 935 Elm Ave Imperial Beach, CA | 3.0 | 1.0 | 1100 | $3,000 | $2.73 | 1d | 1 | 0.80mi |
| 1122 11th St Imperial Beach, CA | 2.0 | 2.0 | 970 | $2,295 | $2.37 | 1d | 1 | 0.86mi |
| 1122 11th St Unit 1126 Imperial Beach, CA | 2.0 | 2.0 | 970 | $2,295 | $2.37 | 16d | 1 | 0.86mi |
| 1471 Grove Ave Imperial Beach, CA | 2.0 | 2.0 | 850 | $2,675 | $3.15 | 1d | 5 | 0.87mi |
| 557 8th St Imperial Beach, CA | 2.0 | 1.0 | 1080 | $3,125 | $2.89 | 14d | 1 | 0.89mi |
| 1174 11th St Imperial Beach, CA | 2.0 | 1.5 | 1000 | $2,495 | $2.50 | 1d | 1 | 0.90mi |
| 768 Hollister St San Diego, CA | 2.0 | 2.0 | 840 | $2,300 | $2.74 | 1d | 1 | 0.91mi |
| 1422 Holly Ave Imperial Beach, CA | 2.0 | 1.0 | 800 | $2,400 | $3.00 | 1d | 1 | 0.92mi |
| 789 Calla Ave Imperial Beach, CA | 2.0 | 1.0 | 820 | $2,400 | $2.93 | 24d | 1 | 0.92mi |
| 789 Calla Ave Apt E Imperial Beach, CA | 2.0 | 1.0 | 820 | $2,395 | $2.92 | 17d | 1 | 0.92mi |
| 789 Calla Ave Imperial Beach, CA | 2.0 | 1.0 | 820 | $2,295 | $2.80 | 10d | 1 | 0.92mi |
| 772 8th St Unit 2 Imperial Beach, CA | 2.0 | 2.0 | 750 | $3,200 | $4.27 | 1d | 1 | 0.93mi |
| 838 Elm Ave Imperial Beach, CA | 3.0 | 1.0 | 880 | $3,495 | $3.97 | 20d | 1 | 0.94mi |
| 1411 Holly Ave Unit 1413 Holly Imperial Beach, CA | 2.0 | 1.0 | 900 | $2,500 | $2.78 | 20d | 1 | 0.97mi |
| 1187 Grove Ave Apt E Imperial Beach, CA | 2.0 | 1.0 | 850 | $2,350 | $2.76 | 1d | 1 | 0.99mi |
| 1187 Grove Ave Unit F/G Imperial Beach, CA | 2.0 | 1.0 | 850 | $2,350 | $2.76 | 2d | 1 | 0.99mi |
| 532 Delaware St Imperial Beach, CA | 2.0 | 1.0 | 900 | $3,100 | $3.44 | 1d | 1 | 1.00mi |
| 1441 13th St Imperial Beach, CA | 2.0 | 1.0 | 748 | $2,245 | $3.00 | 1d | 1 | 1.03mi |
| 595 7th St Unit C Imperial Beach, CA | 2.0 | 1.5 | 900 | $2,895 | $3.22 | 1d | 1 | 1.04mi |
Listing history 19 events
-
2026-06-18days on market $199,999 Active 86 DOM
-
2026-06-17days on market $199,999 Active 85 DOM
-
2026-06-16days on market $199,999 Active 84 DOM
-
2026-06-15days on market $199,999 Active 83 DOM
-
2026-06-13days on market $199,999 Active 81 DOM
-
2026-06-13days on market $199,999 Active 80 DOM
-
2026-06-09days on market $199,999 Active 77 DOM
-
2026-06-08days on market $199,999 Active 76 DOM
-
2026-06-07days on market $199,999 Active 75 DOM
-
2026-06-04days on market $199,999 Active 72 DOM
-
2026-06-03days on market $199,999 Active 71 DOM
-
2026-06-02days on market $199,999 Active 70 DOM
-
2026-06-01days on market $199,999 Active 69 DOM
-
2026-05-31days on market $199,999 Active 68 DOM
-
2026-03-19$199,999 Active
-
2011-09-28historical
-
2011-09-28historical
-
2011-08-31$52,900 Active
-
2011-08-31$52,900
ⓘ Source: listings_history table (triggers on properties + properties_extension) + one-shot
backfill from property_details.listing_events for pre-trigger history.
Climate risk First Street
- Flood 1/10 Low FEMA zone X · 0% chance over 30 yrs
- Wildfire 2/10 Low
- Heat 4/10 Moderate 7 d/yr ≥86°F today · 19 d/yr by 30 yrs out
- Wind 1/10 Low
- Air quality 1/10 Low 0 unhealthy d/yr today · 0 by 30 yrs out
Nearby sold comps map
Loading sold comps map…
Walkable amenities ~0.75 mi
Loading nearby amenities…
Taxation est. · year 1
- Rental income
- $34,904
- − Mortgage interest
- −$11,203
- − Property taxes
- −$3,000
- − Insurance
- −$1,000
- − Repairs & maintenance
- −$2,792
- − Management
- −$2,792
- − Depreciation
- −$5,818
- Taxable income
- $8,298
- Est. tax owed @ 24.0%
- −$1,992
- After-tax cash flow
- $8,997/yr
For passive investors: Depreciation is non-cash, so a rental often shows a tax loss while cash-flowing — sheltering income. Rental losses are passive: they offset passive income freely, and up to $25,000/yr can offset ordinary (W-2) income if you actively participate and your MAGI is under $100k (phasing out to $0 by $150k); unused losses carry forward. On sale, claimed depreciation is recaptured at up to 25%, and gains may owe capital-gains tax (a 1031 exchange can defer both). Figures are a year-1 estimate at your 24.0% rate — not tax advice; consult a CPA.
Schools (NCES district)
- District
- Sweetwater Union High
- NCES district ID
- 0638640
- Math proficiency
- 36% ▲ 3.00%
- Reading proficiency
- 52% ▼ -2.00%
- Median HH income
- $59,051
- Composite
- 38.61/100
- National rank
- #4158
- State rank
- #187 of 517 in CA
Livability — San Diego
- Score
- 75/100
- State rank
- #123
- US rank
- #4206
Category grades
Schools grade is shown separately in the Schools card above.
Census & demographics
- Census place
- San Diego, CA
- County
- San Diego County · 3,178,799 people
- City population
- 1,397,612
- Metro
- San Diego-Chula Vista-Carlsbad, CA
- Population (ZIP)
- 80,445
- Household income
- $94,901
- Rent vs Own
- Severe rent burden
- 2959.0
Population outlook (San Diego County) Hauer SSP2
- Today (2025)
- 3,678,185 people
- By 2030
- 3,856,546 · +4.8%
- By 2040
- 4,171,407 · +13.4%
- By 2050
- 4,421,607 · +20.2%
- By 2075
- 4,831,599 · +31.4%
- By 2100
- 4,832,502 · +31.4%
Race, ethnicity, and origin ACS 2023
- Neighborhood character
- Predominantly Hispanic (68%)
- Race & ethnicity
- Hispanic / Latino 68% Two or more races 30% White 12% Asian 12% Black 5% Native American 1%
- Hispanic origin (detail)
- Mexican 65%
- Foreign-born
- 32% · Canada, China
- Languages at home
- 35% English-only · Spanish 56% Tagalog/Filipino 7% Chinese 1%
Political lean MEDSL · San Diego
- 2024 margin
- D (+16.8) · D 56.9% · R 40.1% · Other 2.9%
- 2008→2024 swing
- +6.6pp toward D · 2008: 10.2pp · 2024: 16.8pp
- All cycles
- 2024: D+16.8 2020: D+22.8 2016: D+17.8 2012: D+5.1 2008: D+10.2
Not yet ingested
- Civics
- —
Market trends
- HPI YoY
- ▼ -568.62%
- Current HPI
- 393.1836
- Rent YoY
- ▼ -0.52%
- Metro
- San Diego-Chula Vista-Carlsbad, CA
- State GDP YoY
- ▲ 3.21%
- F500 in state
- 116
Industry mix (Fortune 500 HQ in CA)
| Industry | F500 HQs | Revenue |
|---|---|---|
| Technology | 27 | $1,492B |
|
||
| Financial Services | 3 | $174B |
|
||
| Retail | 3 | $44B |
|
||
| Insurance | 3 | $26B |
|
||
| Media / Entertainment | 2 | $115B |
|
||
| Pharmaceuticals / Biotech | 2 | $62B |
|
||
Price history
+278.1% since first listed5 events — show timeline
- 2026-03-19 Listed $199,999 CRMLS
- 2011-09-28 Listing Removed — SDMLS
- 2011-09-28 Listing Removed — CRMLS
- 2011-08-31 Listed $52,900 SDMLS
- 2011-08-31 Listed $52,900 CRMLS
Cash-flow waterfall
monthlySold comps — $/sqft
last 12 mo · ≤1 miLoading sold comps…