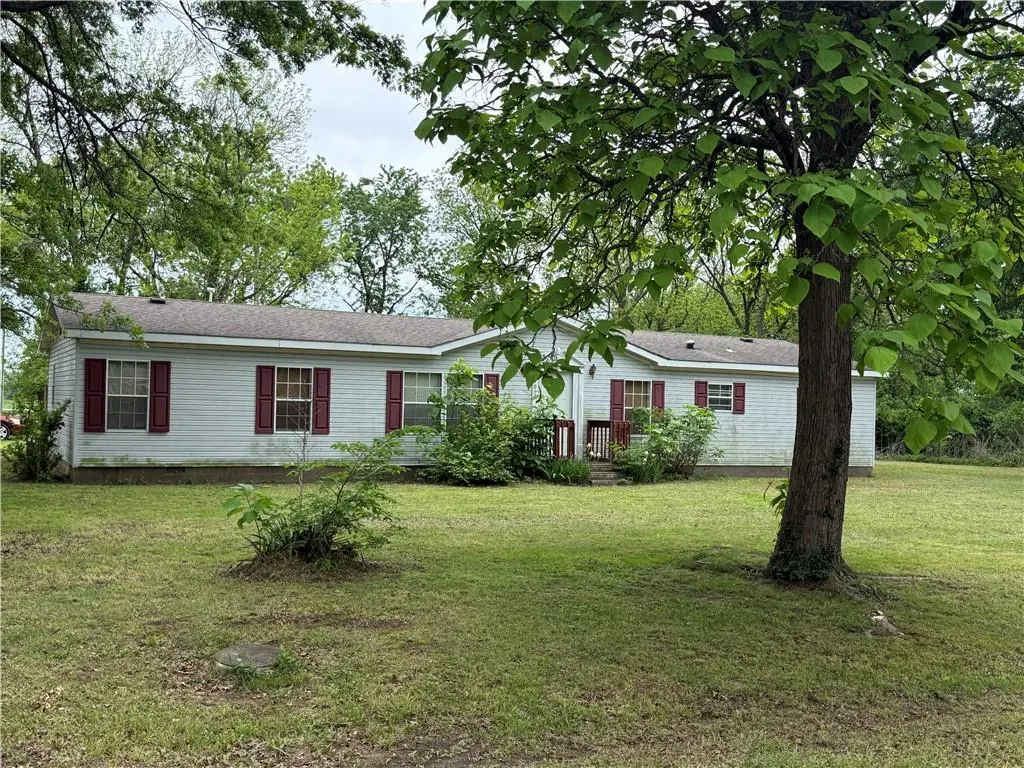
401 W Larch St · Cherokee, KS
Flood risk 1/10 · Minimal
- FEMA flood zone
- X (unshaded)
- Chance of flooding over 30 yrs
- 0.0%
- Est. flood insurance / yr
- $507 – $1,088
Fire risk 3/10 · Minor
- Est. fire insurance / yr
- $1,154 – $2,142
Heat risk 5/10 · Moderate
- Hot days now (above 108°F)
- 7 days/yr
- Hot days in 30 yrs
- 20 days/yr
Wind risk 2/10 · Minimal
- Chance of severe wind over 30 yrs
- 2.0%
Air-quality risk 2/10 · Minimal
- Unhealthy air days now
- 1 days/yr
- Unhealthy air days in 30 yrs
- 1 days/yr
Risk factors via First Street. Map © Google.
Why this score? — see what drove the B+ grade
The composite is a weighted blend of 9 inputs, each scored 0–100. Each bar is that input's sub-score; the figure is the points it added to the 100-point composite (weight × sub-score).
- Cash flow +30.0/30.0
- 1% rule +10.0/10.0
- DSCR +10.0/10.0
- Appreciation +8.0/10.0
- ARV discount +7.5/15.0
- Livability +3.1/5.0
- Rent growth +2.5/5.0
- Condition / age +2.5/5.0
- Schools +2.3/10.0
$72,000
🖨 Deal sheet 📄 Offer letter ✓ Due diligence
Key facts
- Large corner lot
- Bonus room
- Large kitchen
Tags
Property features AI
Finance
- Other: Living area reported as 1,716 (source: public records); Age estimated 21-30 years
- HOA & community: No association fees
Exterior
- Parking: Off-street parking; Other parking
- Utilities: Public water; Public sewer
- Home design: Single-family residence; Ranch floor plan; Manufactured home (manufactured type listed)
- Construction: Composition roof; Other construction materials
- Exterior features: Lot approximately 28,000 square feet; Not in a flood plain
Interior
- Kitchen: Spacious kitchen (main level)
- Bedrooms: 4 bedrooms (all on the main level); Bonus room on the main level
- Bathrooms: 2 full bathrooms
- Heating & cooling: Natural gas heating; Electric cooling
- Interior features: Eat-in kitchen; Crawl space basement
- Laundry & utility: Main level laundry
Neighborhood map
What this means for you Summary
Snapshot
- This is a 4-bed/2.0-bath manufactured listed at $72k.
Deal economics
- At list price, monthly cash flow is $500 ($6k/yr) — positive.
- The deal already cash-flows at list — no discount required.
- Meets the 1% rule at list price ($1k rent vs $72k).
- Recommended offer: $71k (1.5% below list) — sets the bar for market timing.
Location & tenants
- Location reads 62/100 on livability (#377 in KS) — a middle-class / working-renter tenant base. Strengths: cost of living A+, health & safety A+, housing B; Watch: employment D, schools F, crime F.
- Cherokee (rural): math 23% / reading 32% proficiency, ranked #127 of 169 in KS (top 75%) — low school quality limits family demand, transient renter base, plan for 1-2y turnover.
- Market conditions: 5 active listings in the ZIP; 65 units permitted in Crawford County in 2024 (0 in 5+ unit buildings).
Forward outlook
- In year one you build about $5k of equity ($498 loan paydown + $4k appreciation (6.0% local appreciation)).
- At projected returns (6.0% appreciation + 3.0% rent growth), your $20k cash investment doubles in ~2 years — after that, you're playing with house money.
- By year 7, paydown + projected appreciation supports a ~$31k cash-out refi (75% LTV) — recoverable capital for the next deal without selling this one.
Negotiation context
- It's been on market 16 days — a 2% lower offer ($71k) is reasonable based on typical stale-listing flexibility.
Risks & watch-outs
- Climate carrying-cost: extreme-heat days projected 7→20/yr by 2055 (HVAC capex compounding) — expect insurance premiums to compound above CPI over the hold.
Questions for the listing agent
- Is there a deadline driving the sale (1031 exchange, divorce, estate, relocation)? That informs how much negotiation room exists.
- Schools are F-rated, which usually means shorter tenancies and higher turnover. Who's the typical renter profile here, and what's been the actual vacancy rate?
- Crime grade is F in this area — have there been break-ins, vandalism, or insurance claims at this property in the last 3 years? What carrier currently insures it and at what premium?
- What's the average days-on-market for RENTAL listings here right now (not sales)? A rising rental-DOM trend means longer vacancies and softer asking-rent achievability than the comps imply.
- What's the recent tenant-quality profile in this submarket — average credit score on applications, eviction rate, late-payment / NSF rate, and stable-employment percentage? A property-management company in the area should have these aggregated.
- How much new for-sale + rental construction is in the pipeline within 1–3 miles? Heavy new supply typically softens prices + rents 12–24 months out; constrained supply supports both.
Investment metrics
- 1% rule
- 1.72% ✓
- Cap rate
- 14.62%
- Cash-on-cash
- 29.75%
- DSCR
- 2.32
- GRM
- 4.9
CMA / ARV
No comps found within radius.
Projected returns pro-forma
5.95% appreciation · 3.0% rent growth · sell at horizon
- IRR
- 40.5%
- Equity multiple
- 3.60×
- Total profit
- $52,391
- Equity at exit
- $45,012
- IRR
- 37.8%
- Equity multiple
- 7.41×
- Total profit
- $129,254
- Equity at exit
- $81,412
Cash invested: $20,160 (down + closing). Projections, not guarantees.
Landlord ↔ Tenant lean methodology
- Overall (STATE)
- 83 Strongly Landlord-Friendly
- State Kansas
- 83 Strongly Landlord-Friendly · R+10
- County
- — inherits STATE
- City
- — inherits STATE
ZIP-level market 66724
- Home prices YoY
- 3.7%
- Active inventory
- 5
- Price-to-rent
- 4.9×
Monthly cashflow live
- Estimated rent
- $1,237 medium interval (Pro) →
- Mortgage (P&I)
- −$378
- Tax from tax record
- −$70 /mo · $838/yr
- Insurance
- −$30
- HOA
- −$0
- Vacancy / Maint / Mgmt
- −$260
- Net cashflow
- $500
Break-even live
UW: 25.0% down · 7.5% · 30yr · 1.5% tax · 5.0% vac · 8.0% maint · 8.0% mgmt
Financing live
Cash to close
- Down payment
- $18,000
- Closing costs
- $2,160
- Reserves months
- —
- Total cash needed
- —
Loan-product check · same deal, 3 products live
Conventional
25% down · 7.5% · 30yr
- Down + closing
- —
- Monthly P&I
- —
- Monthly cashflow
- —
- DSCR
- —
- Eligible?
- —
Personal DTI + credit; lowest rate.
DSCR
20% down · 8.5% · 30yr
- Down + closing
- —
- Monthly P&I
- —
- Monthly cashflow
- —
- DSCR
- —
- Eligible?
- —
No personal income docs; deal must DSCR.
Hard money
10% down · 12.0% · 12mo
- Down + closing
- —
- Monthly P&I
- —
- Monthly cashflow
- —
- DSCR
- —
- Eligible?
- —
Short-term bridge; refi at stabilization.
Listing history 2 events
-
2026-05-11status Pending
-
2026-04-25$72,000 Active
ⓘ Source: listings_history table (triggers on properties + properties_extension) + one-shot
backfill from property_details.listing_events for pre-trigger history.
Tax reassessment forecast KS · Resets to sale price
- Current annual tax
- $838 · $70/mo
- Projected year-2 tax
- $1,015 · $85/mo
- Expected delta
- +$177/yr (+$15/mo · 21.2%)
ⓘ Screening estimate from a state-policy table — verify with the county assessor before closing.
Climate risk First Street
- Flood 1/10 Low FEMA zone X (unshaded) · 0% chance over 30 yrs
- Wildfire 3/10 Moderate
- Heat 5/10 Major 7 d/yr ≥108°F today · 20 d/yr by 30 yrs out
- Wind 2/10 Low 2% chance of damaging wind over 30 yrs
- Air quality 2/10 Low 1 unhealthy d/yr today · 1 by 30 yrs out
Nearby sold comps map
Loading sold comps map…
Walkable amenities ~0.75 mi
Loading nearby amenities…
Taxation est. · year 1
- Rental income
- $14,843
- − Mortgage interest
- −$4,033
- − Property taxes
- −$838
- − Insurance
- −$360
- − Repairs & maintenance
- −$1,187
- − Management
- −$1,187
- − Depreciation
- −$2,095
- Taxable income
- $5,143
- Est. tax owed @ 24.0%
- −$1,234
- After-tax cash flow
- $4,763/yr
For passive investors: Depreciation is non-cash, so a rental often shows a tax loss while cash-flowing — sheltering income. Rental losses are passive: they offset passive income freely, and up to $25,000/yr can offset ordinary (W-2) income if you actively participate and your MAGI is under $100k (phasing out to $0 by $150k); unused losses carry forward. On sale, claimed depreciation is recaptured at up to 25%, and gains may owe capital-gains tax (a 1031 exchange can defer both). Figures are a year-1 estimate at your 24.0% rate — not tax advice; consult a CPA.
Schools (NCES district)
- District
- Cherokee
- NCES district ID
- 2004710
- Math proficiency
- 23% ▼ -3.00%
- Reading proficiency
- 32% ▼ -5.00%
- Median HH income
- $39,749
- Composite
- 23.12/100
- National rank
- #7956
- State rank
- #127 of 169 in KS
Livability — Cherokee
- Score
- 62/100
- State rank
- #377
- US rank
- #16906
Category grades
Schools grade is shown separately in the Schools card above.
Census & demographics
- Census place
- Cherokee, KS
- Population (ZIP)
- 986
Population outlook (Crawford County) Hauer SSP2
- Today (2025)
- 39,393 people
- By 2030
- 39,540 · +0.4%
- By 2040
- 39,452 · +0.1%
- By 2050
- 39,188 · -0.5%
- By 2075
- 39,038 · -0.9%
- By 2100
- 38,219 · -3.0%
Race, ethnicity, and origin ACS 2023
- Neighborhood character
- Predominantly White (94%)
- Race & ethnicity
- White 94% Two or more races 6%
- Common ancestry
- Lithuanian 7% Slovak 4% Hungarian 1%
Political lean MEDSL · Crawford
- 2024 margin
- Strong R (+25.3) · D 36.5% · R 61.7% · Other 1.8%
- 2008→2024 swing
- -26.7pp toward R · 2008: 1.4pp · 2024: -25.3pp
- All cycles
- 2024: R+25.3 2020: R+23.1 2016: R+23.1 2012: R+6.5 2008: D+1.4
Not yet ingested
- Civics
- —
Market trends
- HPI YoY
- ▲ 5.95%
- Current HPI
- 167.0376
- Rent YoY
- —
- Metro
- —
- State GDP YoY
- —
- F500 in state
- 0
Price history
2 events — show timeline
- 2026-05-11 Pending — Heartland MLS as Distributed by MLS Grid
- 2026-04-25 Listed $72,000 Heartland MLS as Distributed by MLS Grid
Property tax history
+1.5%/yrLatest (2025): $838 · +4.7% YoY. Source: county tax records.
Cash-flow waterfall
monthlySold comps — $/sqft
last 12 mo · ≤1 miLoading sold comps…