 Fourplex
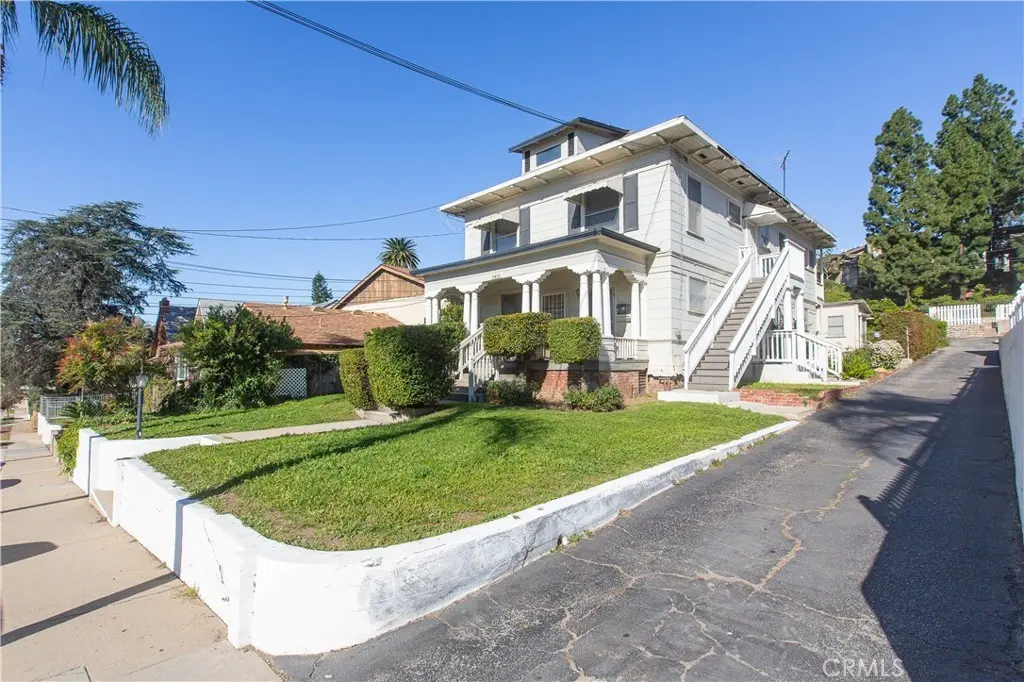
13453 Bailey · Whittier, CA
Flood risk 1/10 · Minimal
- FEMA flood zone
- X (unshaded)
- Chance of flooding over 30 yrs
- 0.0%
- Est. flood insurance / yr
- $507 – $1,088
Fire risk 5/10 · Moderate
- Est. fire insurance / yr
- $659 – $1,223
Heat risk 6/10 · Moderate
- Hot days now (above 95°F)
- 6 days/yr
- Hot days in 30 yrs
- 17 days/yr
Wind risk 1/10 · Minimal
- Chance of severe wind over 30 yrs
- —
Air-quality risk 6/10 · Moderate
- Unhealthy air days now
- 9 days/yr
- Unhealthy air days in 30 yrs
- 10 days/yr
Risk factors via First Street. Map © Google.
Why this score? — see what drove the C- grade
The composite is a weighted blend of 9 inputs, each scored 0–100. Each bar is that input's sub-score; the figure is the points it added to the 100-point composite (weight × sub-score).
- Cash flow +24.6/30.0
- DSCR +8.0/10.0
- 1% rule +5.0/10.0
- Schools +4.7/10.0
- Rent growth +3.3/5.0
- Livability +2.6/5.0
- Condition / age +2.5/5.0
- ARV discount +0.0/15.0
- Appreciation +0.0/10.0
$1,299,000
🖨 Deal sheet 📄 Offer letter ✓ Due diligence
Multi-family units
County records classify this as Multi-Family (2-4 Unit). Listing-text estimate: 4 units. confirmed
Listing remarks
Note the property's huge lot size approx 10,128, and located in the heart of Whittier, this QUADRUPLEX features a perfect blend of comfort and convenience. two of the units have been updated and are currently V A C A N T! Featuring an updated suite, a large lot with a private backyard, and plenty of parking, this property stands out for both living and entertaining. Ideally located right behind Whittier College, you’re just a short walk to Uptown Whittier’s dining, shops, and local favorites, with parks nearby and a quick drive to The Groves. A rare opportunity to own a property that offers space, location, and lifestyle all in one.
Key facts
- Updated suite
- Private backyard
- Large lot
Tags
Property features AI
Finance
- Other: Total building area reported as 2,614 (unit area breakdowns noted in source)
- Financial info: Total actual rent reported at $2,620
- HOA & community: Community features include curbs, sidewalks, and suburban setting
Exterior
- Parking: Total of 8 parking spaces; Driveway; Garage spaces: 8 (some units have 1 garage space each)
- Utilities: Private water source; Public sewer; Natural gas connected; Electricity connected; Telephone on property; 1 separate water meter; 4 separate gas meters; 4 separate electric meters
- Home design: Multi-unit property with 4 total units; 2 total stories; No ADU
- Construction: Composition roof; One building on the parcel; Year built reported from assessor
- Exterior features: No pool; Has view; Front yard; Gentle slope; Rectangular lot shape; Lot size reported as 10,000–19,999 sqft
Interior
- Kitchen: Water heater unit (appliance listed)
- Bedrooms: Unit mix includes 1-bed and 2-bed units (multiple units across property)
- Flooring: Carpet; Laminate
- Bathrooms: Multiple units with 1 full bathroom each
- Heating & cooling: Natural gas heating
- Interior features: Entry level is 1; Entry located on level 1
- Laundry & utility: Laundry area on-site
Neighborhood map
What this means for you Summary
Snapshot
- This is a 4 × 6-bed/4.0-bath units multifamily listed at $1.30M.
Deal economics
- At list price, monthly cash flow is $3k ($32k/yr) — positive. Per door: $673/mo.
- The deal already cash-flows at list — no discount required.
- Meets the 1% rule at list price ($13k rent vs $1.30M).
- Recommended offer: $1.22M (6.0% below list) — sets the bar for market timing.
- Cap rate 8.8% vs local median 1.9% in Whittier — top-decile yield for the area; either an underpriced asset or a hidden risk that comps aren't pricing in. Stress-test before assuming the spread holds.
Location & tenants
- Location reads 52/100 on livability (#1,026 in CA) — a working-class tenant base; expect higher turnover. Strengths: employment A+; Watch: schools C-, crime F, amenities F.
- Whittier Union High (suburban): math 42% / reading 65% proficiency, ranked #111 of 517 in CA (top 22%) — acceptable for families but not a draw, mixed tenant base, ~2y average lease.
- Market conditions: Rents rising (+3.4%/yr); 77 active listings in the ZIP; 6 comparable units currently listed for rent nearby; rentals leasing fast (median 1d on market — plan ~1-2 weeks tenant-placement turnaround); solid renter incomes; 19,697 units permitted in Los Angeles County in 2024 (9,426 in 5+ unit buildings).
- At $13,012/mo this rent would consume 150% of the median local household income ($104k/yr) (locally 1104% of renters already pay >50% of income on rent) — very limited rent-growth headroom before tenants either downsize or default.
Forward outlook
- Local home prices are declining (-3.0%/yr); year-one equity from $9k of loan paydown is wiped out by about $39k of value loss. Plan a longer hold.
- Los Angeles County population projected at +9% by 2050 — modest demand growth; plan on rents tracking national, not racing it.
Negotiation context
- It's been on market 63 days — a 6% lower offer ($1.22M) is reasonable based on typical stale-listing flexibility.
- Current owner paid $200k; list at $1.30M implies a 550% gain — meaningful room to come down on a strong offer.
Risks & watch-outs
- Watch-outs: built in 1903 — expect roof / HVAC / electrical / plumbing capex.
- Climate carrying-cost: moderate wildfire risk; extreme-heat days projected 6→17/yr by 2055 (HVAC capex compounding) — expect insurance premiums to compound above CPI over the hold.
Questions for the listing agent
- It's been on market 63 days. Have you received any prior offers? Is the seller open to a 6% concession, seller financing, or rate buy-down credit?
- Can we see the unit-by-unit rent roll, current vacancy, and any below-market leases? What's the average tenancy length?
- What capital expenditures (roof, boiler, parking lot, exteriors) have been made in the last 5 years, and what's planned in the next 2?
- Built in 1903 — when were the roof, HVAC, electrical panel, plumbing, and water heater last replaced?
- Why hasn't it sold? Are there any deal-killer items the seller is aware of (foundation, flood, title, zoning, code violations)?
- Is there a deadline driving the sale (1031 exchange, divorce, estate, relocation)? That informs how much negotiation room exists.
- Crime grade is F in this area — have there been break-ins, vandalism, or insurance claims at this property in the last 3 years? What carrier currently insures it and at what premium?
- What's the average days-on-market for RENTAL listings here right now (not sales)? A rising rental-DOM trend means longer vacancies and softer asking-rent achievability than the comps imply.
- What's the recent tenant-quality profile in this submarket — average credit score on applications, eviction rate, late-payment / NSF rate, and stable-employment percentage? A property-management company in the area should have these aggregated.
- How much new apartment / multifamily construction is in the pipeline within 1–3 miles? Heavy new supply (>2% of stock underway) typically softens rents 12–24 months out; light construction supports rent growth.
Investment metrics
- 1% rule
- 1.00% ✓
- Cap rate
- 8.78%
- Cash-on-cash
- 8.89%
- DSCR
- 1.40
- GRM
- 8.3
CMA / ARV
- ARV (on-the-fly)
- $1,076,968
- Comps found
- 3
Show comp detail 3 sales within ~0.75 mi
| Address | Dist | Beds/Ba | Sqft | Sold | Price | $/sf | Match |
|---|---|---|---|---|---|---|---|
| 6728 Friends Ave | 0.18mi | 5/4.0 | 2,616 (+0%) | 16mo | $1,200,000 | $459 | 79 |
| 13751 Penn St | 0.42mi | 4/3.0 (-1) | 2,284 (-13%) | 6mo | $940,000 | $412 | 45 |
| 6538 Pickering Ave | 0.62mi | 6/3.0 (+1) | 2,389 (-9%) | 13mo | $740,000 | $310 | 36 |
Match score weights: distance 35% · size 25% · config 20% · recency 20%. Top-matched comps best support the ARV.
Projected returns pro-forma
-3.0% appreciation · 3.39% rent growth · sell at horizon
- IRR
- -2.5%
- Equity multiple
- 0.91×
- Total profit
- $-34,486
- Equity at exit
- $193,685
- IRR
- 7.5%
- Equity multiple
- 1.58×
- Total profit
- $209,381
- Equity at exit
- $112,314
Cash invested: $363,720 (down + closing). Projections, not guarantees.
Landlord ↔ Tenant lean methodology
- Overall (STATE)
- 18 Strongly Tenant-Friendly
- State California
- 18 Strongly Tenant-Friendly · D+13
- County
- — inherits STATE
- City
- — inherits STATE
ZIP-level market 90601
- Rents YoY
- 3.4%
- Active inventory
- 77
- Price-to-rent
- 33.3×
Monthly cashflow live
- Estimated rent
- $13,012 medium interval (Pro) →
- Mortgage (P&I)
- −$6,812
- Tax from tax record
- −$233 /mo · $2,793/yr
- Insurance
- −$541
- HOA
- −$0
- Vacancy / Maint / Mgmt
- −$2,733
- Net cashflow
- $2,693
Break-even live
4-unit breakdown (identical units grouped — click to expand)
| Units | Beds | Baths | Est. rent |
|---|---|---|---|
| 4× units | 6 | 4 | $13,012 |
| #1 | 6 | 4 | $3,253 |
| #2 | 6 | 4 | $3,253 |
| #3 | 6 | 4 | $3,253 |
| #4 | 6 | 4 | $3,253 |
| Total (4 units) | $13,012 | ||
UW: 25.0% down · 7.5% · 30yr · 1.5% tax · 5.0% vac · 8.0% maint · 8.0% mgmt
Financing live
Cash to close
- Down payment
- $324,750
- Closing costs
- $38,970
- Reserves months
- —
- Total cash needed
- —
Loan-product check · same deal, 3 products live
Conventional
25% down · 7.5% · 30yr
- Down + closing
- —
- Monthly P&I
- —
- Monthly cashflow
- —
- DSCR
- —
- Eligible?
- —
Personal DTI + credit; lowest rate.
DSCR
20% down · 8.5% · 30yr
- Down + closing
- —
- Monthly P&I
- —
- Monthly cashflow
- —
- DSCR
- —
- Eligible?
- —
No personal income docs; deal must DSCR.
Hard money
10% down · 12.0% · 12mo
- Down + closing
- —
- Monthly P&I
- —
- Monthly cashflow
- —
- DSCR
- —
- Eligible?
- —
Short-term bridge; refi at stabilization.
Rent comps 6 comps
| Address | Beds | Baths | Sqft | Rent | $/sqft | DOM | Units | Dist |
|---|---|---|---|---|---|---|---|---|
| 12405 Beverly Dr Whittier, CA | 4.0 | 3.0 | 2451 | $4,500 | $1.84 | 1d | 1 | 1.16mi |
| 7338 Wisteria Ln Whittier, CA | 5.0 | 4.0 | 2300 | $5,680 | $2.47 | 10d | 1 | 1.28mi |
| 7365 Autumn Ct Whittier, CA | 4.0 | 3.5 | 3082 | $6,900 | $2.24 | 1d | 1 | 1.32mi |
| 14403 7th St Whittier, CA | 4.0 | 3.0 | 2067 | $4,300 | $2.08 | 1d | 1 | 1.33mi |
| 13128 Putnam St Whittier, CA | 4.0 | 3.0 | 2080 | $4,950 | $2.38 | 1d | 1 | 1.37mi |
| 5706 Westmont Ln Whittier, CA | 4.0 | 2.5 | 1925 | $4,200 | $2.18 | 19d | 1 | 1.37mi |
Listing history 17 events
-
2026-06-18days on market $1,299,000 Active 63 DOM
-
2026-06-17days on market $1,299,000 Active 62 DOM
-
2026-06-16days on market $1,299,000 Active 61 DOM
-
2026-06-15days on market $1,299,000 Active 60 DOM
-
2026-06-13days on market $1,299,000 Active 58 DOM
-
2026-06-13days on market $1,299,000 Active 57 DOM
-
2026-06-09days on market $1,299,000 Active 54 DOM
-
2026-06-08days on market $1,299,000 Active 53 DOM
-
2026-06-07days on market $1,299,000 Active 52 DOM
-
2026-06-04days on market $1,299,000 Active 49 DOM
-
2026-06-03days on market $1,299,000 Active 48 DOM
-
2026-06-02days on market $1,299,000 Active 47 DOM
-
2026-06-01days on market $1,299,000 Active 46 DOM
-
2026-05-31days on market $1,299,000 Active 45 DOM
-
2026-04-16$1,299,000 Active
-
2003-02-20soldstatus $200,000
-
2003-02-13soldstatus $200,000
ⓘ Source: listings_history table (triggers on properties + properties_extension) + one-shot
backfill from property_details.listing_events for pre-trigger history.
Tax reassessment forecast CA · Resets to sale price
- Current annual tax
- $2,793 · $233/mo
- Projected year-2 tax
- $9,872 · $823/mo
- Expected delta
- +$7,079/yr (+$590/mo · 253.4%)
ⓘ Screening estimate from a state-policy table — verify with the county assessor before closing.
Climate risk First Street
- Flood 1/10 Low FEMA zone X (unshaded) · 0% chance over 30 yrs
- Wildfire 5/10 Major
- Heat 6/10 Major 6 d/yr ≥95°F today · 17 d/yr by 30 yrs out
- Wind 1/10 Low
- Air quality 6/10 Major 9 unhealthy d/yr today · 10 by 30 yrs out
Nearby sold comps map
Loading sold comps map…
Walkable amenities ~0.75 mi
Loading nearby amenities…
Taxation est. · year 1
- Rental income
- $156,144
- − Mortgage interest
- −$72,764
- − Property taxes
- −$2,793
- − Insurance
- −$6,495
- − Repairs & maintenance
- −$12,492
- − Management
- −$12,492
- − Depreciation
- −$37,789
- Taxable income
- $11,319
- Est. tax owed @ 24.0%
- −$2,717
- After-tax cash flow
- $29,604/yr
For passive investors: Depreciation is non-cash, so a rental often shows a tax loss while cash-flowing — sheltering income. Rental losses are passive: they offset passive income freely, and up to $25,000/yr can offset ordinary (W-2) income if you actively participate and your MAGI is under $100k (phasing out to $0 by $150k); unused losses carry forward. On sale, claimed depreciation is recaptured at up to 25%, and gains may owe capital-gains tax (a 1031 exchange can defer both). Figures are a year-1 estimate at your 24.0% rate — not tax advice; consult a CPA.
Schools (NCES district)
- District
- Whittier Union High
- NCES district ID
- 0642480
- Math proficiency
- 42% ▲ 9.00%
- Reading proficiency
- 65% ▲ 7.00%
- Median HH income
- $66,675
- Composite
- 47.19/100
- National rank
- #2321
- State rank
- #111 of 517 in CA
Livability — Whittier
- Score
- 52/100
- State rank
- #1026
- US rank
- #25003
Category grades
Schools grade is shown separately in the Schools card above.
Census & demographics
- Census place
- Whittier, CA
- County
- Los Angeles County · 9,444,647 people
- City population
- 166,703
- Metro
- Los Angeles-Long Beach-Anaheim, CA
- Population (ZIP)
- 30,078
- Household income
- $104,052
- Rent vs Own
- Severe rent burden
- 1104.0
Population outlook (Los Angeles County) Hauer SSP2
- Today (2025)
- 10,940,515 people
- By 2030
- 11,256,481 · +2.9%
- By 2040
- 11,729,929 · +7.2%
- By 2050
- 11,948,407 · +9.2%
- By 2075
- 11,818,114 · +8.0%
- By 2100
- 10,842,928 · -0.9%
Race, ethnicity, and origin ACS 2023
- Neighborhood character
- Predominantly Hispanic (71%)
- Race & ethnicity
- Hispanic / Latino 71% Two or more races 19% White 18% Asian 5% Native American 3% Black 1%
- Hispanic origin (detail)
- Mexican 59%
- Common ancestry
- Lithuanian 2% Iranian 1% Slovak 1%
- Foreign-born
- 19% · Canada, China
- Languages at home
- 55% English-only · Spanish 39% Other Indo-European 2% Tagalog/Filipino 1%
Political lean MEDSL · Los Angeles
- 2024 margin
- Solid D (+32.9) · D 64.8% · R 31.9% · Other 3.3%
- 2008→2024 swing
- -7.4pp toward R · 2008: 40.4pp · 2024: 32.9pp
- All cycles
- 2024: D+32.9 2020: D+44.2 2016: D+48.0 2012: D+40.0 2008: D+40.4
Not yet ingested
- Civics
- —
Market trends
- HPI YoY
- ▼ -890.50%
- Current HPI
- 378.8101
- Rent YoY
- ▲ 3.39%
- Metro
- Los Angeles-Long Beach-Anaheim, CA
- State GDP YoY
- ▲ 3.21%
- F500 in state
- 116
Industry mix (Fortune 500 HQ in CA)
| Industry | F500 HQs | Revenue |
|---|---|---|
| Technology | 27 | $1,492B |
|
||
| Financial Services | 3 | $174B |
|
||
| Retail | 3 | $44B |
|
||
| Insurance | 3 | $26B |
|
||
| Media / Entertainment | 2 | $115B |
|
||
| Pharmaceuticals / Biotech | 2 | $62B |
|
||
Price history
+549.5% since first listed3 events — show timeline
- 2026-04-16 Listed $1,299,000 CRMLS
- 2003-02-20 Sold (Public Records) $200,000 Public Records
- 2003-02-13 Sold (Public Records) $200,000 Public Records
Property tax history
+3.3%/yrLatest (2025): $2,793 · +12.2% YoY. Source: county tax records.
Cash-flow waterfall
monthlySold comps — $/sqft
last 12 mo · ≤1 miLoading sold comps…